Author: 0xWeilan
"Currently, as the prospects for interest rate cuts face new twists and turns, risk appetite has not fully improved, and cyclical sell-offs (cyclicality) have become the main force driving BTC's trend. Without further economic and employment data support, a shift in risk appetite could lead to a capital inflow, and if long-term selling continues, once BTC effectively breaks below the bull-bear boundary, a 'long squeeze' may occur, significantly increasing the probability of the BTC cycle ending."
—— Ultimately, BTC experienced the 'long squeeze' market we highlighted in our October report, falling 17.51% in a single month, marking the second-largest monthly decline in this cycle. By the end of the month, the maximum drawdown from the peak reached 36.45%, the largest in this cycle.
Technically, BTC briefly fell below the 'Trump bottom' established in the $90,000 to $110,000 range and has operated below the 360-day moving average for three consecutive weeks. In terms of space and time, it has completed a daily-level confirmation of 'bull to bear' and is in the process of completing a weekly confirmation, while the monthly confirmation remains to be observed.
The short-term liquidity crunch caused by the U.S. government shutdown, combined with the chaotic economic and employment data leading to a 'rollercoaster' swing in Fed rate cut expectations (mid-term liquidity tension), has triggered a massive sell-off/hedging of high-beta assets globally, as well as internal cyclical movements in the crypto market, which are the fundamental reasons for the extreme conditions in BTC and the entire crypto market. The unpredictability of macro liquidity makes it increasingly difficult to assess the 'transition from the old cycle to the new cycle' in the crypto market.
In this report, we will conduct a structured analysis of the November market based on the EMC Labs "BTC Cycle Multi-Factor Assessment Model" to seek the logic and path of the decline and to assess whether it is a 'mid-term adjustment' or a 'transition to a bear market' in the medium to long-term trend.
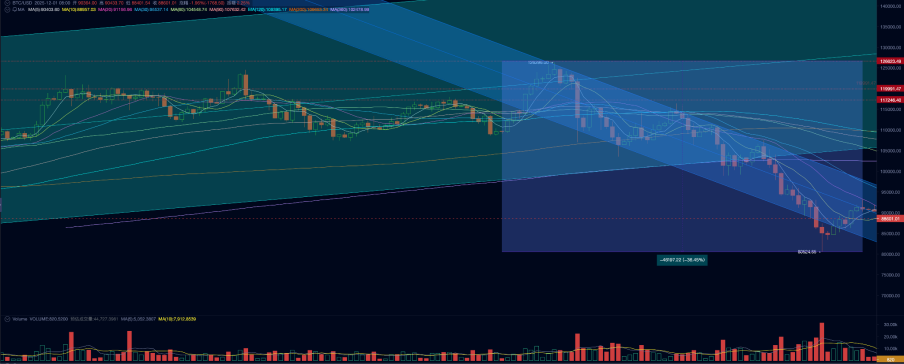
BTC Price Daily Chart
Liquidity Crisis: Exhaustion and Uncertainty
As of November 12, the U.S. government shutdown reached 43 days, setting a historical record. During the shutdown, fiscal spending was significantly compressed, but revenues from taxes and tariffs continued to flow in, creating a cash flow accumulation of 'only inflow, no outflow,' which directly pushed up the Treasury's TGA account balance at the Fed, resulting in a fierce 'water absorption' effect on the market.
The TGA balance increased by over $200 billion in a single month, with the total balance approaching $1 trillion, draining bank reserves from the private sector and creating a 'liquidity vacuum.' Bank reserves fell from about $3.3 trillion to about $2.8 trillion, nearing the market's perceived lower limit of 'ample reserves.' Ultimately, the ON RRP Rate (Overnight Reverse Repurchase Rate) and SOFR (Secured Overnight Financing Rate) remained consistently above the IORB (Interest on Reserve Balances), making it difficult for trading institutions to obtain sufficient funds from banks, even forcing them to repay loans.
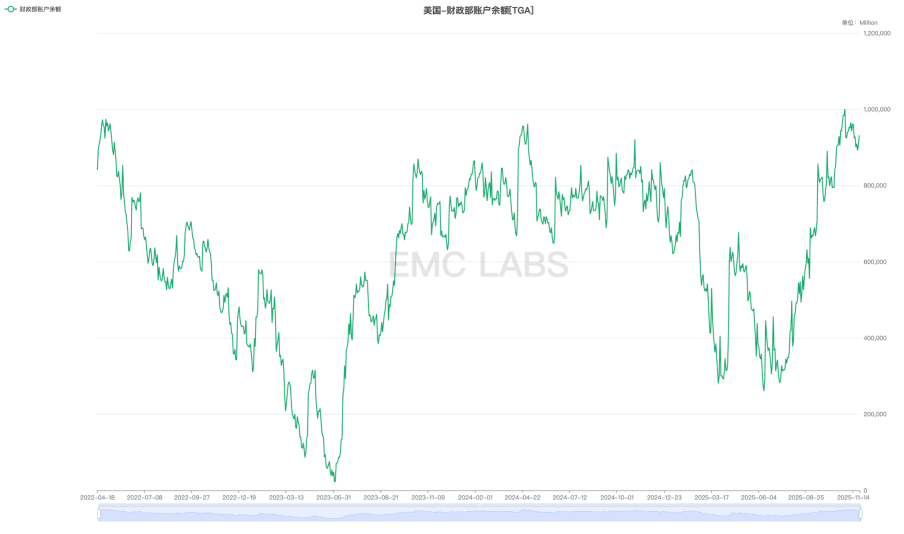
U.S. Treasury TAG Account Balance
The Fed announced its second interest rate cut of the year at the FOMC meeting on October 29. Many judged that mid-term liquidity was being released but overlooked the microstructural constraints—the actual liquidity released by the Fed has been continuously declining since late July.

Fed Market Liquidity Net Injection
The liquidity crunch has pushed up the cost of capital in the trading market, exerting pressure on the valuations of U.S. AI concept stocks and high-beta assets like BTC.
EMC Labs noted that as actual liquidity gradually dried up, market risk appetite deteriorated, and the valuation pressure ultimately led to a sequential sell-off of high-beta assets, with BTC being the first link in this sell-off chain.
In early October, BTC ETF inflows were abundant, driving BTC to a historical high, but as the Fed's market liquidity injections fell to a low, outflows began, and subsequently, the overall trend was dominated by significant outflows.
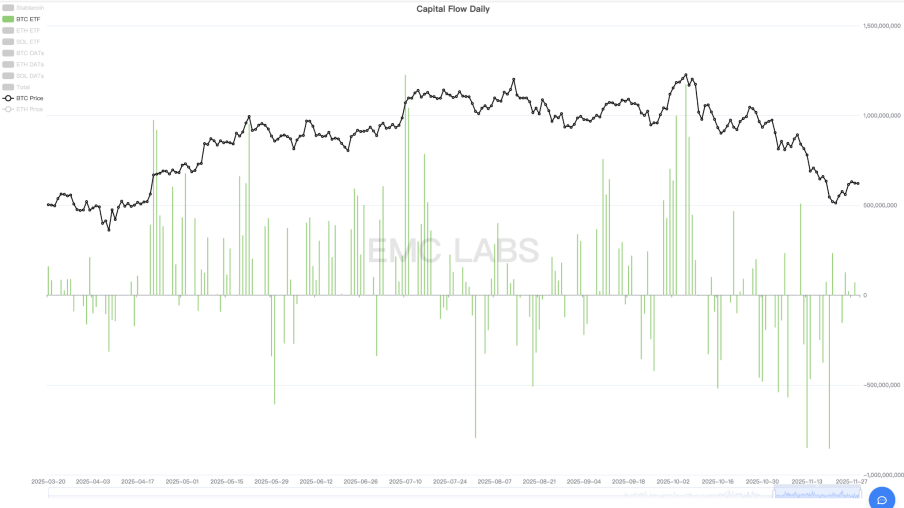
Statistics of Inflows and Outflows of 11 U.S. ETFs (Daily)
Similarly, the Nasdaq AI concept stocks, which are also high-beta assets, outperformed crypto assets lacking fundamental support. After BTC began to decline and initiate rebalancing, it continued to reach historical highs driven by the strong earnings reports of the seven tech giants until it started to break down on November 4.
After the U.S. stock market broke down, capital in the crypto market further accelerated its outflow. On one hand, there was a continuous withdrawal of funds from the BTC ETF channel, and on the other hand, further selling from long-term holders in the market led to BTC breaking down further ahead of the Nasdaq, both reaching the low point of this round of adjustments on November 21.
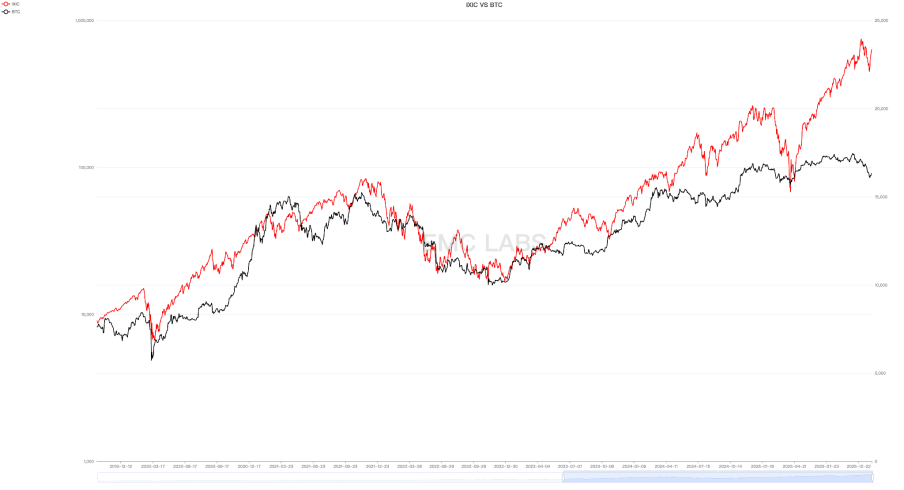
Nasdaq vs. BTC Price Trend
During this period, BTC adjusted nearly a month ahead of the Nasdaq, with a magnitude nearly four times that of the Nasdaq (BTC: -36.45%, Nasdaq: -8.87%), showing greater elasticity than before.
In addition to the short-term liquidity pressure, we continue to monitor an important indicator of mid-term liquidity expectations—the probability of a Fed rate cut in December. In October, the probability of a December rate cut reached as high as 98.78% (on October 20), but after continuous 'hawkish' comments from Fed officials, it fell to a low of 30.07% (on November 19). The weakening of mid-term liquidity expectations and the resulting changes in risk appetite undoubtedly exacerbated traders' sell-off of high-beta duration assets.
On November 12, the U.S. government ended the shutdown, and short-term liquidity began to be slowly released, but the Fed's continued 'hawkish' stance meant that the probability of a December rate cut remained on the decline. We judge that initially, there was a real short-term liquidity exhaustion, followed by a pessimistic expectation of mid-term liquidity, which jointly dominated the recent declines and price rebalancing in the U.S. stock and crypto markets.
The true turning point for BTC and the U.S. stock market occurred on November 21. On that day, which was a Friday, John Williams, the third-ranking official of the Fed and president of the New York Fed, stated in a public forum that the risks of a downturn in employment had increased, and there was room for further adjustments to the federal funds rate to bring the policy stance closer to a neutral range. This statement was interpreted as the opinion of the Fed's 'management,' and that day, the probability of a December rate cut quickly traded above 70%, with both the U.S. stock market and BTC turning from decline to rise.
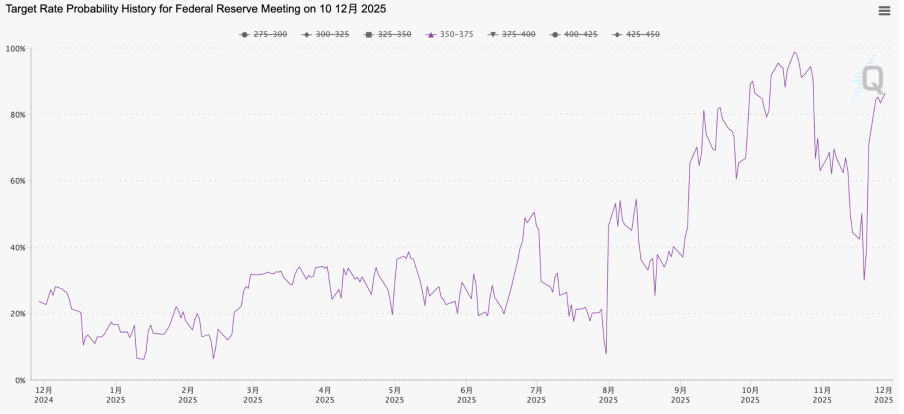
FedWatch December 25 Basis Point Rate Cut Probability
Subsequently, on November 26, the Fed's Beige Book was released, indicating that economic and employment conditions were indeed deteriorating. This information further alleviated market concerns that the Fed might choose to be conservative and not cut rates due to a lack of sufficient economic and employment data before the December meeting. The probability of a December rate cut gradually rose above 80%, reversing from Powell's statement on October 30 that it was 'by no means a done deal.'
The adjustment in the U.S. stock market in November also included concerns about overvaluation of AI concept stocks, leading to a 20% adjustment in leading stock Nvidia, with weak rebounds. However, overall, it was more a dual adjustment of risk appetite and valuation caused by short-term liquidity pressure and mid-term liquidity uncertainty. Therefore, as the short-term liquidity turning point appeared and the probability of a December rate cut returned to a high level, the Nasdaq recorded gains in all four trading days of the last week of November, attempting to recover the historical high set on October 29.
Although the U.S. stock market rebounded strongly, short-term market risks seem to have been eliminated. However, liquidity risks have not been completely resolved, and short-term liquidity has not shown significant improvement. In terms of mid-term liquidity, although a December rate cut is nearing a 'done deal,' whether the market can continue to cut rates in the first quarter of next year will still depend on the upcoming economic and employment data.
Internal Structure: Repricing and Major Turnover
With the turning point of the liquidity crisis appearing, the Nasdaq may soon recover its previous historical high, but the elastic performance of BTC in the simultaneous rebound is vastly different, still having over 38% space from the historical high of October 6. We believe that the weak price performance is partly due to BTC's greater elasticity than the Nasdaq, and partly due to severe internal structural damage compounded by 'cyclicality' sell-offs.
First, through the eMerge Engine's comprehensive statistics on capital inflows and outflows in the crypto market, we can see that in November, the crypto market recorded over $3.6 billion in outflows, with the BTC ETF channel accounting for $3.382 billion, the ETH ETF channel for $1.352 billion, stablecoins for $615 million, and SOL ETF recording a positive inflow of $412 million. The BTC/ETH/SOL treasury companies overall recorded a positive inflow of approximately $1.298 billion.
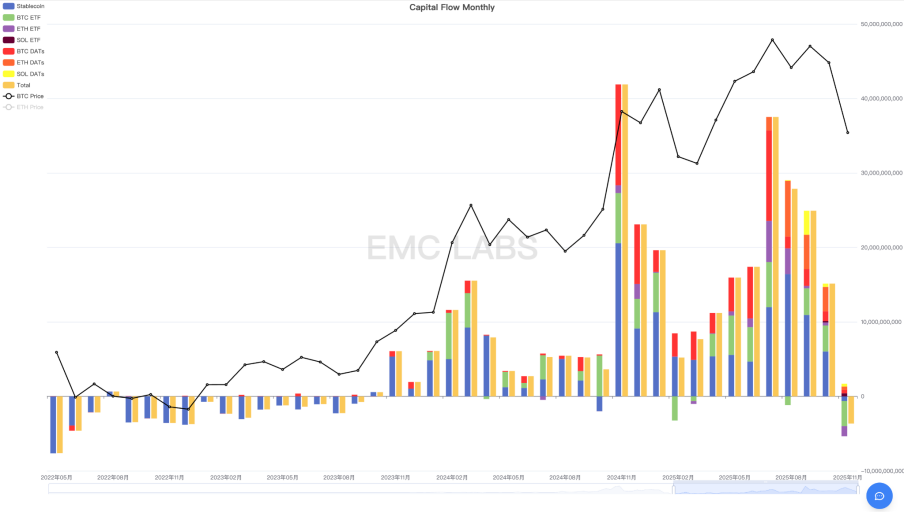
Comprehensive Statistics of Capital Inflows and Outflows in the Crypto Market (Monthly)
In November, the crypto market recorded the largest single-month outflow in this cycle, and this occurred after three consecutive months of reduced inflows. This is the fundamental reason for BTC experiencing the largest decline in this cycle this month. Among them, outflows from the BTC ETF channel accounted for 93.94% of the overall outflows, so we attribute this round of adjustment mainly to the liquidity crisis leading to a downward repricing of high-beta assets like BTC.
Secondly, the cyclical reduction in holdings by long-term holders driven by cyclicality is also an important reason. Since this cycle began, long-term holders of BTC have conducted three rounds of large-scale sell-offs: the first wave from January to March 2024, the second wave from October 2024 to January 2025, and the third wave, which is the current deep adjustment of BTC prices from July to November 2027.
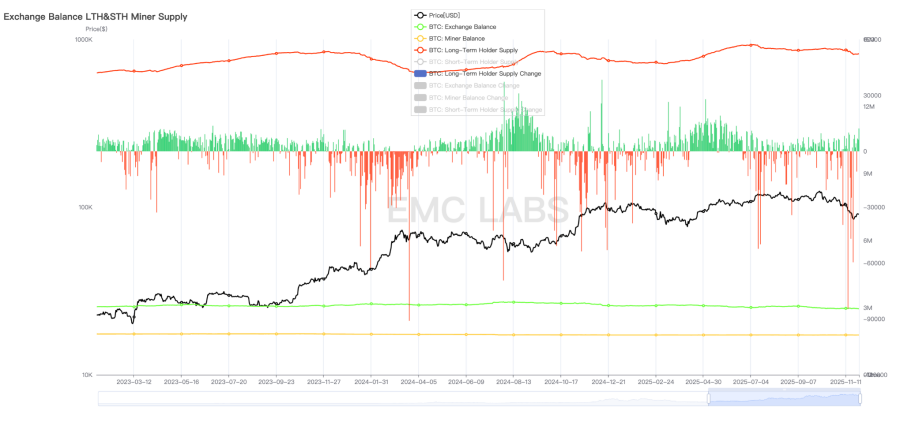
Statistics of BTC Long-Term Holdings and Position Changes (Daily)
Unlike the previous two rounds of large-scale reductions during BTC price increases, this round of reductions mainly occurred during the price stabilization or even rapid decline from July to November. This behavior of long-term holders is not unusual and remains consistent with their actions after the 'bull to bear' transition. Considering the significant influence of the 'ideological stamp' of the halving bull market formed over more than a decade, and the 'coincidence' of reaching past cycle bull market highs around October, we believe there is indeed a sufficiently large group of long-term holders still adhering to 'cyclicality' and conducting sell-offs after the 'bull to bear' transition. This sell-off is a significant reason for amplifying BTC's decline.
Finally, BTC's current decline is not only constrained by the above two factors but also affected by other negative factors such as futures arbitrage traders and crypto market makers suffering heavy losses due to the 'Binance USDe decoupling incident.'
The brutal decline has already occurred, with some people selling off heavily while others seize the opportunity to increase their positions. Ultimately, a large-scale turnover of BTC has taken place, and after the turning point of macro liquidity expectations, the market has finally welcomed a moment of respite.
Through the analysis of on-chain data for BTC, we found that around $84,000, over 430,000 BTC were re-priced, marking a significant entry in the history of BTC redistribution.
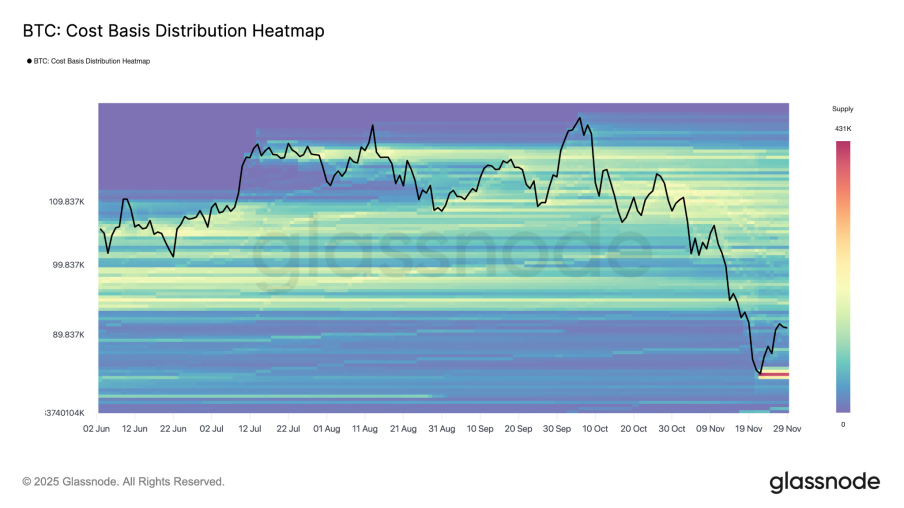
BTC On-Chain Cost Distribution Heatmap
Long-term holders of BTC have been continuously buying and accumulating chips during the decline, while gradually selling to new short-term entrants during market rises. This fundamental movement, along with the BTC halving, has constituted the previous cycles of bull and bear transitions for BTC. Today, as the consensus around BTC spreads on Wall Street, the holding structure is undergoing a fundamental change, with BTC ETF holders and treasury companies becoming new long-term investors. We have discussed multiple times in our monthly reports whether the old cycle will change due to the new market structure and whether the new cycle will shape a new form.
Today, we still do not have an answer. However, if the current sell-off by long-term BTC holders ultimately extinguishes market enthusiasm and the market trend reverses back into a bear market, then we can say that the new cycle has not yet been successfully shaped.
Conclusion
In November, the short-term macro liquidity exhaustion and the shift to pessimistic mid-term macro liquidity expectations drove a valuation kill and downward repricing across markets, including Nasdaq AI concept stocks and crypto assets. Subsequently, as expectations changed, both markets began to rebound.
The internal movements and structural vulnerabilities within the crypto market exacerbated the intensity of this adjustment.
In this round of adjustment, both the scale of capital outflows and the magnitude of BTC's drawdown were the largest in a single month for this cycle.
Based on this logic, we judge that the short-term price turning point appeared on November 21. Following this, with the expected rate cut in December and the end of the Fed's quantitative tightening (QT), U.S. macro liquidity is expected to improve, and capital may flow back into the crypto market, further driving price rebounds. If this continues with the bull market in U.S. stocks in 2026, reaching new highs, BTC would break away from the old cycle and enter a new cycle dominated by Wall Street institutions. If capital cannot flow back, it can be determined that the shaping of the new cycle has failed, the old cycle still dominates the market, and the BTC bull market since November 2022 will transition into a bear market, seeking a bottom once again.
免责声明:本文章仅代表作者个人观点,不代表本平台的立场和观点。本文章仅供信息分享,不构成对任何人的任何投资建议。用户与作者之间的任何争议,与本平台无关。如网页中刊载的文章或图片涉及侵权,请提供相关的权利证明和身份证明发送邮件到support@aicoin.com,本平台相关工作人员将会进行核查。


