In traditional finance, the asset turnover ratio is generally used to measure asset utilization efficiency, thereby assessing sales, conversion rates, and so on. But what happens if we apply the same metric to the cryptocurrency space?
You will discover a whole new perspective. This article is a sister piece to the analysis of Nvidia's financial report (https://x.com/agintender/status/1991890344653570186?s=20) and aims to showcase the diversity of data and the application of "financial techniques" in the crypto world to practitioners.
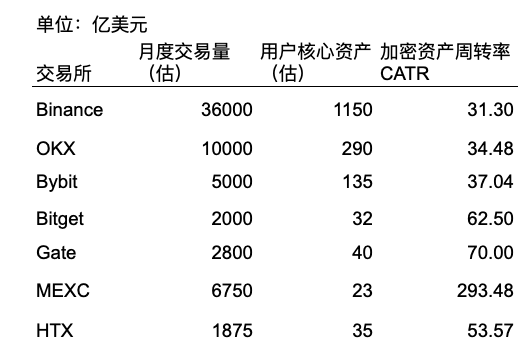
This article is 4,500 words long; for those who are too lazy to read the main text, you can directly look at the table below:
Disclaimer: This article is based on publicly available information and insights derived from personal estimations. The conclusions may contain errors or inaccuracies, so please do not rely on them. This article is intended solely for academic exchange purposes.
I. Theory
From the perspective of business supply, the scale of assets held by exchanges should be positively correlated with their trading volume:
Liquidity Supply: Assets held on exchanges (especially those held by market makers) are deployed into the order book to facilitate trading. More assets typically mean a deeper order book and a higher capacity for trading volume.
User Activity: The primary purpose for users to deposit funds into a CEX is trading. While some users use CEX as a wallet (HODLing), in active exchanges, the velocity of money means that a portion of reserves will turn over daily.
Trust Magnet Effect: High trading volume attracts liquidity, which in turn demands deposits. Conversely, high deposits signal attract active traders.
Additionally, there is an urban legend that the current earnings of an exchange = current incoming assets x 20-30% (commonly referred to as asset sedimentation).
II. Metric: Defining "Crypto Asset Turnover Ratio" (CATR)
To facilitate horizontal comparison, the Crypto Exchange Asset Turnover Ratio (CATR) is defined as follows:
CATR = Monthly Trading Volume (Contracts + Spot) / User Assets (POR Value)
From a traditional accounting perspective, the asset turnover ratio measures how quickly a company generates sales revenue from its total assets over a certain period, typically calculated as "net sales revenue" divided by "average total assets." A higher ratio indicates higher asset utilization efficiency, greater conversion capability, stronger sales ability, and higher turnover rates.
However, in the context of cryptocurrency exchanges, while it still represents asset utilization efficiency, the meaning is entirely different. This money belongs to the users, and a higher turnover rate indicates a higher willingness to trade (and perhaps trading enthusiasm?) among users, leading to greater unit benefits from trading.
Generally speaking, market makers have higher efficiency requirements for fund usage (arbitrage, market making, etc.), while retail investors have lower efficiency requirements.
Low turnover efficiency may indicate that the exchange is primarily used for custody or deposits, or that user participation is extremely low.
High turnover efficiency indicates extreme fund velocity. This is typically seen on platforms focused on contracts (high leverage), indicating strong user trading willingness and high transaction efficiency among market makers.
However, if there is an extreme turnover efficiency, it may raise suspicions of wash trading and matched orders.
This article is merely a starting point, hoping to inspire readers to explore more interesting and efficient metrics and data dimensions. The crypto market is not too difficult; rather, we lack a systematic approach to viewing this market.
III. Data Explanation
Sample: Binance, OKX, Bybit, Bitget, Gate, MEXC, and HTX
Data Sources:
Monthly trading volume for exchanges in October:
https://data.coindesk.com/reports/exchange-review-november
https://www.scribd.com/document/831768086/CCdata-crypto-exchange-review-12-24
Based on the above data sources, we estimate the spot + contract trading volume for each exchange.
POR data sources: Disclosures from various exchanges,
https://www.binance.com/en/proof-of-reserves
https://www.okx.com/en-sg/proof-of-reserves
https://www.bybit.com/app/user/proof-of-reserve
https://www.mexc.com/proof-of-reserve
https://www.bitget.com/support/articles/12560603840435
https://www.gate.com/proof-of-reserves
https://www.htx.com/en-us/proof-of-reserve
Note: The core user assets in this article only include BTC, ETH, USDT, and USDC, so there may be discrepancies with the total asset data actually disclosed by the exchanges.
IV. CATR Data for Each Exchange
4.1 Binance
4.1.1 Proof of Reserves (PoR) Analysis
Snapshot data as of October 2025:
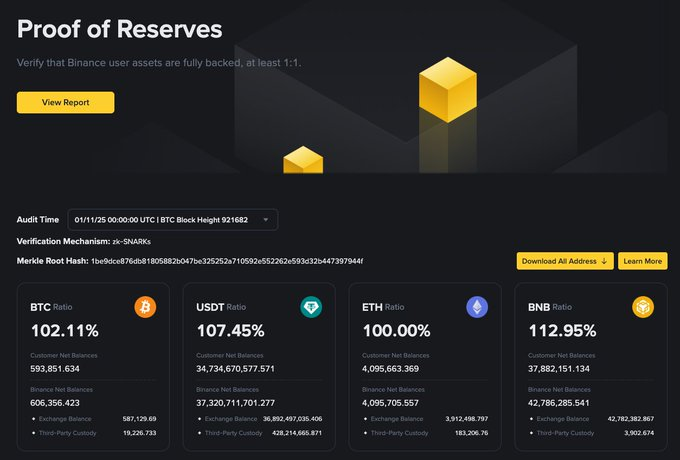
BTC: 593,851
ETH: 4,095,663
USDT: 34.7 billion (Collateralization rate of 107.45)
USDC: 7.8 billion (Collateralization rate of 133.79%)
Estimated total core user assets: 115 billion USD
4.1.2 Trading Volume Analysis
In October 2025, activity on centralized exchanges surged. CCData shows that the total trading volume for global CEXs reached 10.3 trillion USD. Binance typically holds about 40%-50% of the market share.
Spot Trading: Data indicates that Binance's monthly trading volume in October was approximately 810.4 billion USD.
Contract Trading: Contracts are usually 3-4 times the spot volume. Combining data from TokenInsight and CryptoQuant, Binance's quarterly trading volume reached 8.39 trillion USD, averaging about 2.8 trillion USD per month.
Comprehensive Estimate: The total trading volume for Binance in October (spot + contract) is conservatively estimated to be between 3.6 trillion USD.
4.1.3 Crypto Asset Turnover Ratio (CATR) Calculation
36000 / 1150 = 31.304x
4.2 OKX
4.2.1 Proof of Reserves (PoR) Analysis
Snapshot data as of October 2025:
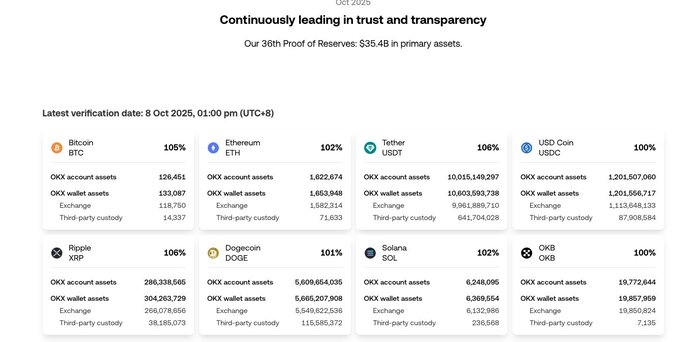
BTC: 133,087 (Collateralization rate of 105%)
ETH: 1,622,674
USDT: 10 billion (Collateralization rate of 106%)
USDC: 120 million
Estimated total core user assets: 30 billion USD
4.2.2 Trading Volume Analysis
CCData reports that OKX's spot trading volume in November was 163 billion USD (similar to October data). OKX's contract business has historically been strong, usually 4-5 times the spot volume.
Comprehensive Estimate: If the spot volume is 163 billion USD, the contract volume is approximately 700-800 billion USD. Total monthly trading volume is about 1 trillion USD.
4.2.3 Crypto Asset Turnover Ratio (CATR) Calculation
10000 / 290 = 34.48x
4.3 Bybit
4.3.1 Proof of Reserves (PoR) Analysis
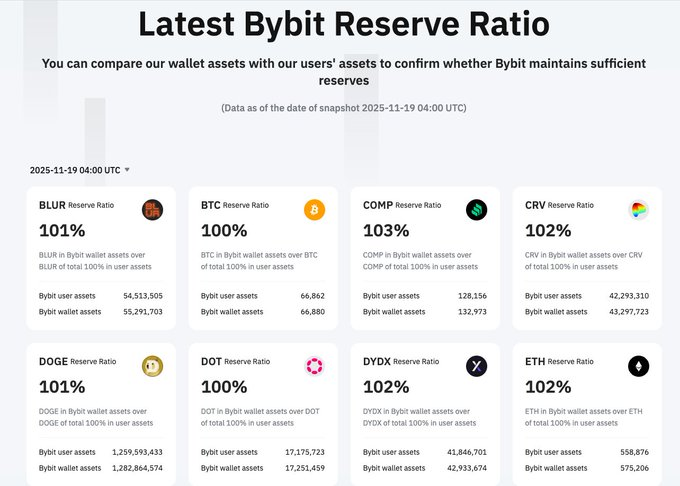
Data as of October 22, 2025:
USDT: User assets 5.8 billion, wallet balance 6.38 billion (110%).
USDC: User assets 600 million. Wallet balance 680 million (135%).
BTC: 61,976 BTC (approximately 5.6 billion USD).
ETH: 532,000 ETH (approximately 1.5 billion USD).
Estimated total assets: approximately 13.5 billion USD.
4.3.2 Trading Volume Analysis
Bybit's growth has been rapid, with CCData showing its spot trading volume reaching 208 billion USD in November. Considering Bybit is a contract-first platform, its contract trading volume is usually 3-4 times the spot volume.
Comprehensive Estimate: Spot 200 billion + Contract 800 billion ≈ 1 trillion USD.
Given that Bybit counts buy-sell transactions once each, the trading volume should be divided by 2, resulting in 500 billion USD.
4.3.3 Crypto Asset Turnover Ratio (CATR) Calculation
5000 / 135 = 37.31x
4.4 Bitget
4.4.1 Proof of Reserves (PoR) Analysis
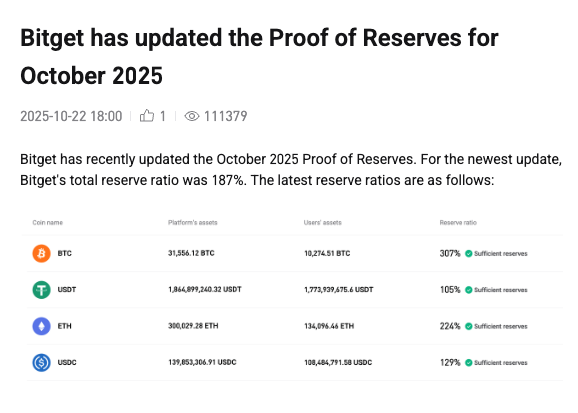
Data for October 2025:
BTC: Users hold 10,275 BTC, the platform has 31,556 BTC (fun fact: Bitget's BTC reserve rate is as high as 307%, which is to show strong self-funding?!).
ETH: The platform has nearly 300,000 ETH, users hold 134,000 (ETH's reserve rate also reaches a staggering 224%).
USDT: 1.78 billion + USDC 110 million.
Estimated total user assets: approximately 3.2 billion USD (platform assets estimated at 5.2 billion USD).
4.4.2 Trading Volume Analysis
Bitget reported that its US stock futures trading volume exceeded 200 million USD in October. Although the absolute value is not large, it shows product diversification. CCData indicates its spot trading volume is approximately 80.2 billion USD. In terms of contracts, Bitget previously reported monthly futures trading volume reaching 92 billion USD, which could be higher in a bull market.
Comprehensive Estimate: Spot 80 billion + Contract 320 billion ≈ 400 billion USD.
Given that Bitget counts each buy-sell transaction once, the trading volume should be divided by 2, resulting in 200 billion USD.
4.4.3 Crypto Asset Turnover Ratio (CATR) Calculation
2000 / 32 = 62.5x
4.5 Gate.io:
4.5.1 Proof of Reserves (PoR) Analysis
As of October 28, Gate.io reported a total reserve value of 11.676 billion USD, with a reserve rate of 124%.
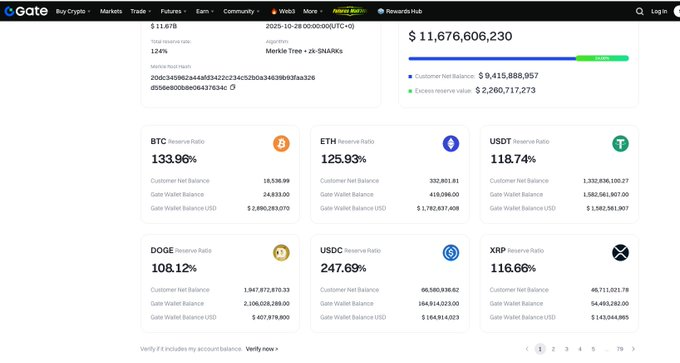
Interestingly, Gate's core asset collateralization rates far exceed 100%, meaning platform assets > user assets.
The core user asset situation is as follows:
BTC 18,536 (Collateralization rate 133.96%)
ETH 332,801
USDT 1.332 billion
USDC 67 million (Collateralization rate nearly 250%)
Total core user assets: approximately 4 billion USD, with platform assets at 6.3 billion USD.
4.5.2 Trading Volume Analysis
Gate.io's spot trading volume surged by 39.1% in October, reaching a historical high of 163 billion USD. For contracts, the data in May was 264 billion USD, with an estimate of around 400 billion USD in October. (https://www.globenewswire.com/news-release/2025/06/23/3103369/0/en/Gate-s-Nearly-70-MoM-Growth-in-Derivatives-Volume-Tops-Global-Charts-Featured-in-CoinDesk-s-Latest-Report.html)
Comprehensive Estimate: Spot 163 billion + Contract 400 billion ≈ 560 billion USD.
Given that Gate counts each buy-sell transaction once, the trading volume should be divided by 2, resulting in 280 billion USD.
4.5.3 Crypto Asset Turnover Ratio (CATR) Calculation
2800 / 40 = 70x
4.6 MEXC
4.6.1 Core User Asset Data

USDT: User assets 1.723 billion USD (platform assets 2.245 billion, collateralization rate at 130%)
BTC: User assets 3,555 BTC (approximately 300 million USD).
ETH: User assets 54,357 ETH (approximately 160 million USD)
USDC: Around 100 million USD
Estimated total assets: approximately 2.3 billion USD.
4.6.2 Trading Volume Analysis
According to Coingecko's spot data, the average daily spot trading volume over the past 30 days was 3.3 billion, with a monthly trading volume estimated at 100 billion; the daily contract trading volume was 45 billion, with a monthly trading volume estimated at 1.35 trillion. (I really couldn't find a reliable data source, so please bear with me.)
Given that MEXC counts each buy-sell transaction once, the trading volume should be divided by 2, resulting in 675 billion USD.
Interestingly, TokenInsight reports that MEXC ranks second in global spot trading, capturing about 9% market share (https://www.globenewswire.com/news-release/2025/10/30/3177141/0/en/TokenInsight-MEXC-Ranks-Second-in-Global-Spot-Trading-Capturing-11-of-Market-Share-in-Q3-2025.html).
4.6.3 Crypto Asset Turnover Ratio (CATR) Calculation
6750 / 23 = 293.48x
4.7 HTX
4.7.1 Core User Asset Data
According to HTX's disclosures in October, user assets are as follows:
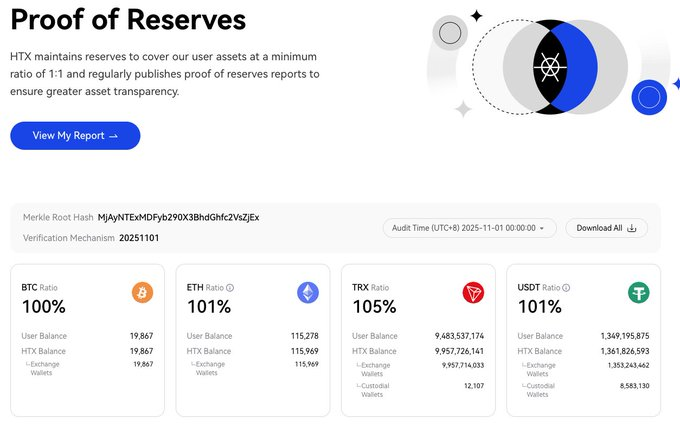
BTC 19,867
ETH 115,278
USDT 1.35 billion
USDC 37 million
Estimated total core user assets: approximately 3.5 billion USD.
4.7.2 Trading Volume Analysis
According to Coingecko's data, HTX's average daily contract trading volume was 8.5 billion. Over 30 days, this amounts to 255 billion; the average daily spot trading volume was around 4 billion, totaling 120 billion over 30 days.
Comprehensive Estimate: Monthly trading volume is approximately 337.5 billion USD.
Given that HTX counts each buy-sell transaction once, the trading volume should be divided by 2, resulting in 187.5 billion USD.
4.7.3 Asset Turnover Ratio (ATR) Calculation
1875 / 35 = 53.57x
This article is merely a starting point, hoping to inspire readers to explore more interesting and efficient metrics and data dimensions. The crypto market is not too difficult; rather, we lack a systematic approach to viewing this market.
免责声明:本文章仅代表作者个人观点,不代表本平台的立场和观点。本文章仅供信息分享,不构成对任何人的任何投资建议。用户与作者之间的任何争议,与本平台无关。如网页中刊载的文章或图片涉及侵权,请提供相关的权利证明和身份证明发送邮件到support@aicoin.com,本平台相关工作人员将会进行核查。


