Even though Bitcoin is indeed in a bear market right now, this bear market may not last too long.
整理 & 编译:深潮TechFlow

Podcast Source: 10x Research
Original Title: A Deep Dive into Bitcoin Bear Market On Chain and Market Indicators
Broadcast Date: November 13, 2025
Key Summary
About 10x Research
Predicted the lowest point for Bitcoin in October 2022 and expects Bitcoin to rise to $63,160 by March 2024 before the halving (halving date adjusted to April, final price $63,491).
In January 2023, we predicted Bitcoin would rise to $45,000 before Christmas, a prediction that has been realized (final price $43,613).
In September 2023, we pointed out that Bitcoin mining companies would become a key investment direction for 2024. Recently, in November 2023, we predicted Bitcoin would rise to $57,000 after the ETF approval.
Predicting Bitcoin will rise to $70,000 in January 2024 and experience a pullback around the March 2024 peak.
In this podcast, 10x Research will provide in-depth analysis of the Bitcoin bear market:
What do on-chain data and market signals really tell us? Has Bitcoin entered a bear market? How should traders respond now?
In the past three weeks, especially in our report on October 22, we have repeatedly emphasized some key signals. The crash on October 10, the subsequent unusual behavior of investors, and Federal Reserve Chairman Powell's uncertain stance on the prospects for a rate cut in December are not isolated events but manifestations of the same macroeconomic backdrop.
With the SEC approving Bitcoin ETFs, regulation is no longer the main obstacle to a bull market. The real reason for the stagnation of the bull market is that when market capital inflows weaken and profit-taking exceeds new demand, the market loses upward momentum.
This podcast will analyze charts, capital flows, and various data points in detail to help you determine whether Bitcoin is currently in a bull or bear market. Even though Bitcoin is indeed in a bear market right now, this bear market may not last too long.
Highlights
When Bitcoin's price falls below the 21-week moving average (EMA), the market enters a small bear market.
If Bitcoin's price falls below the range of $110,000 - $112,000, we will maintain a bearish outlook; if the price breaks above this range, it may turn bullish.
In the past 30 days, long-term holders have sold 185,000 Bitcoins, totaling about $20 billion. Long-term holders believe the current market may decline further, thus choosing to exit the market.
On-chain data also indicates that this may be a deeper market correction. The market currently seems to have entered a bear market phase dominated by sell-offs. Sell-offs may take various forms and could last longer.
We predict Bitcoin may rebound to $110,000 before declining again.
Historically, when Bitcoin's price falls below the realized price, the market typically enters a deep bear market phase. The current realized price is about $82,000, which is an important dividing line between the end of the Bitcoin bull market and the beginning of the bear market. If the price falls below this level, the market may first test the key support level of $93,000.
As long as Bitcoin's price is below $113,000, we will continue to maintain a bearish market outlook.
Whether Bitcoin's price is below the 21-week moving average is an important indicator for judging market trends.
We expect the next bull market may start after a shift in the Federal Reserve's monetary policy, which is one of the core factors we are closely monitoring.
Bitcoin Falls Below 21-Week EMA — A Key Threshold for the Bull Market
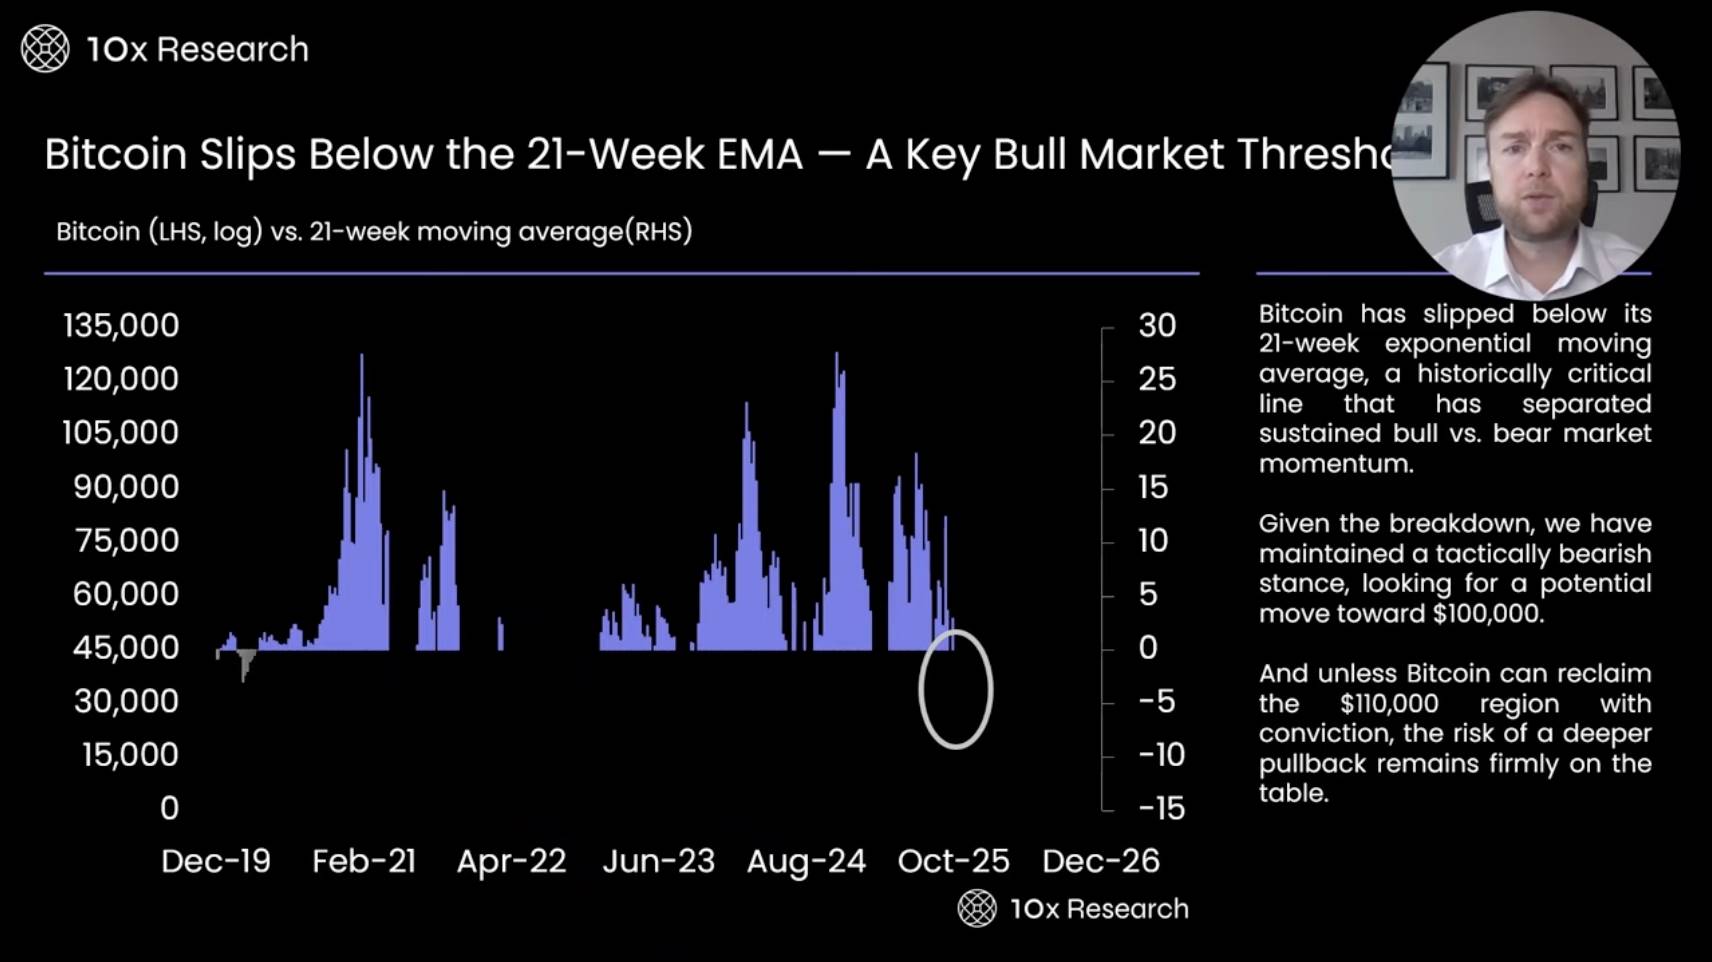
The key indicator we are currently focusing on is the 21-week moving average (EMA). Typically, when Bitcoin's price falls below this indicator, the market enters a small bear market. This indicator played a crucial role when the market transitioned from bull to bear in 2022, helping us avoid significant losses that many faced in the market.
Additionally, we have observed market adjustments in the summer of 2024 and corrections in the first quarter of this year. This indicator not only confirmed these corrections but also warned us in advance. These adjustments usually range from 30% to 40%, having a significant impact. Therefore, it is crucial to set a clear reference line, and the current reference line is $110,000.
Multiple indicators point to Bitcoin's price in the range of $110,000 to $112,000; if Bitcoin's price falls below this range, investors need to manage risks, reduce bullish positions, and maintain a neutral or even bearish stance.
The current EMA indicator shows that Bitcoin's price should fluctuate between $100,000 and $110,000, and the actual trend aligns with this prediction. This compels us to seriously consider: Is the current market entering an accelerated declining bear market phase?
Long-Term Holders Sell $20 Billion in Bitcoin
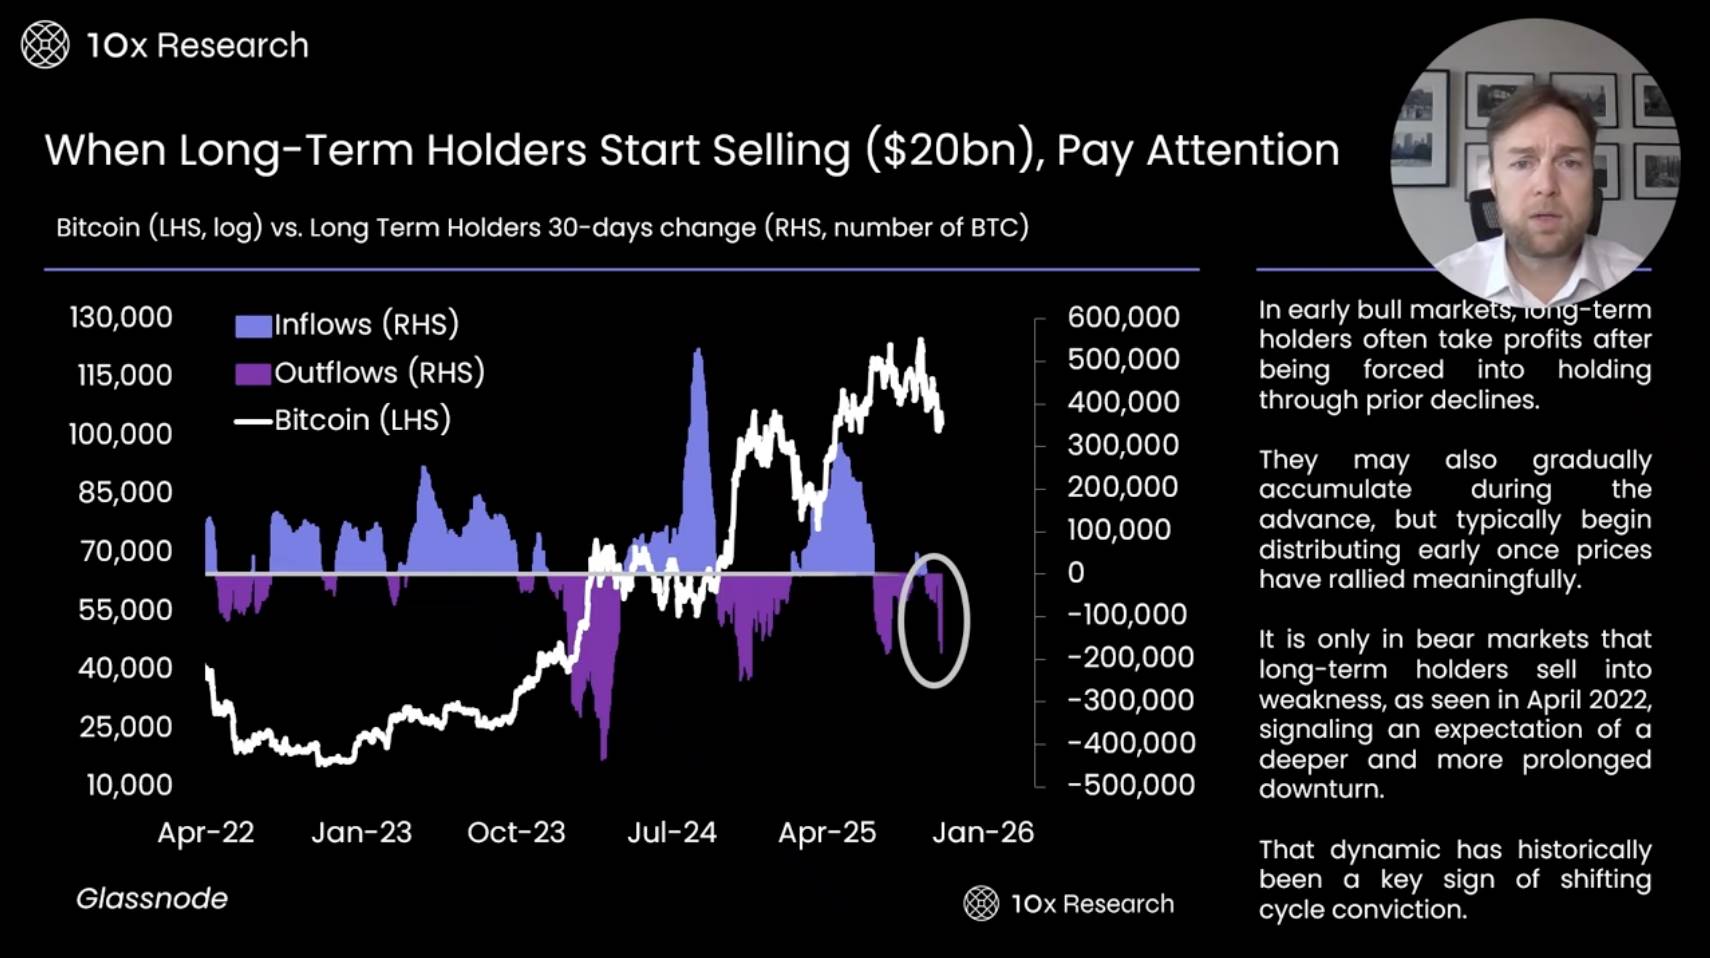
We need to pay special attention to the movements of long-term holders. In the past 30 days, long-term holders have sold 185,000 Bitcoins, totaling about $20 billion. Typically, long-term holders tend to sell when prices rise and buy during price consolidations, bottoms, or early rebounds. As the market rises further, they gradually exit and continue to reduce holdings at price peaks.
Looking back at April 2022, long-term holders sold a large amount of Bitcoin, causing the price to drop from $40,000 to $20,000, even touching a low of $15,000 at one point. This phenomenon is noteworthy. In recent weeks, Bitcoin's price has continued to decline, dropping from $12,600 to the current range of $10,000 to $13,000. Yet, long-term holders have not stopped selling Bitcoin.
This at least indicates that long-term holders believe the current market may decline further, thus choosing to exit the market. Whether their judgment is correct remains to be seen.
Realized Market Cap vs. Market Cap Comparison: Revealing Reliable Signals of Bitcoin Cycle Changes
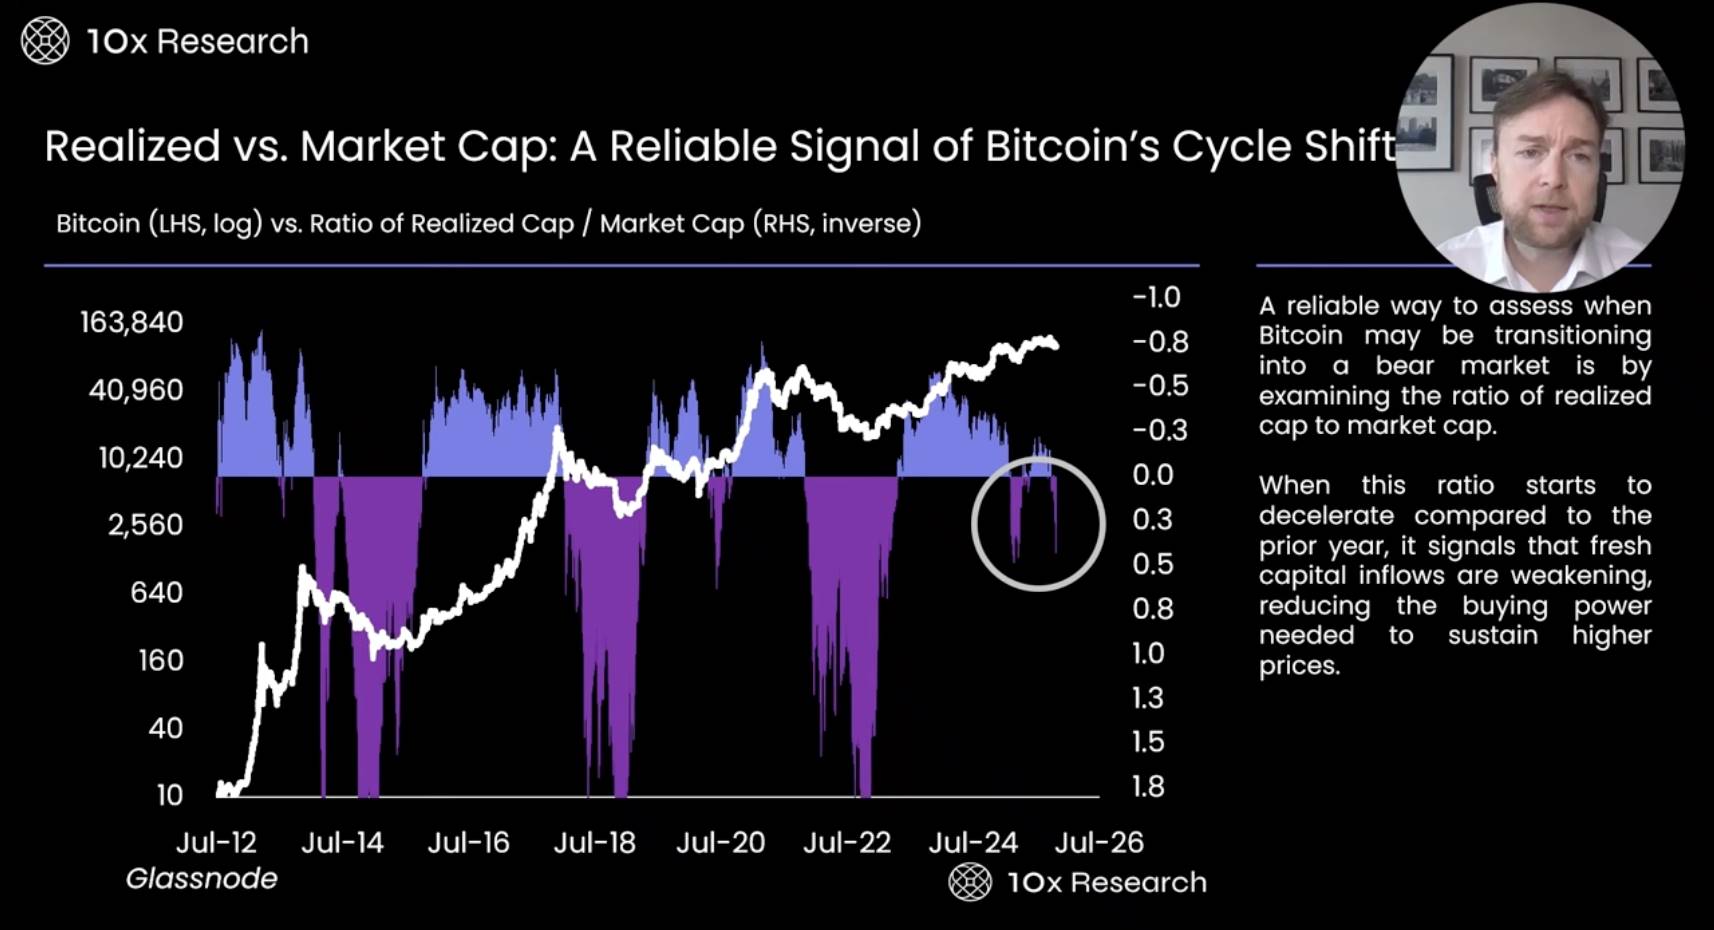
The ratio of realized market cap to market cap is a key indicator we frequently use. In previous bear markets, this indicator played an important role, successfully predicting large-scale bear markets and accurately forecasting similar small bear markets.
When this indicator is negative, it usually means the market is in a correction phase, at which point it is advisable for investors to exit the market, remain on the sidelines, or adopt a bearish strategy. I believe the current market is in this phase, which is worth our close attention.
Bitcoin Bull Market Momentum Weakens, Capital Inflows Gradually Decrease
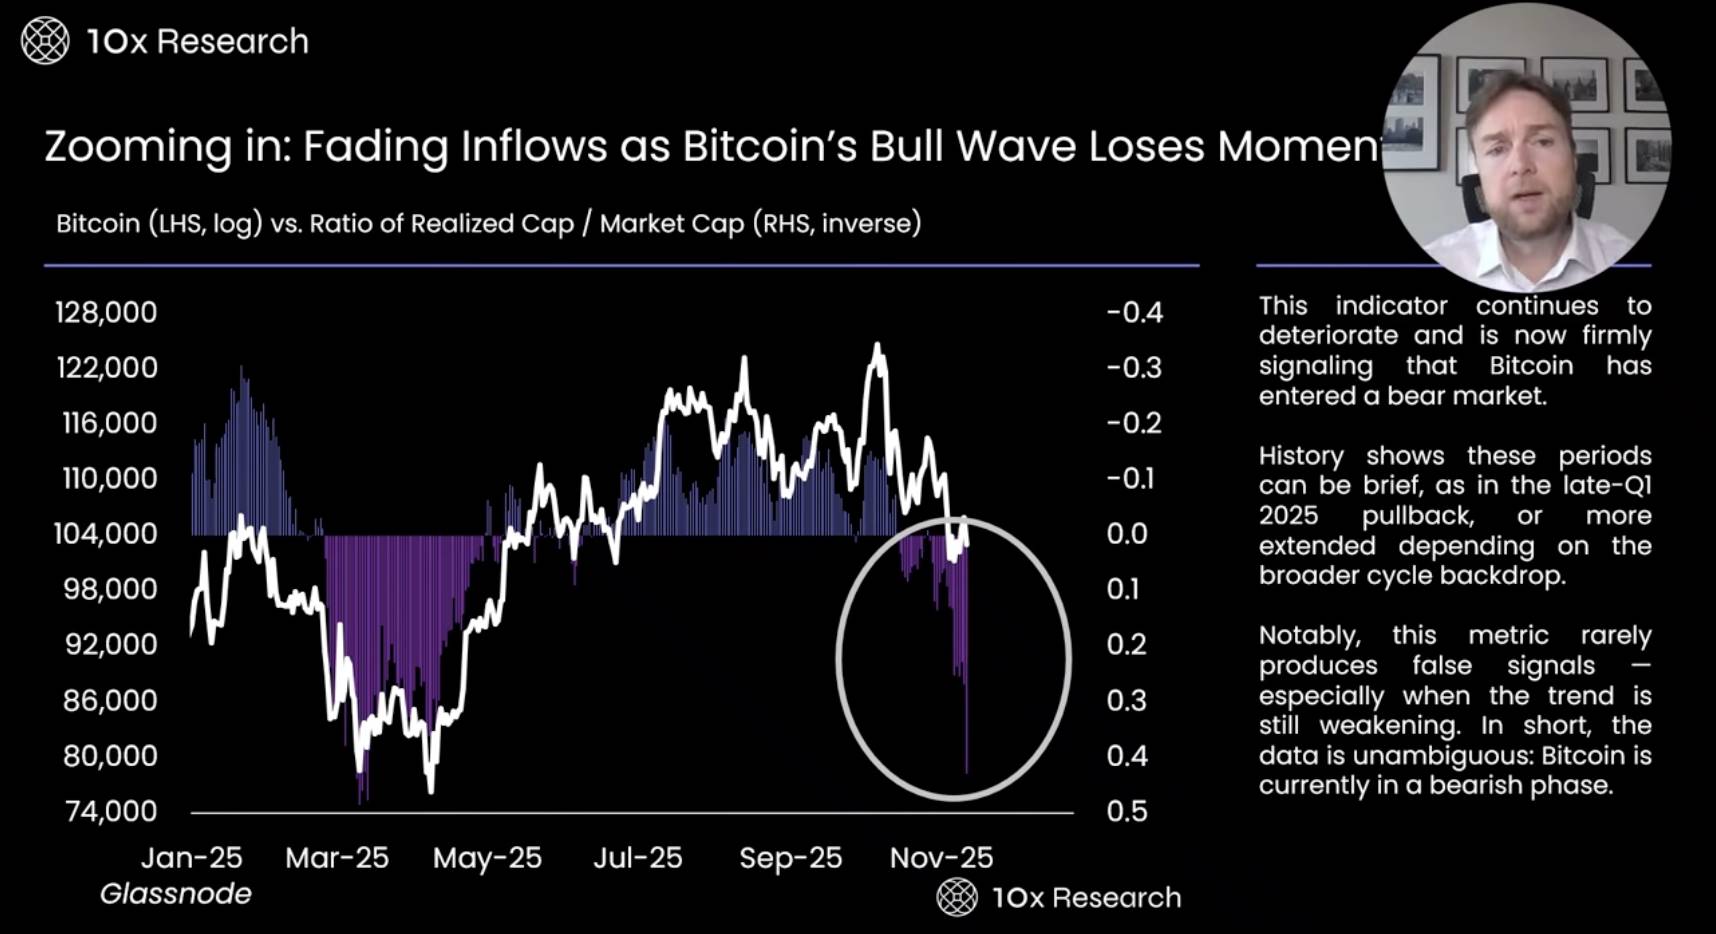
By zooming in further, we can see more clearly that the recent downward trend of this indicator is very similar to the worst period of the market in March this year. Although Bitcoin subsequently experienced a slight rebound, it fell 10% from the post-rebound level. Therefore, it is still difficult to determine whether the market has emerged from its troubles. In fact, whether $100,000 is the lowest point of this correction remains uncertain. Based on the performance of this indicator, the market may fall below $100,000 and decline further, as this indicator typically signals that a deeper correction is occurring.
The current market has experienced several weeks of correction. However, if we look back at the market corrections earlier this year, they were prolonged adjustments lasting 2 to 3 months, rather than the approximately 3-week correction we are currently experiencing.
Short-Term Holder Cost Basis Breaks: Surrender or Start from Here
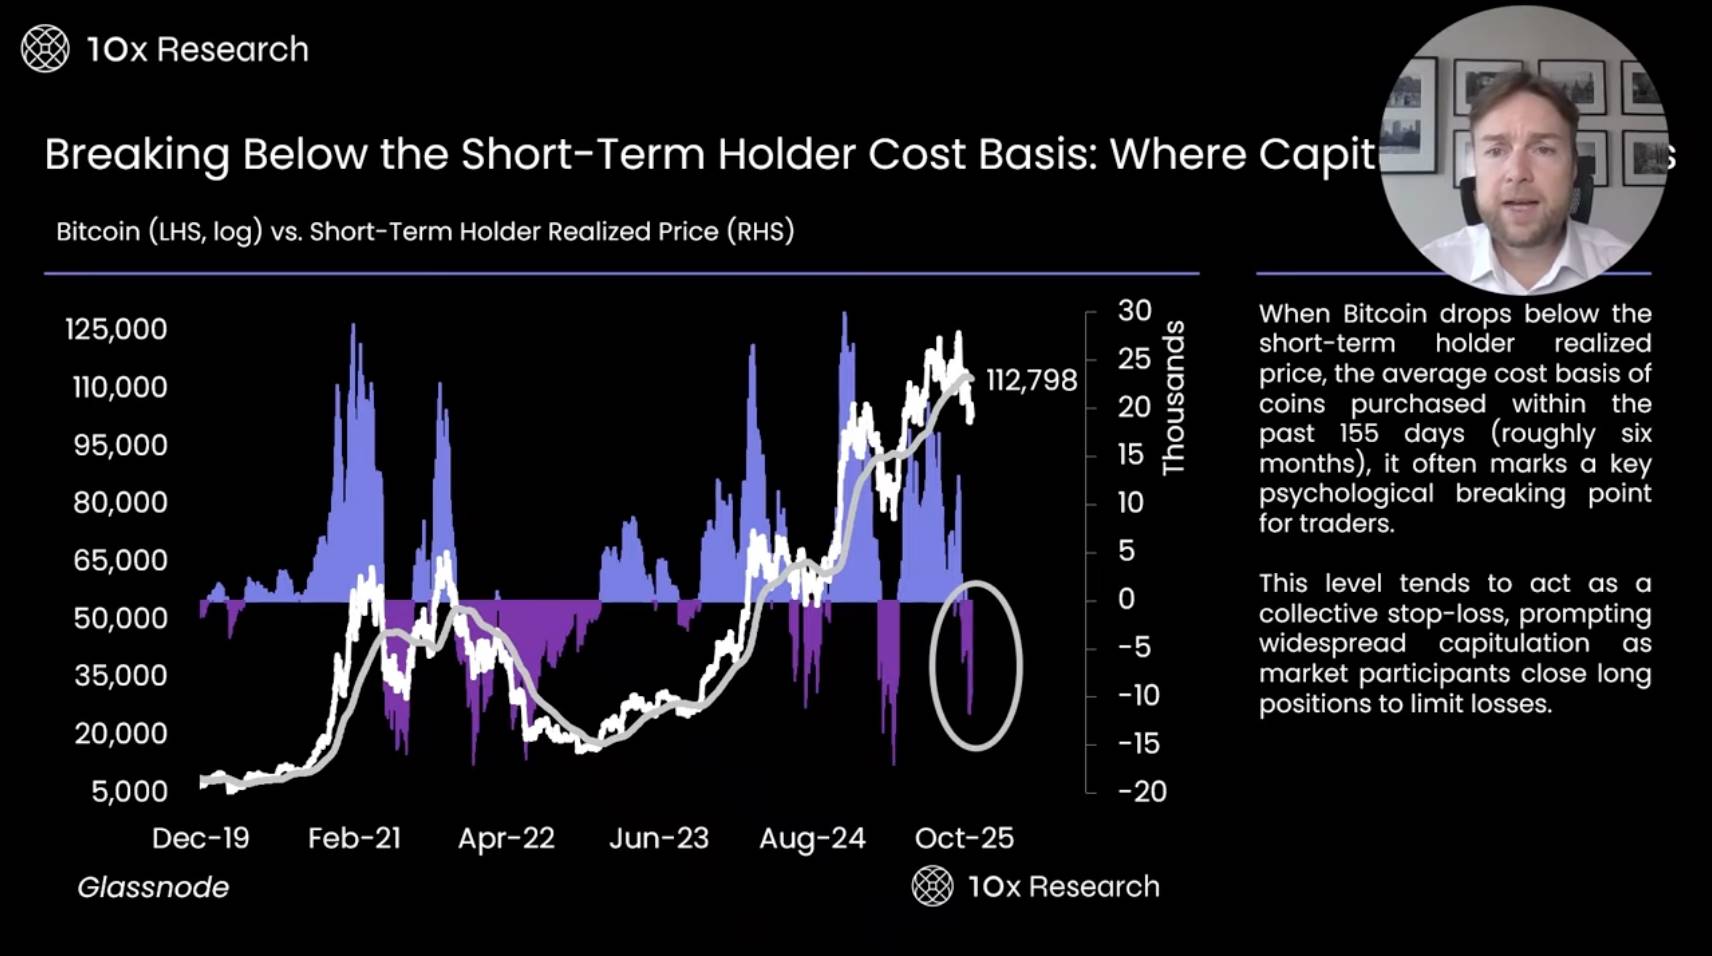
The realized price of short-term holders is a key indicator, currently at $112,798 (at the time of the podcast recording), reflecting the average buying level of short-term holders over the past 155 days. When Bitcoin's price falls below this level, investors typically choose to cut losses, leading to further declines in the market. This is mainly because short-term traders tend to buy in anticipation of price increases, and when the price falls below their buying price, they quickly sell their assets. We can see that when Bitcoin fell below $113,000, the price experienced further declines, triggering a large-scale forced liquidation event in October.
Additionally, on-chain data also indicates that this may be a deeper market correction. The market currently seems to have entered a bear market phase dominated by sell-offs. Sell-offs may take various forms and could last longer. Historical data shows that when short-term holders are in a loss position, Bitcoin's price often declines further. Only when the price breaks above this level (ideally driven by strong catalysts) might the market turn bullish. Otherwise, the market still faces significant downside risks. In this case, protecting capital becomes particularly important. If we want to buy at lower prices, we must sell at higher levels.
Surrender Risks Resurface — Even if Bitcoin Bounces Back
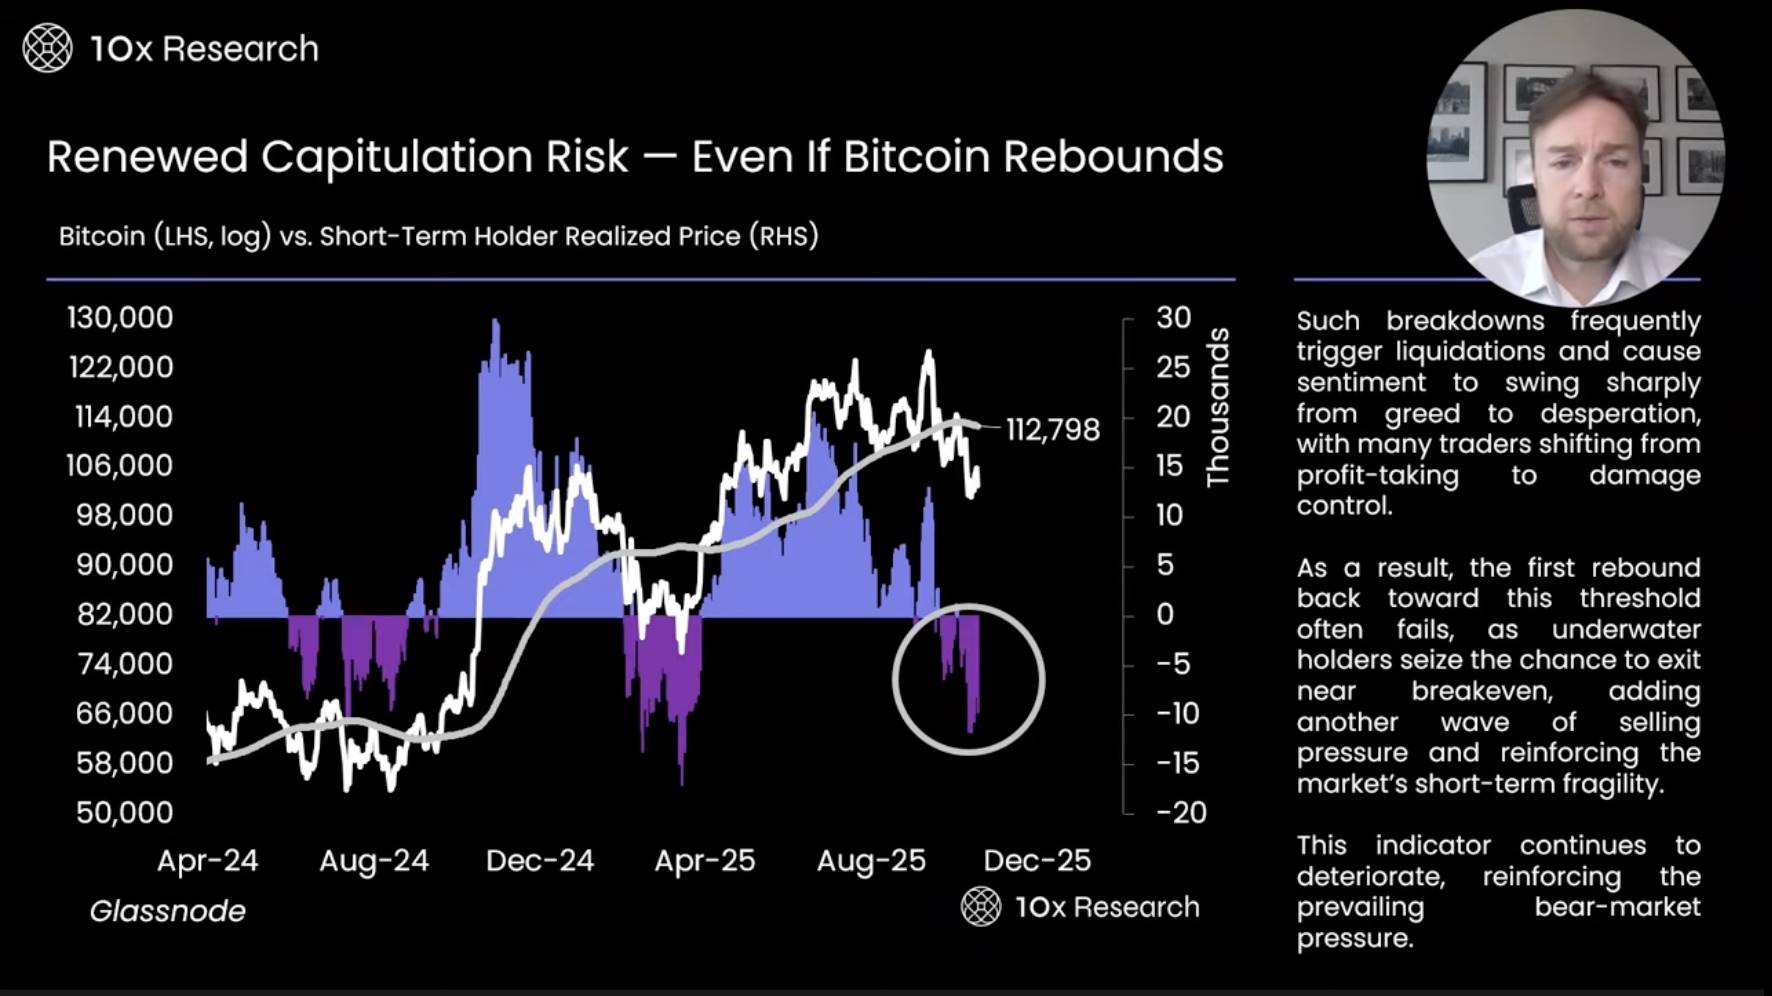
In recent weeks' research reports, we have analyzed Bitcoin's market trends from multiple angles. A closer look reveals that during the correction in the first quarter of this year, related indicators became more negative, indicating that Bitcoin's rebound pattern is closer to a W shape rather than a traditional V shape. A W-shaped rebound means that market prices experience two bottoms and rebounds over a longer period, rather than a quick recovery. Based on this, we predict that Bitcoin may rebound to $110,000 before declining again.
However, from a trading perspective, this prediction may be overly idealistic, as market trends are difficult to judge accurately. We cannot determine whether the price will rebound first and then decline or directly enter a downward trend. Therefore, we believe it is more reasonable to maintain a bearish stance when Bitcoin's price is below $113,000. Unless the price breaks above this level, we are more inclined to focus on downside risks rather than trying to catch potential upward momentum.
Weakening Speculative Momentum May Signal an Upcoming Consolidation Phase
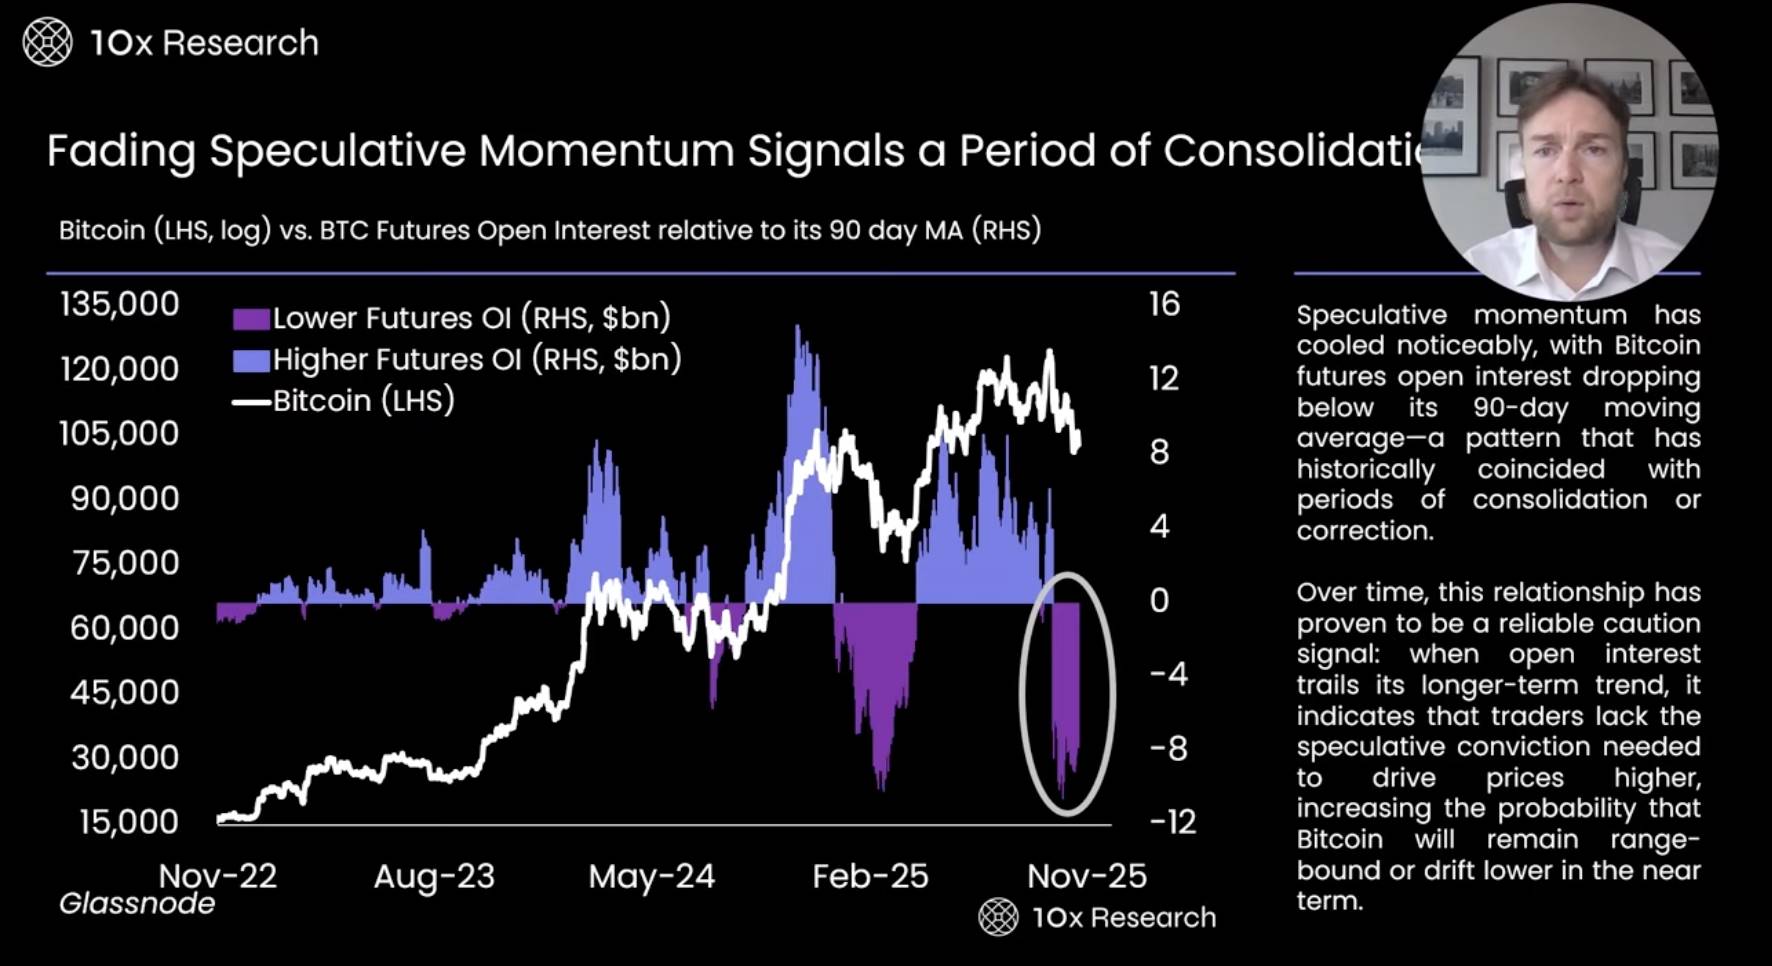
During the market correction on October 10, a large-scale forced liquidation event occurred for Bitcoin. At that time, former U.S. President Trump threatened to impose a 100% tariff on China at the end of the Friday trading session, while the U.S. stock index futures market was about to close, and only the Bitcoin futures market remained open. It was at this moment that the Bitcoin futures market liquidated positions worth up to $20 billion.
This indicates that when futures traders in the market decrease, it becomes difficult for Bitcoin's price to rebound. We may be experiencing a similar situation, as we have also observed in previous market corrections that once futures traders withdraw and close long positions, market rebounds become exceptionally difficult. This is also one of the reasons we maintain a cautious attitude. We closely monitor changes in open interest, futures positions, and funding rates, which currently do not show bullish signals but rather indicate that traders are adopting very cautious risk management strategies.
Long-Term Holders Begin to Take Profits — Possibly Signaling an Upcoming Consolidation Period
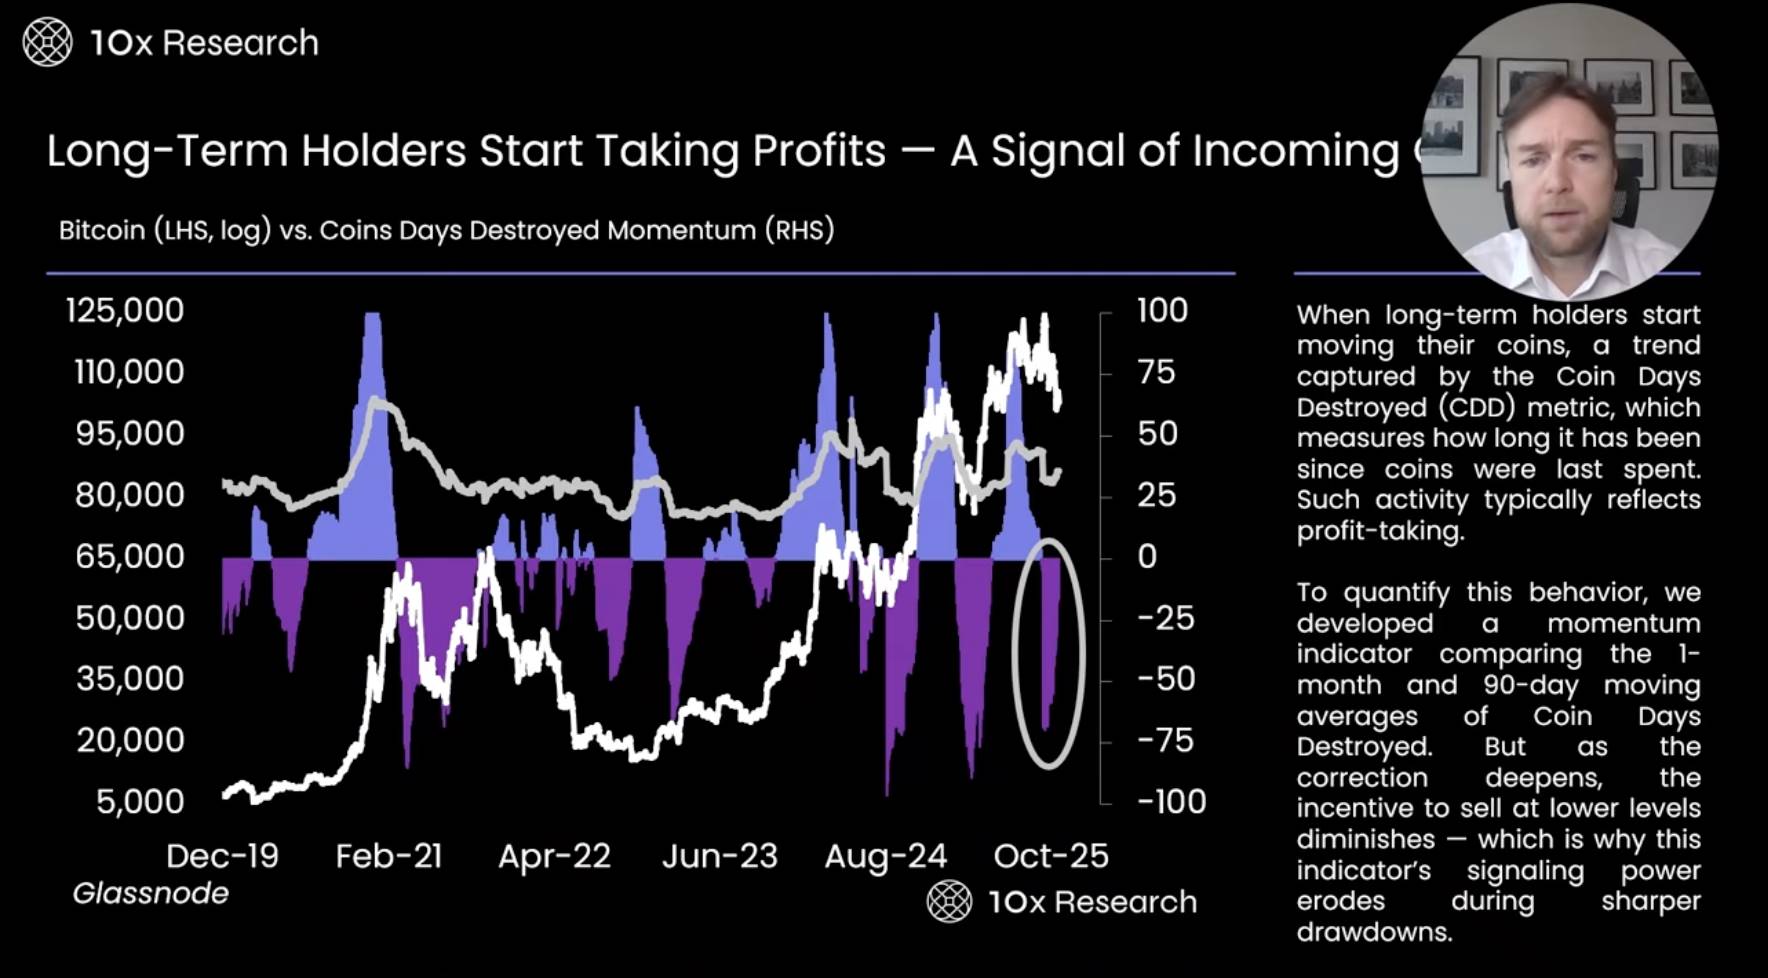
Coin Days Destroyed is an indicator used to track veteran investors who hold Bitcoin for the long term. Its principle is to issue warning signals by monitoring the destroyed coin days (i.e., the cumulative time when long-held Bitcoins are sold). When some long-term holders begin to sell Bitcoin, this indicator signals that the market may face risks.
However, as the duration of the bear market extends, long-term holders typically choose to continue holding rather than selling at low prices. This weakens the predictive ability of this indicator during bear markets. Nevertheless, it can still provide some warning information. I believe this is also one of the important reasons for our cautious stance.
Low Valuation with No Momentum: MVRV Indicator Suggests Consolidation May Continue
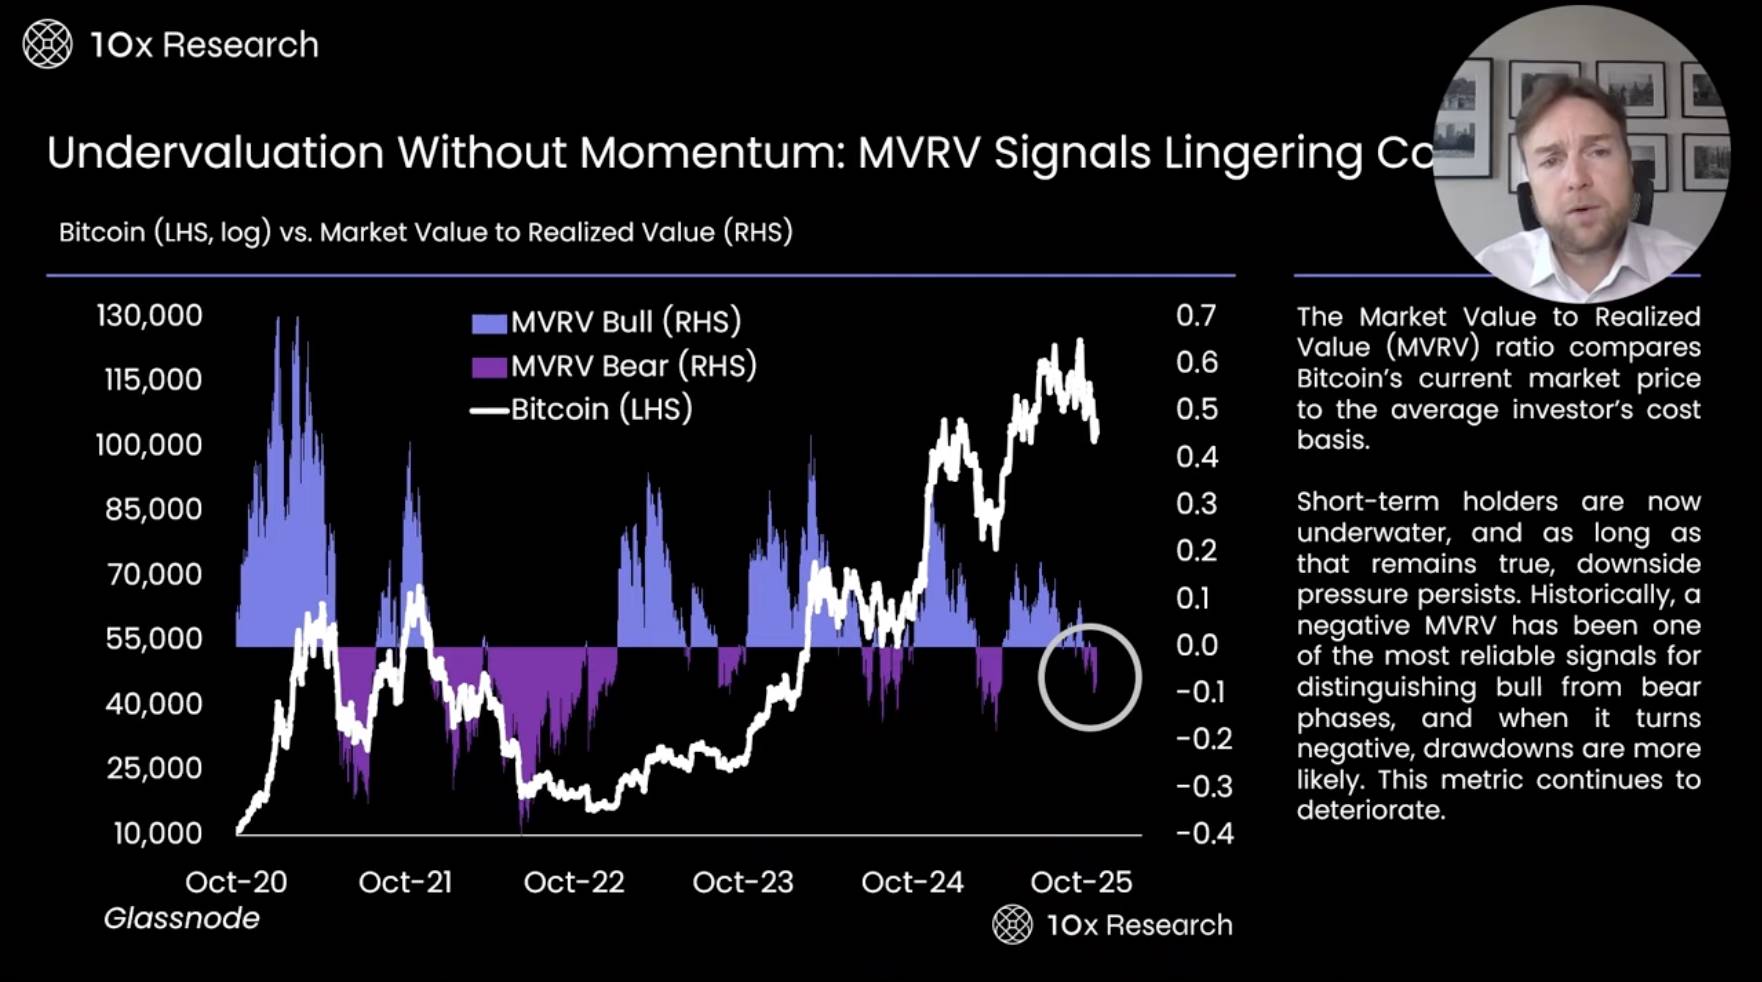
One of the most critical off-chain indicators is the Market Value to Realized Value (MVRV), which compares Bitcoin's current price to the average cost basis of investors. Currently, this indicator has turned negative, primarily reflecting the situation of short-term holders who bought Bitcoin over the past 155 days, rather than the overall market performance.
This data indicates that many investors are currently in a loss position. When investors are in a loss position, the market often experiences a slight correction, and adjustments may even deepen. This was particularly evident during the bear market from late 2021 to 2022. Additionally, it is worth noting that the current bull market's momentum is weak. Compared to the bull market wave at the end of October 2020, the current market momentum and investor excitement are significantly lacking. This low-momentum performance makes the market more susceptible to rapid reversals, especially when investors realize they are in a loss position. For this reason, we are always concerned that the current bull market may lose momentum prematurely.
The True Market Mean Price Indicates Erosion of Investor Profits

The True Market Mean Price is an important market indicator that reflects the overall buying cost of Bitcoin in the secondary market. It can be seen as the average buying price of active investors, used to analyze the cost pressure and behavioral tendencies of market participants. When investors face losses, they typically choose to sell or liquidate assets, a phenomenon that has frequently occurred at different stages of the market.
It is noteworthy that since this summer, market activity has significantly declined, and the overall trend has gradually weakened. This has led the market into a state of "hovering at a critical point." Looking back at last year's Trump election period, a wave of large-scale market activity was triggered due to policy uncertainty, while after the tariff issue was resolved in April this year, the second wave of market activity significantly weakened. Therefore, the speed of the market's momentum decline is faster than expected, and investor confidence has also been somewhat affected.
Three Small Bull Markets — And the Signs of Profit Exhaustion They Left Behind
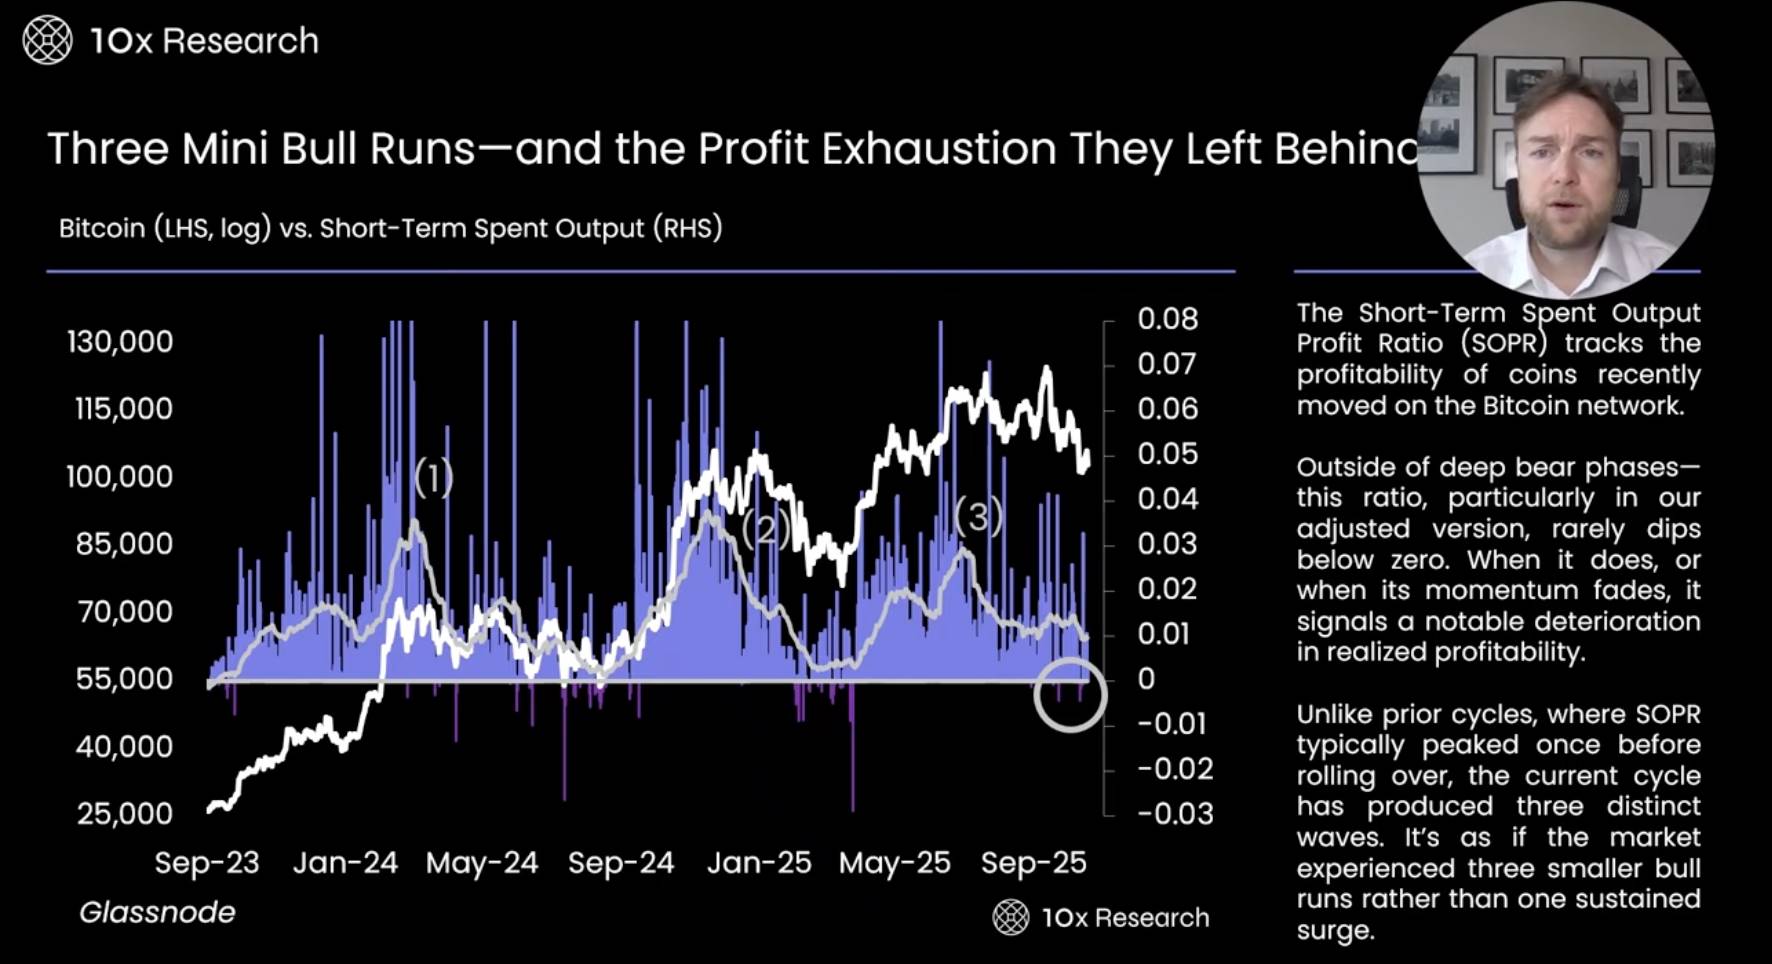
The Short Term Spend Output indicator is an important tool used to track whether recently circulating coins on the Bitcoin network are in a profit state. Over the past two years, Bitcoin has experienced two to three brief bull markets, but the duration of these bull markets has been short, and market momentum has quickly weakened. As the market enters a sluggish state, we can observe waves of price rebounds, but the rebound magnitude gradually diminishes, indicating that the market's recovery strength is declining.
Historically, when the Short Term Spend Output indicator approaches zero, it usually means the market is nearing a bottom, making it a good time to buy Bitcoin. However, this indicator has not yet reached zero, indicating that the market's short-term profitability has not been fully exhausted, so it may not be the best time to buy. Only when profitability approaches zero will the market bottom signal become more apparent. At the current stage, maintaining a wait-and-see approach or waiting for clearer market signals may be a more prudent strategy.
Evidence of Continued Surrender and Weak Momentum
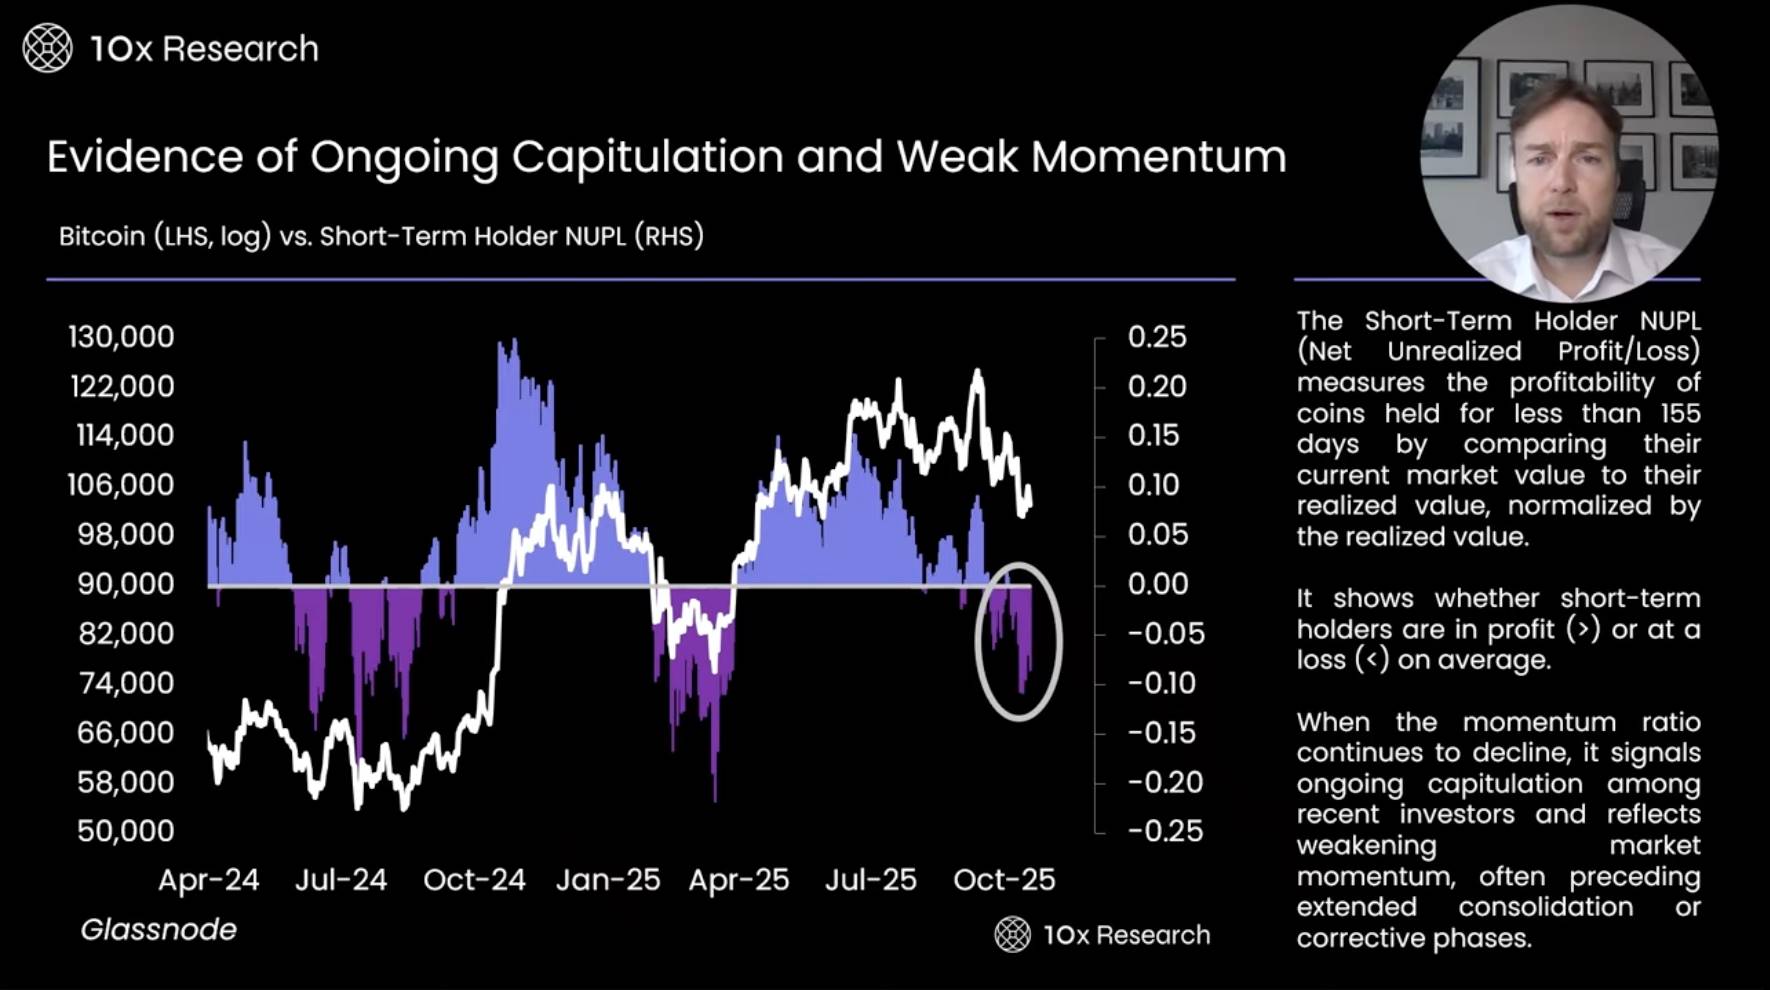
The Short Term Holder Net Unrealized Profit is an important indicator used to measure whether investors holding Bitcoin for less than 155 days are in a profit state. This indicator reflects the investment performance of short-term holders by comparing the current market value of the coins to their realized value and normalizing the data. Current data shows that market momentum is weakening, and there are more signs of "surrender-style" selling among investors, which aligns with the current sluggish state of the market.
Comparing the market adjustments from last summer to the first quarter of this year, it can be observed that the current adjustment may last longer and the decline may be greater. The current market price still has a significant gap compared to historical highs, making it difficult for Bitcoin to achieve sustained rebounds in the short term. The market may fluctuate within a narrow range of $110,000 to $100,000. In such an environment, investors may consider generating profits by selling call options and deep out-of-the-money put options. Meanwhile, the next potential catalyst that may impact the market is expected to emerge after the Federal Open Market Committee (FOMC) meeting on December 10, at which point investors can closely monitor market dynamics.
The True Market Mean Price Reveals the Erosion of Profits
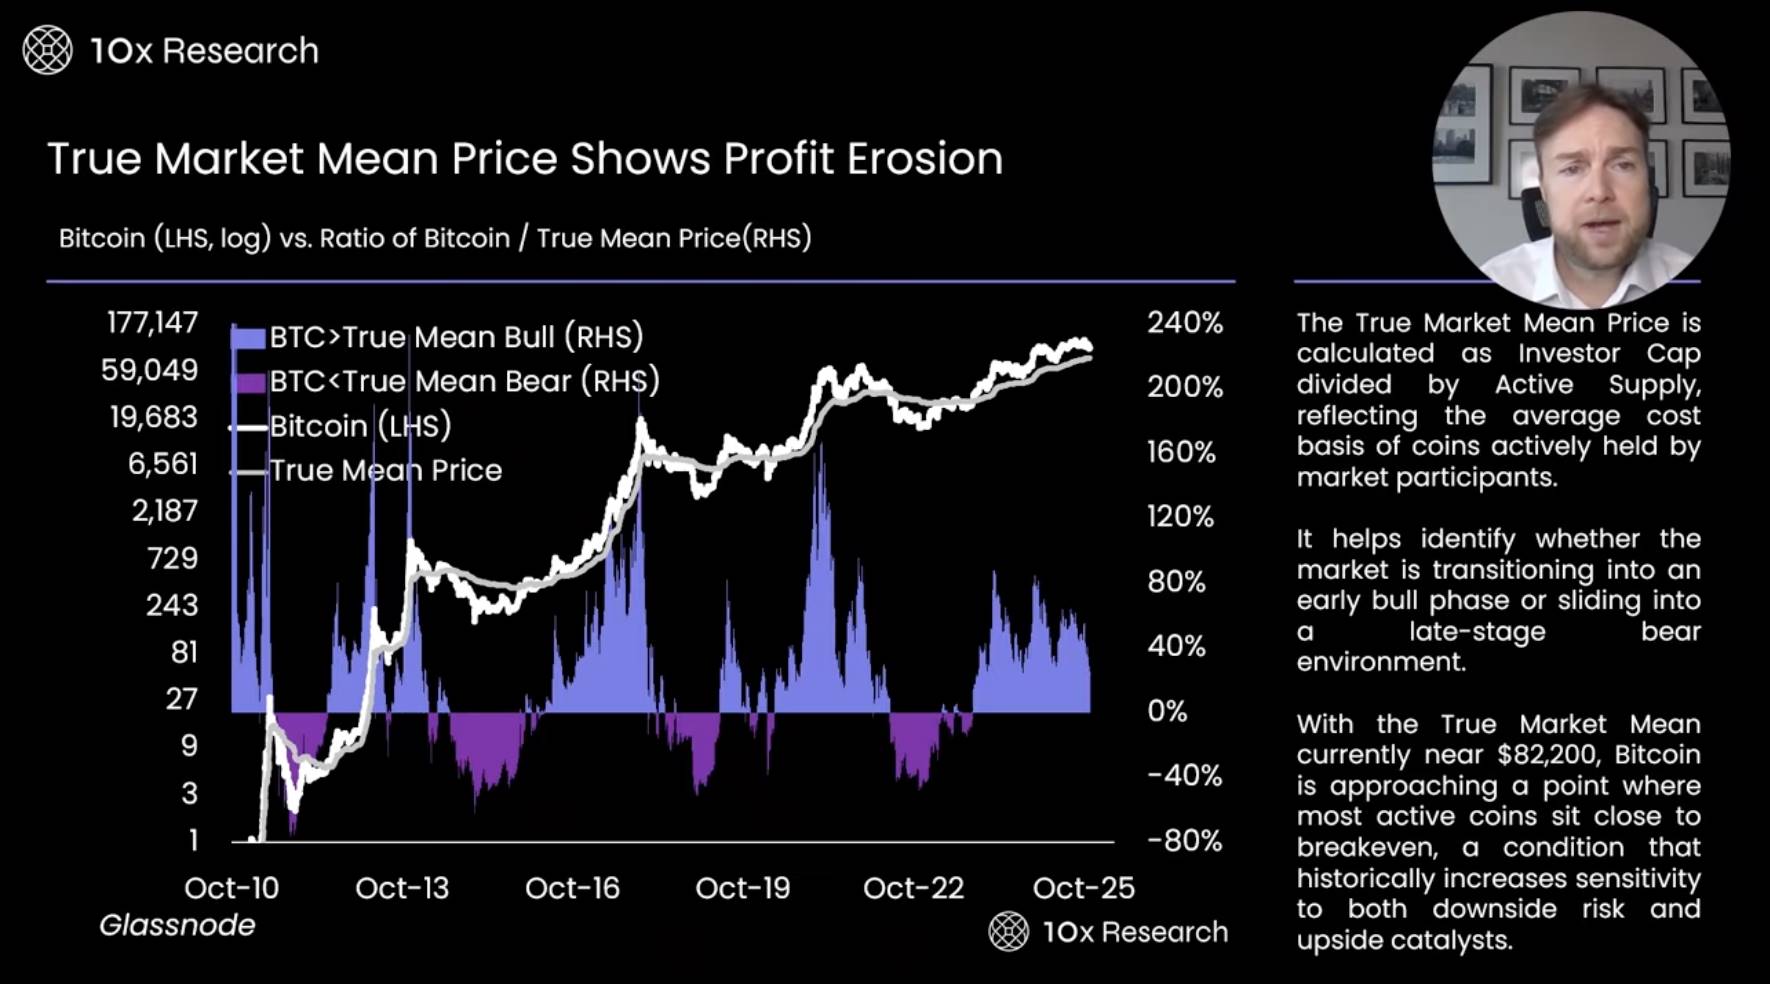
On-chain indicators provide us with a more cautious market perspective. For example, the ratio of Bitcoin to the True Mean Price is calculated by dividing the Investor Cap by the active supply, measuring the average cost of coins held by market participants. Current data shows that the market momentum of short-term holders is gradually weakening, with most short-term investors facing losses.
Overall, the average profit level of the Bitcoin network is only 25%, a figure close to MicroStrategy's Bitcoin purchase cost. Historically, when Bitcoin's price falls below the True Mean Price, the market typically enters a deep bear market phase. Currently, the True Mean Price is around $82,000, which is an important dividing line marking the end of the Bitcoin bull market and the beginning of the bear market. If the price falls below this level, the market may first test the key support level of $93,000. It is worth noting that during Trump's election period, Bitcoin quickly rose from $68,000 to $93,000, with low trading volume in this range, leading to a potential "air pocket" phenomenon, where prices fluctuate wildly within this range and lack stable support. If this indicator is reached, it could trigger significant market volatility.
Currently, we are increasingly concerned that Bitcoin's price may fall below $100,000. Based on the analysis of trend models and on-chain indicators, as long as Bitcoin's price remains below $113,000, we will continue to maintain a bearish market outlook.
Falling to the True Market Mean Price Will Form Support — The Bear Market May Unfold Below This Level

Data further shows that the average profit of Bitcoin network investors has sharply declined from 75% to 25%. This change primarily stems from the active trading at the market peak over the past few months. Early investors (OGs) and veteran investors gradually sold Bitcoin to new investors, leading to a significant increase in the market's average cost or True Mean Price. At the beginning of the year, the True Mean Price was around $50,000 to $60,000, but with the rapid increase in trading volume, this average has risen to higher levels.
A potential risk currently facing the market is that a large number of new investors purchased Bitcoin in the $100,000 to $126,000 range, making the market environment more fragile. These investors may be more likely to choose to sell when prices decline. For example, when Bitcoin's price drops to $100,000, those who bought at $120,000 may quickly exit due to loss pressure, and this selling behavior could further exacerbate market instability. Additionally, the average profit level of long-term holders is only 25%, which is not high compared to the total market investment, indicating a general lack of confidence in the market.
免责声明:本文章仅代表作者个人观点,不代表本平台的立场和观点。本文章仅供信息分享,不构成对任何人的任何投资建议。用户与作者之间的任何争议,与本平台无关。如网页中刊载的文章或图片涉及侵权,请提供相关的权利证明和身份证明发送邮件到support@aicoin.com,本平台相关工作人员将会进行核查。


