A global wave of risk is sweeping through assets, with U.S. stocks experiencing a sharp decline.
Written by: ChandlerZ, Foresight News
As expectations for a Federal Reserve interest rate cut sharply cool and uncertainties in economic data emerge, global risk assets are facing a new wave of sell-offs. The U.S. stock market's tech sector and the cryptocurrency market are both under pressure, with the Nasdaq index plummeting over 2% in a single day. Starting from the early hours of November 13, Bitcoin has dropped from around $102,000 alongside U.S. stocks, hitting a low of $98,000. ETH fell from $3,400 to a low of $3,150, currently rebounding to around $3,250. SOL dropped to $141. Affected by the overall market, altcoins also experienced widespread declines.
According to SoSoValue data, the PayFi sector fell 3.74% in 24 hours, but Telcoin (TEL) continued to rise, increasing by 13.09%; the CeFi sector dropped 3.75%, with Binance Coin (BNB) down 3.58%; the Layer1 sector fell 4.22%, with Solana (SOL) down 5.76%; the Layer2 sector decreased by 4.37%, where Starknet (STRK) rose against the trend by 8.08%; the DeFi sector fell 4.47%, with Jupiter (JUP) down 8.27%; the Meme sector dropped 4.70%, but Mog Coin (MOG) surged 6.16% during the session.
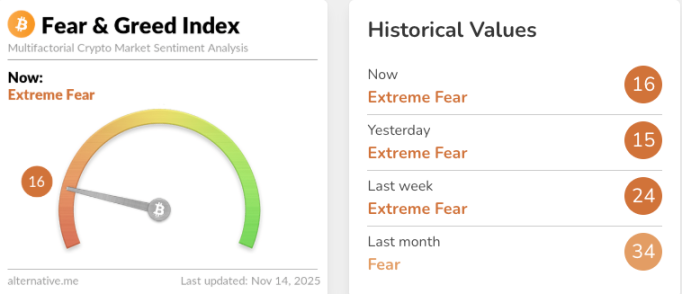
According to Coinglass data, $755 million in liquidations occurred across the network in the past 24 hours, with long positions liquidated at $601 million and short positions at $154 million. Among them, Bitcoin saw $273 million in liquidations, while Ethereum had $229 million. According to Alternative.me data, the cryptocurrency fear and greed index rose to 16 today (up from 15 yesterday, indicating "extreme fear"), suggesting that the market remains in a state of "extreme fear."
Federal Reserve Officials Turn Hawkish
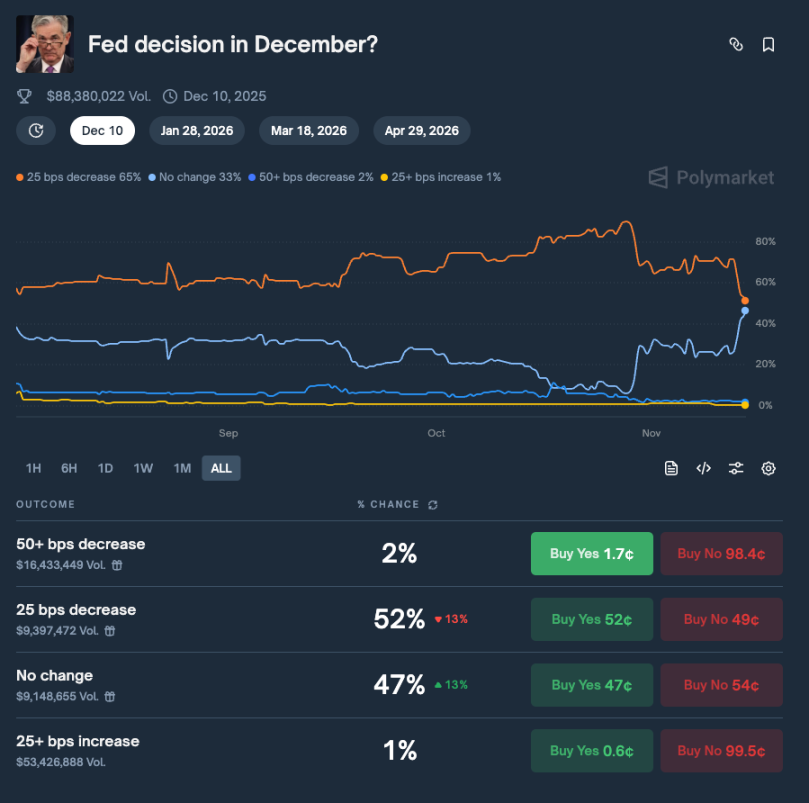
Federal Reserve officials have collectively turned hawkish, with the core driving force behind market turbulence stemming from a reassessment of the interest rate path. Over the past week, Federal Reserve officials have made cautious statements, rapidly cooling market expectations for a rate cut in December. Data from Polymarket shows that the market is betting on a 52% probability of a 25 basis point rate cut by the Federal Reserve in December, while the probability of "no cut, no hike" has risen to 47%. Currently, the trading volume in this prediction market exceeds $88 million.
Interest rate futures and related measurement tools have revised the probability of a rate cut down from previously much higher than 50%, directly raising the risk-free rate and compressing the valuation premium of high-risk assets, triggering synchronized selling pressure on yield-sensitive assets. Sectors dominated by tech stocks, such as the Nasdaq, experienced significant declines on the same trading day, leading to a contraction in risk appetite, with risk assets, including cryptocurrencies, under pressure.
For the crypto market, macro signals are merely igniting the fuse. Since last year, institutional allocations, spot ETF inflows, and corporate-level crypto asset allocations provided price support in the first half of the year, but when the interest rate window closes and sentiment turns defensive, these external pillars can withdraw faster than retail liquidity.
As of November 13, according to SoSoValue data, the total net outflow from Bitcoin spot ETFs reached $613 million. The Bitcoin spot ETF with the highest single-day net outflow yesterday was Fidelity ETF FBTC, with a net outflow of $119.9 million for the day. Currently, FBTC has a historical total net inflow of $11.92 billion.

With poor macro market sentiment, how will crypto assets perform going forward? Analysis firms and some experts have shared their insights.
McKenna: Prices may face downward pressure for some time
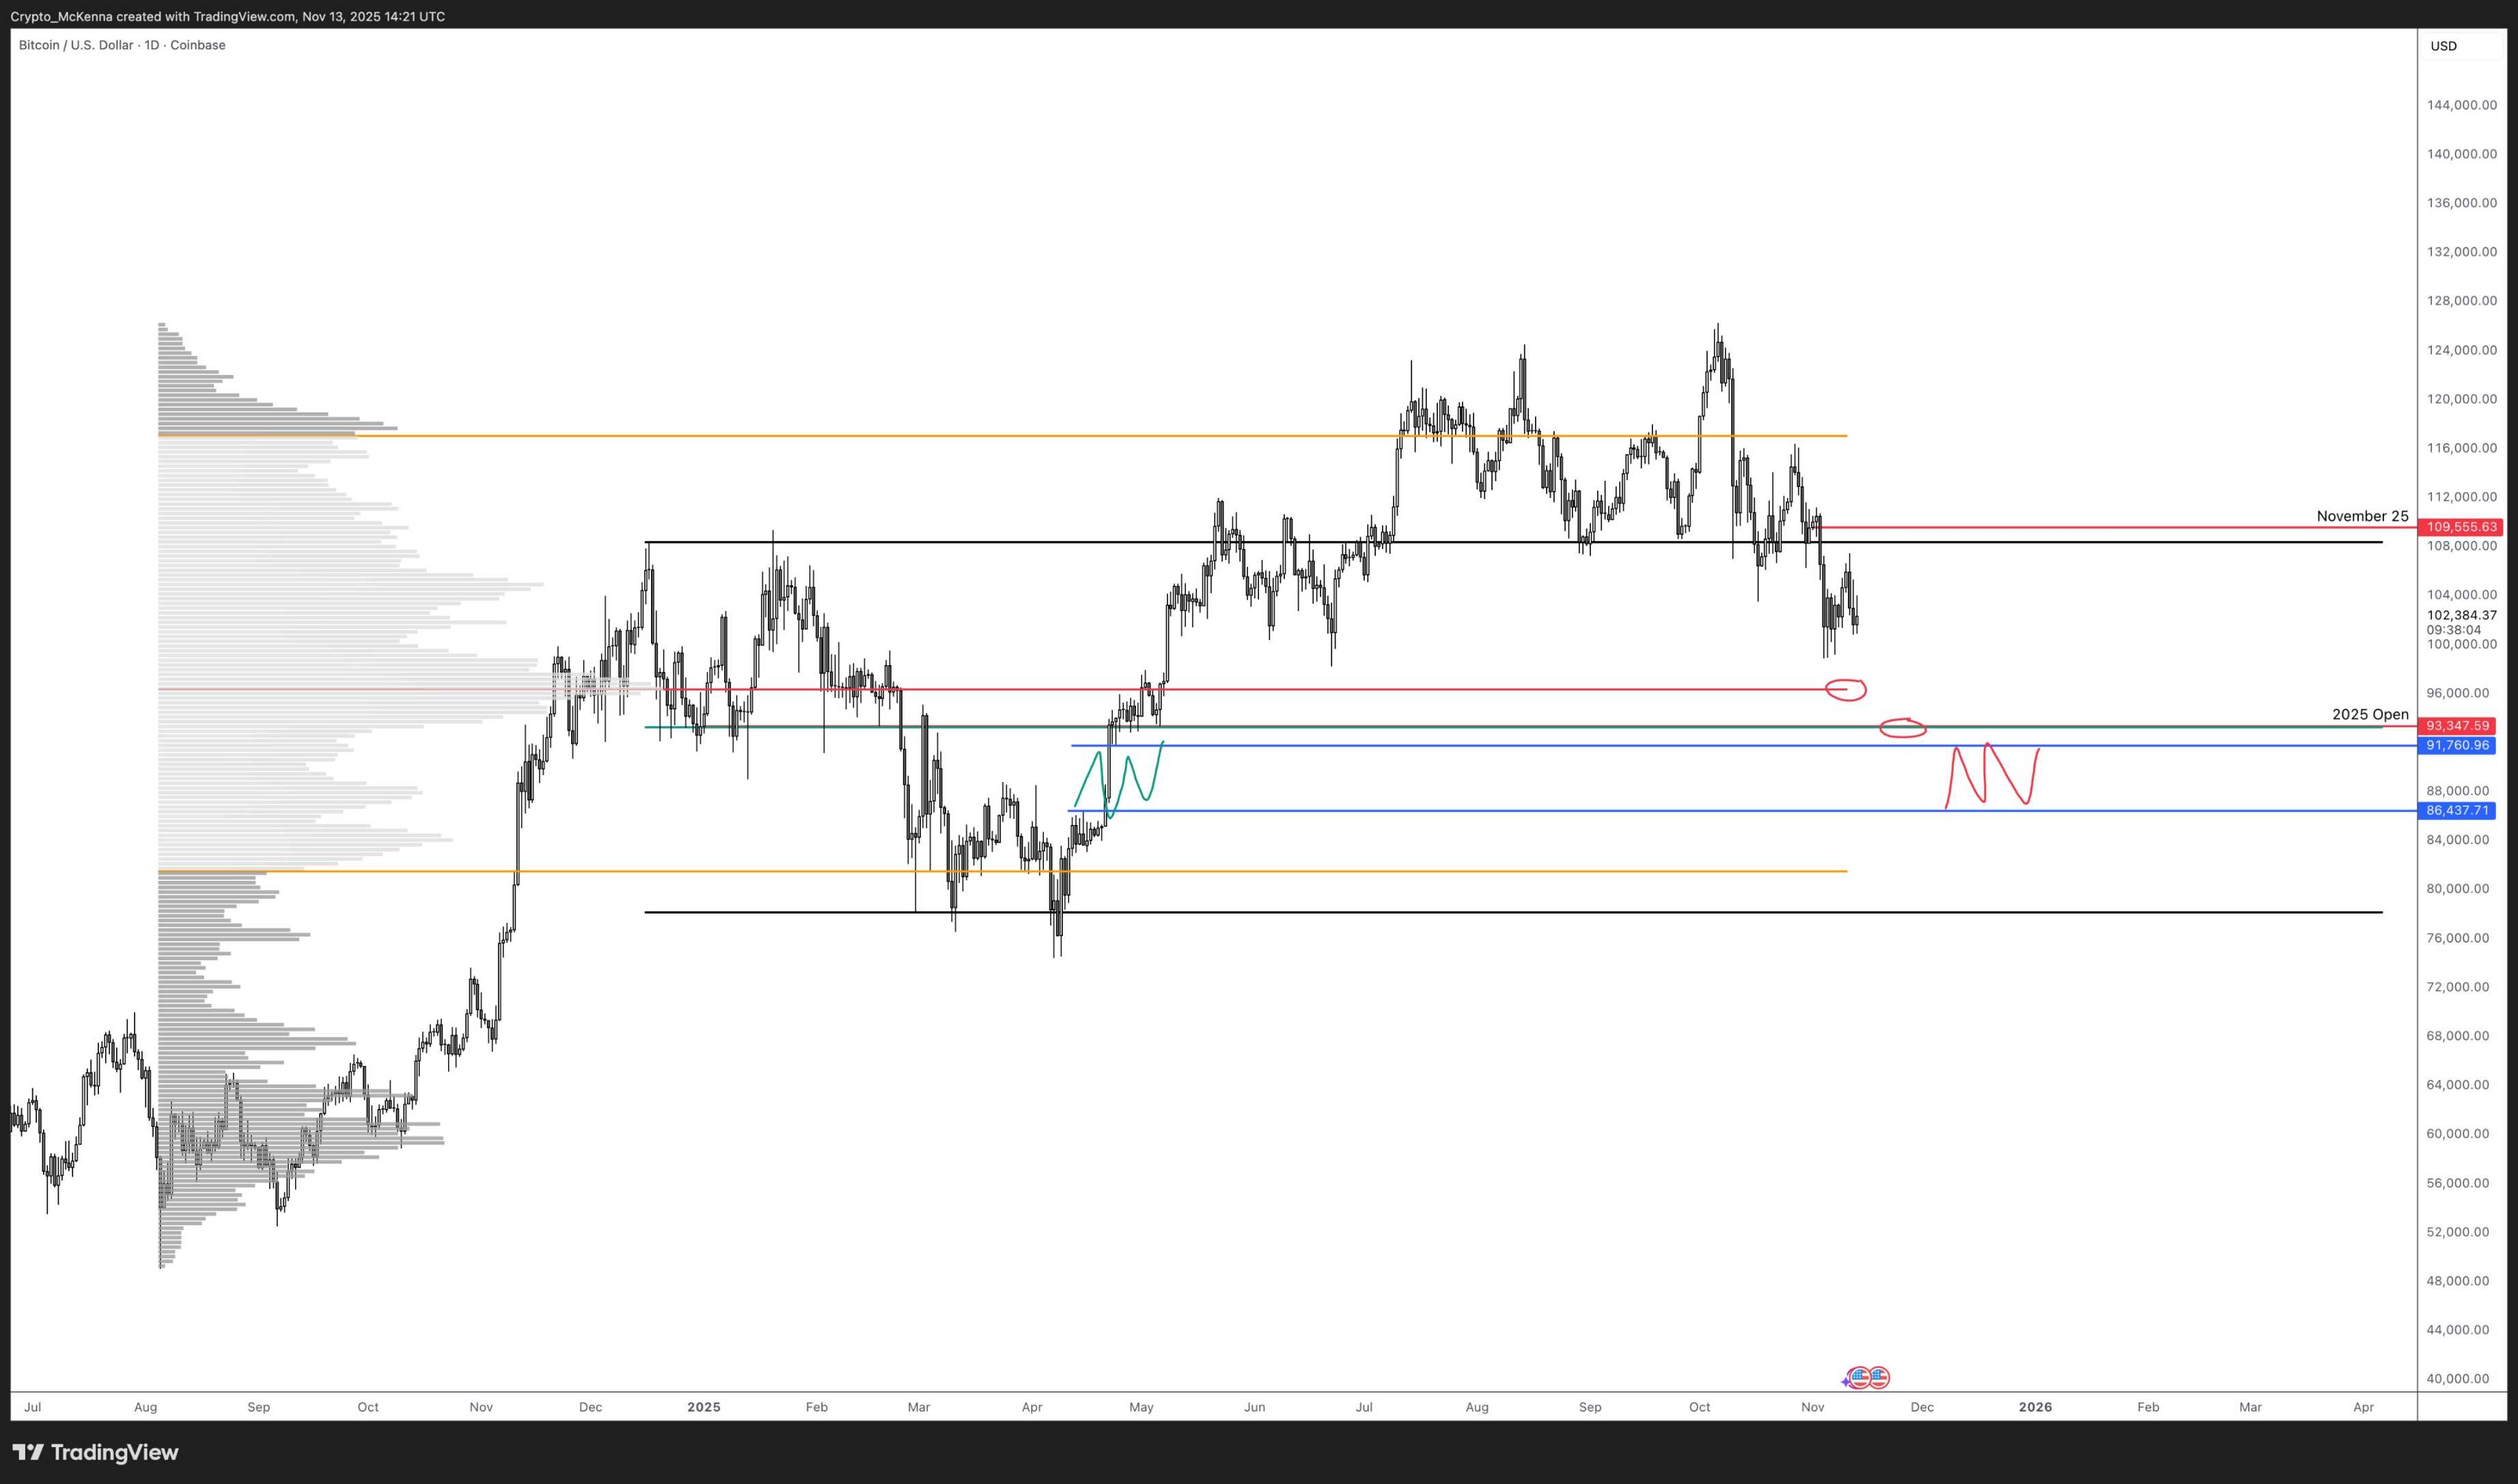
McKenna, a partner at Arete Capital, stated that assuming prices fall below the 50-day moving average for one week, prices have broken through the range high of $108,400. The current important support level (PoC) is at $96,200, with the annual opening price and mid-range at $93,300, and the worst-case low between $91,000 and $86,000. If a brief panic sell-off occurs, prices could correct by about 26%, while filling the low point area could lead to a traditional correction of about 31%. Although the final price cannot be determined, these support levels are key positions for buying BTC. It is expected that this year will not reach a historical high, but it is believed that BTC trading will exceed $150,000 in the second half of 2026, and BTC will surpass $200,000 by the end of President Trump's term. Institutional acceptance of BTC will not stop, and BTC ETFs will continue to accumulate, with new capital inflows expected in 2026.
Wintermute: BTC trading trends are more bearish than stock indices, and the upward narrative premium no longer exists
Wintermute's latest report indicates that the correlation between Bitcoin and the Nasdaq index remains high at 0.8, but Bitcoin's trading trends are more bearish than stock indices, with a much greater reaction to market pessimism than optimism. On trading days when the stock market declines, BTC's drop is generally larger than that of the stock indices, while on days when the stock market rises, Bitcoin's gains are smaller. This pattern was last seen during the bear market of 2022. Wintermute states that the potential factors leading to this phenomenon are mainly two:
For most of 2025, funds that typically flow into the cryptocurrency sector (including new token issuances, infrastructure upgrades, and retail participation) have shifted to the stock market. Large-cap tech companies have become the focus for institutions and retail investors seeking high beta/high growth. When global risk sentiment shifts, Bitcoin remains correlated, but when optimism returns, it fails to benefit proportionally. It acts more like a "high beta tail" of macro risk rather than an independent narrative; the downward beta effect still exists, but the upward narrative premium is no longer present.
Currently, the liquidity situation in cryptocurrencies is different from previous risk cycles. The issuance of stablecoins has stabilized, ETF fund inflows have slowed, and the market depth of trading platforms has not yet returned to levels seen in early 2024. This fragility amplifies negative reactions during stock market corrections. The result is that Bitcoin's participation in declines remains higher than in rises, exacerbating this performance deviation.
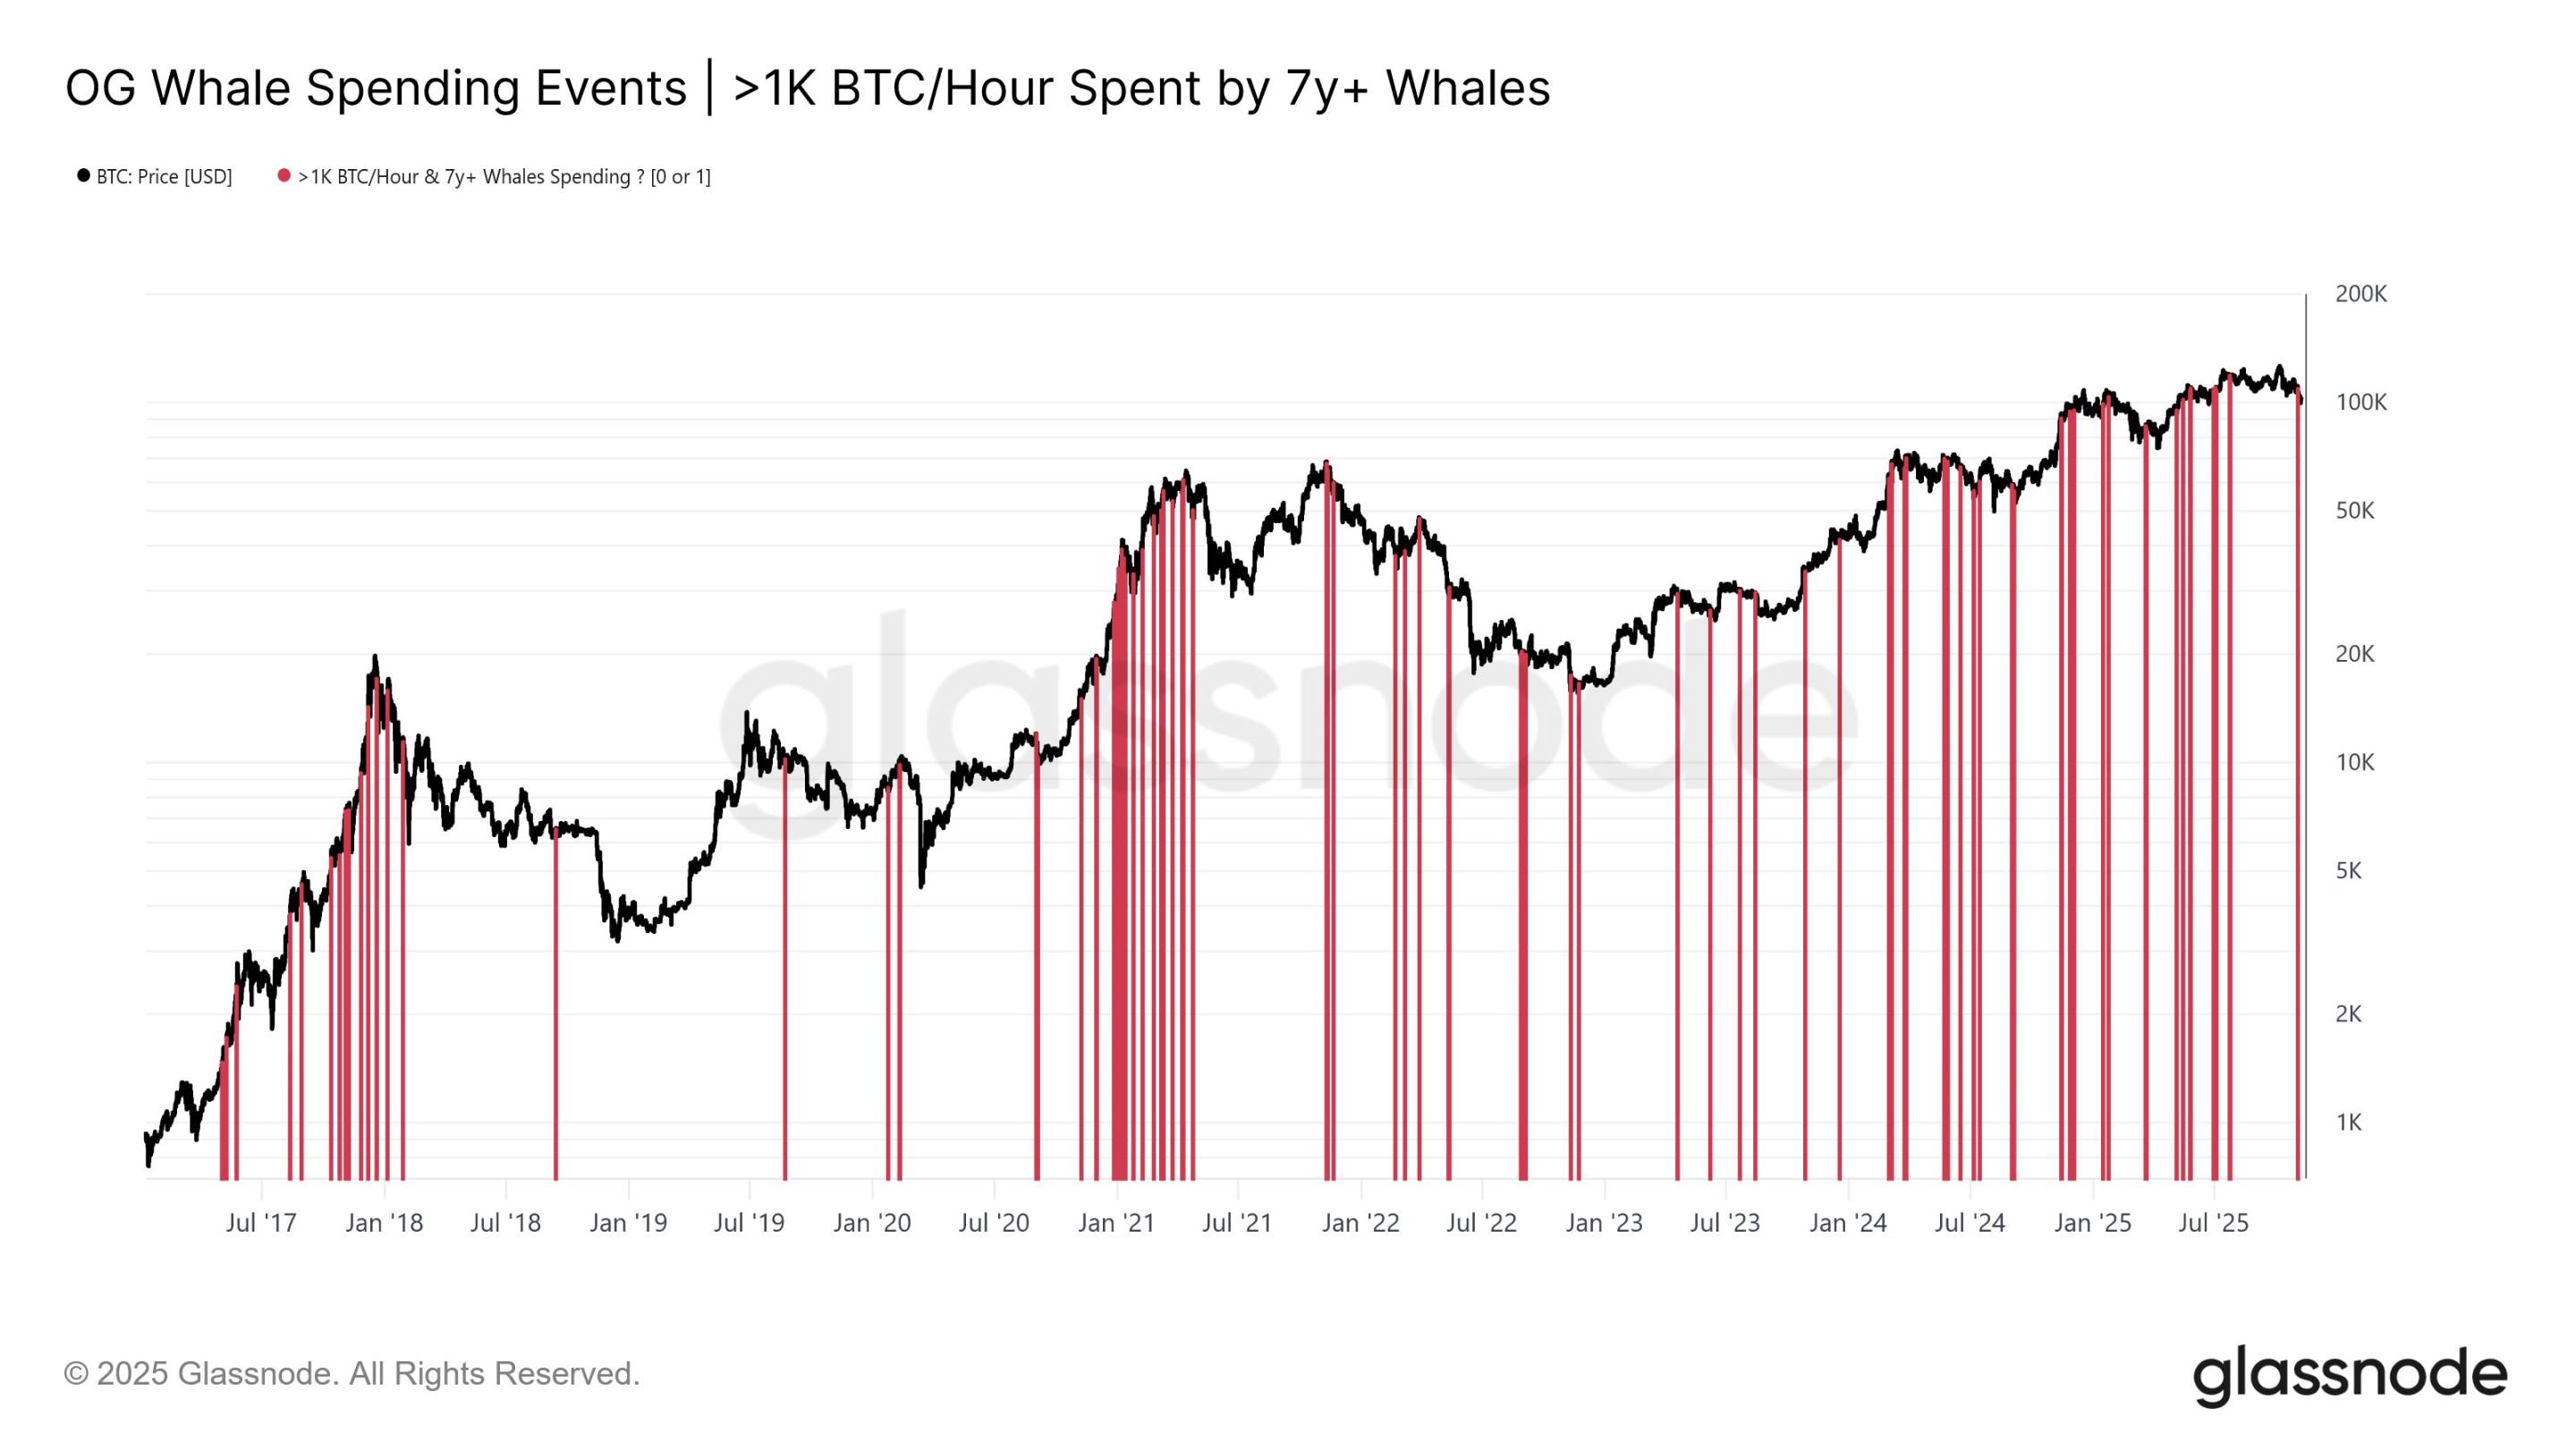
Glassnode: Long-term holders accelerate Bitcoin distribution, supply rapidly declines
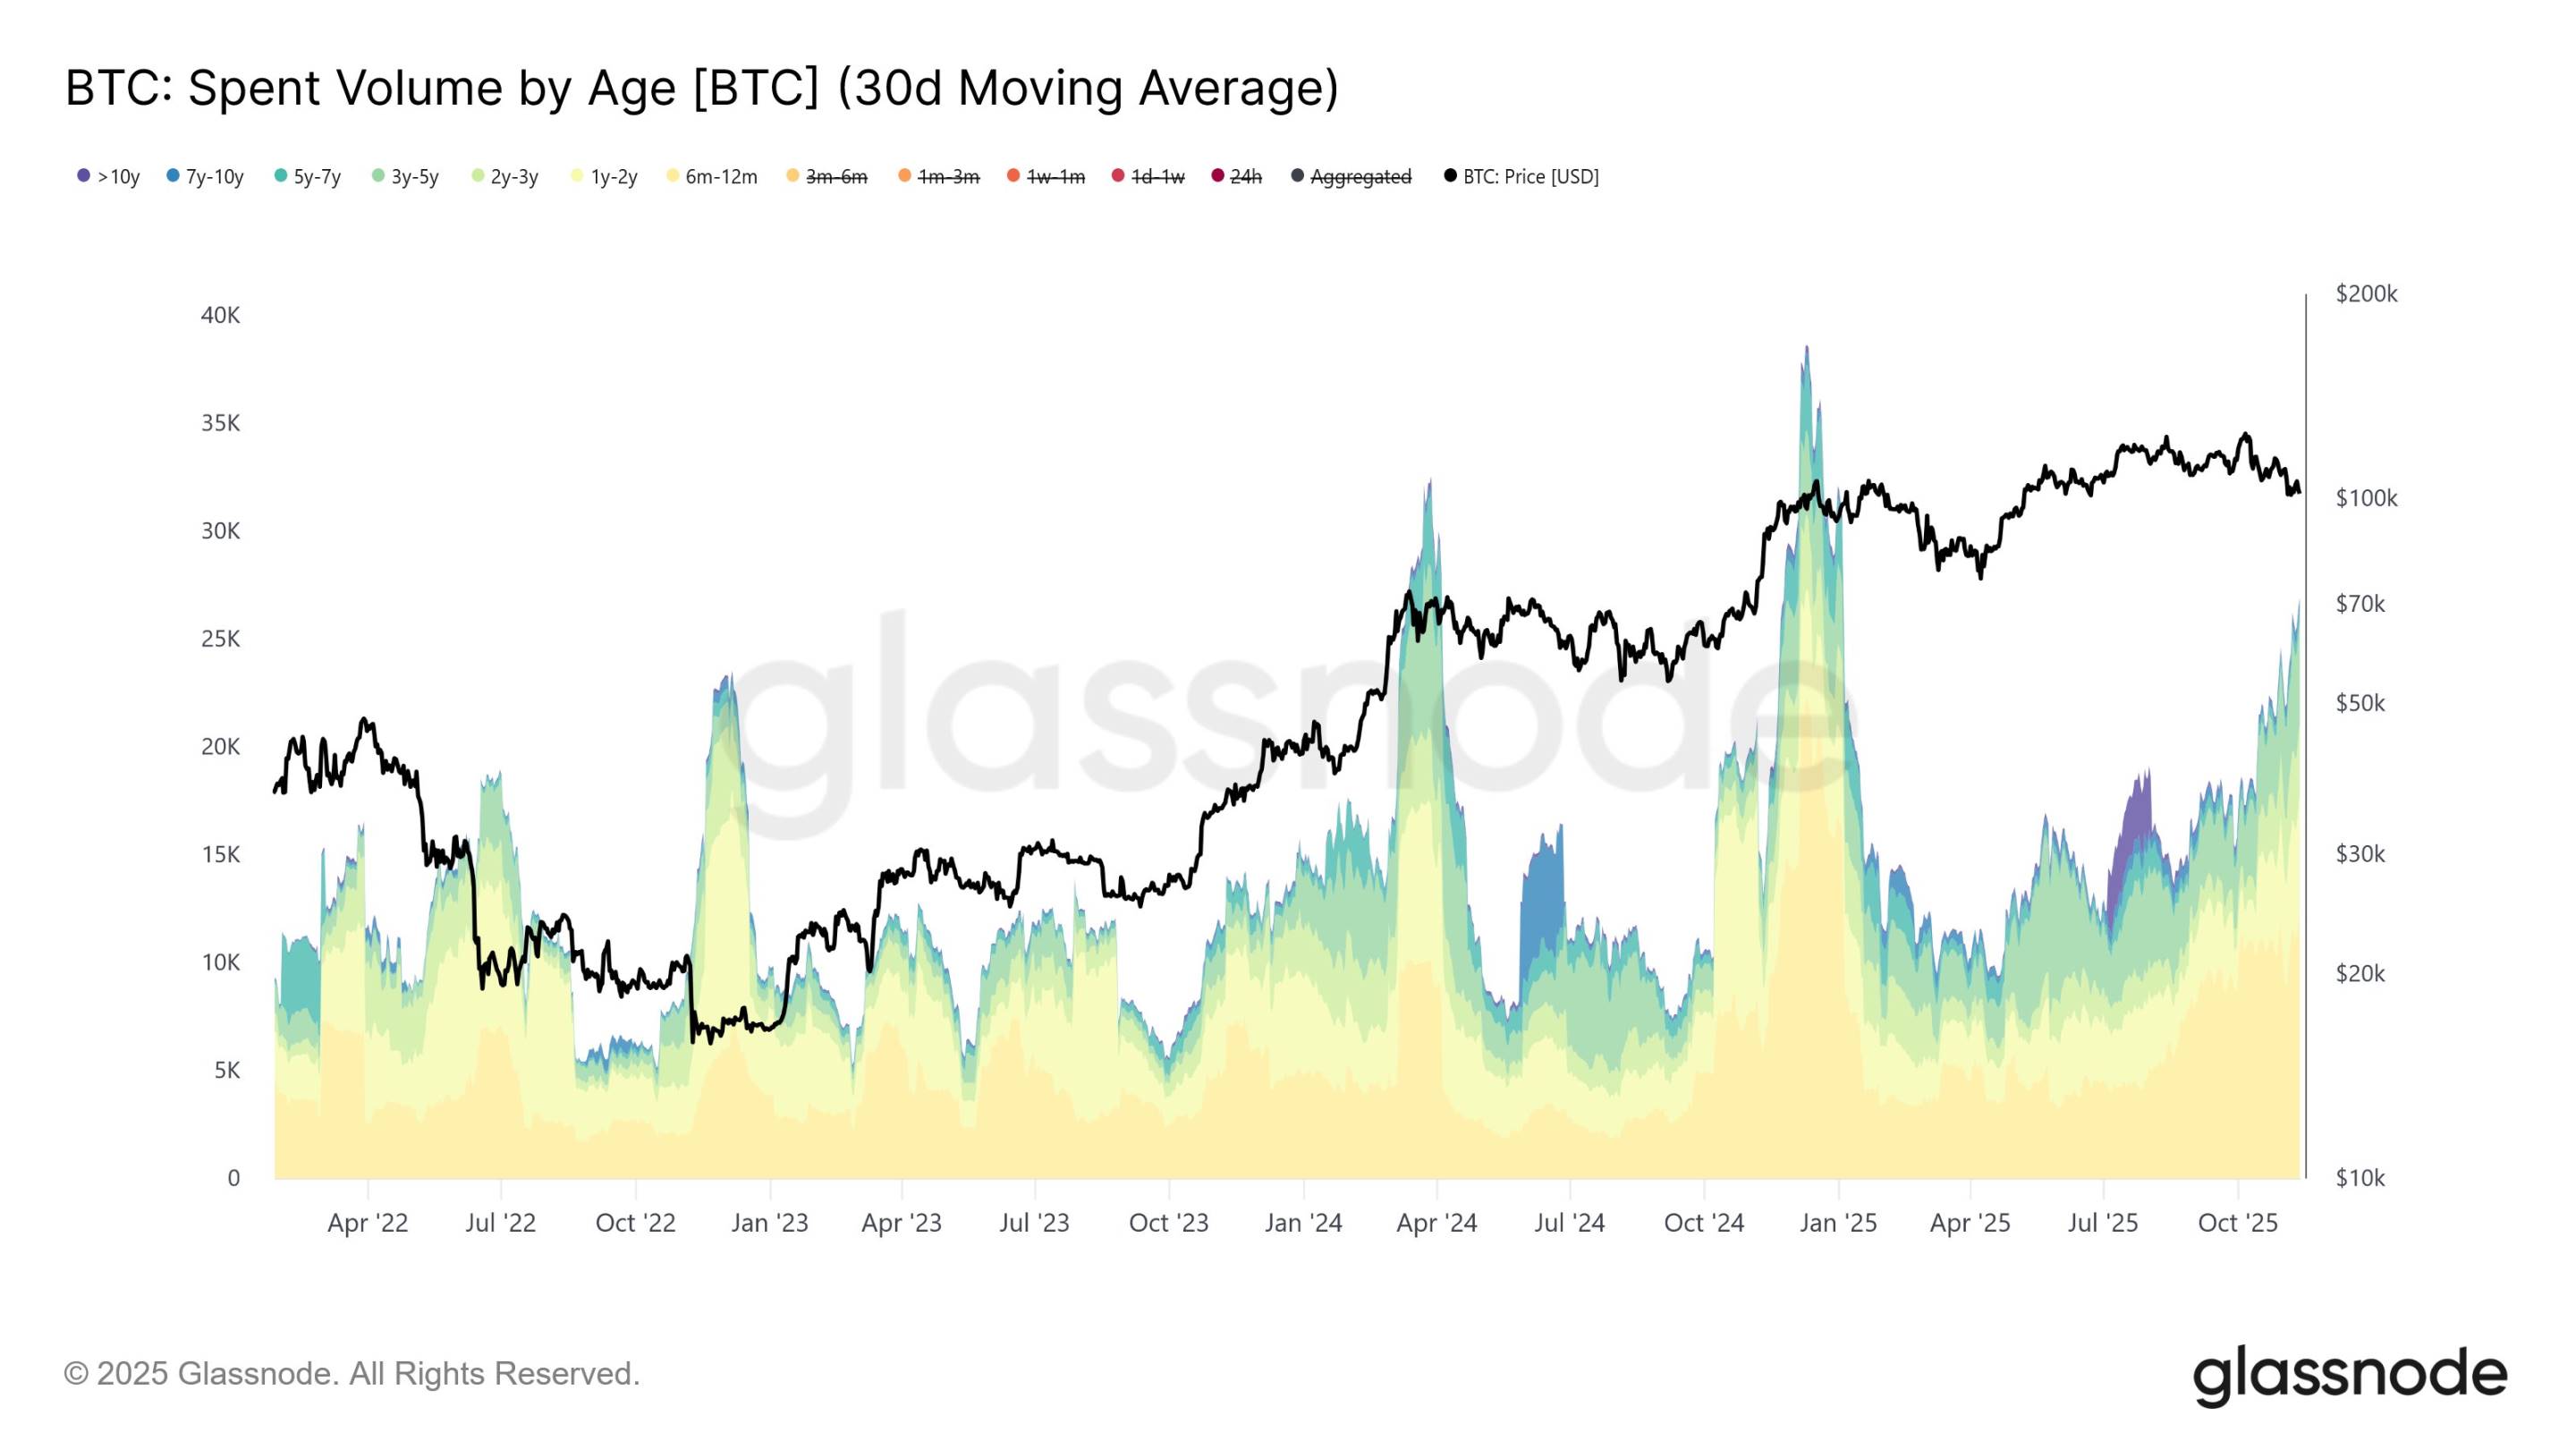
According to Foresight News, Glassnode monitoring shows that the monthly average spending of long-term Bitcoin holders has significantly increased, rising from an average of 12,500 BTC per day in early July to 26,500 BTC today (30-day moving average). This ongoing upward trend reflects the increasing distribution pressure among older investor groups, which is a typical late-cycle profit-taking pattern rather than a sudden withdrawal by whales. Even among whale wallets that have been isolated for over seven years, data showing spending of over 1,000 BTC per hour also displays a similar trend. These high-intensity expenditures have appeared in every major bull market cycle, but what is characteristic now is their frequency; events of spending over 1,000 BTC are becoming more frequent and evenly spaced, indicating sustained, decentralized distribution rather than a sudden "OG dump." Meanwhile, the acceleration of distribution by long-term holders and the rapid decline in supply have led to a sharp shift in net position to negative values, with long-term holders beginning to realize profits while defending the $100,000 level during the bull market.
Yi Lihua: Still believe that $3,000 to $3,300 is the best bottom-fishing opportunity
Yi Lihua, founder of Liquid Capital (formerly LD Capital), stated, "Due to the decline in expectations for a rate cut in December, U.S. stocks and cryptocurrencies have plummeted, but we still believe that $3,000 to $3,300 is the best bottom-fishing opportunity. We have been consistent in our actions. Remember when we held on during the black swan correction at $2,700, we used leverage but faced significant psychological pressure, leading us to unload leverage above $3,000 just for better sleep. This time, we are bottom-fishing in the spot market without leverage, insisting on adding positions during the pullback, and the rest is just patience."
免责声明:本文章仅代表作者个人观点,不代表本平台的立场和观点。本文章仅供信息分享,不构成对任何人的任何投资建议。用户与作者之间的任何争议,与本平台无关。如网页中刊载的文章或图片涉及侵权,请提供相关的权利证明和身份证明发送邮件到support@aicoin.com,本平台相关工作人员将会进行核查。


