Events can turn the page, but the game will continue.
Written by: David, Deep Tide TechFlow
At 5 AM Beijing time on November 13, a government shutdown crisis lasting 43 days, which set a historical record in the United States, is about to come to an end.
The U.S. House of Representatives passed a temporary funding bill with a vote of 222-209 on the evening of November 12, which was signed into law by Trump.
Thus, the shutdown that began on October 1 is declared over.
During these 43 days, flights were significantly delayed, food assistance programs were interrupted, and the release of economic data was paused, casting uncertainty over every aspect of the world's largest economy.
As the shutdown ends, how will the market react?
For investors in the cryptocurrency market and traditional financial markets, this is not just the conclusion of a political event, but also a window to observe how asset prices respond to the "elimination of uncertainty."
Historical data shows that **after the last few major U.S. government shutdowns ended, the **U.S. stock market, gold, and Bitcoin exhibited different trend characteristics.
This time, as the government reopens and federal funds resume flowing, which assets might benefit?
If you don't have time to read, the image below can help you quickly grasp the key points.

The following text provides more details to help you learn from history and become a smart investor.
How Does a Shutdown Affect Investments?
To understand the market reaction after the end of a shutdown, we first need to clarify: how does a government shutdown affect asset prices?
A government shutdown is not simply "government employees taking a holiday."
According to estimates from the Congressional Budget Office (CBO), the 35-day shutdown from 2018 to 2019 caused approximately $3 billion in permanent GDP losses, along with about $8 billion in delayed temporary economic activity.
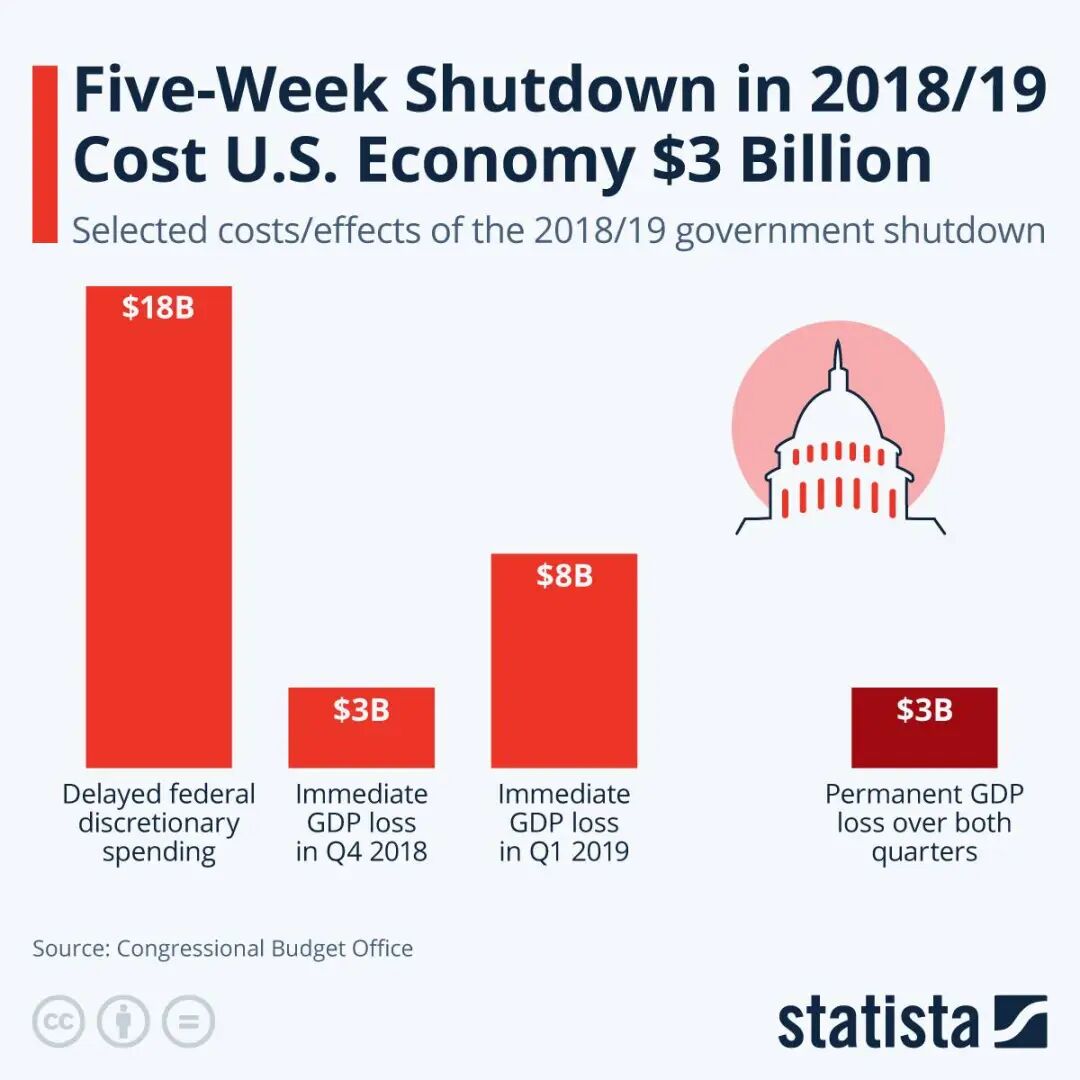
This current 43-day shutdown has broken historical records. Although the CBO has not yet released an economic impact assessment for this shutdown, considering its longer duration and broader impact, economic losses are likely to significantly exceed those of 2018-2019.
The tangible reduction in economic activity will be reflected in key indicators such as GDP growth rate, consumer data, and corporate profits.
But more important than the economic loss itself is the uncertainty.
One of the core logics of financial markets is: investors are averse to uncertainty.
**When the future is unpredictable, funds tend to *reduce* holdings in high-risk assets (such as tech stocks and growth stocks), increase holdings in safe-haven assets (gold, U.S. Treasuries, etc.), reduce leverage, and hold cash to wait and see.**
So conversely, what happens when the shutdown ends? Theoretically, the end of the shutdown means:
Policy certainty returns - At least for the next few months, government funding is secured.
Economic data resumes publication - Investors regain tools to assess the economic fundamentals.
Fiscal spending restarts - Delayed purchases, wages, and benefits begin to be disbursed, providing a short-term boost to the economy.
Risk appetite recovers - The worst-case scenario is lifted, and funds chase returns again.
This usually triggers a "relief rally," as the elimination of uncertainty itself is a positive factor.
However, it is important to note that this rally may not be lasting.
After the shutdown ends, the market will quickly return to focusing on economic fundamentals; therefore, we believe the impact of the shutdown's end on the market can be divided into two levels:
Short-term (1-2 weeks): Emotional recovery brought about by the elimination of uncertainty, usually favorable for risk assets.
Medium-term (1-3 months): Depends on whether the economic fundamentals are truly damaged and other macro factors.
For the cryptocurrency market, there is also a special consideration: the resumption of regulatory agency operations.
Agencies like the SEC and CFTC were essentially stagnant during the shutdown, with approval processes paused and enforcement actions delayed. When the government reopens, how these agencies "catch up" is also a variable worth paying attention to.
Next, let’s look at historical data to see how the U.S. stock market, gold, and Bitcoin performed after the last few major shutdowns ended.
Historical Review of U.S. Stocks: There’s Always a "Relief Rally" After a Shutdown Ends
Let’s focus on three long-lasting shutdown events that significantly impacted the market and see how investors responded with real money in the U.S. stock market when the government reopened.

We can see:
1. December 1995 Shutdown (21 days): Mild increase on the eve of the tech bubble
On December 16, 1995, the Clinton administration and the Republican-controlled Congress became deadlocked over a budget balancing plan, forcing the government to shut down.
Market performance:
1 month later: S&P 500 rose to 656.07 (+6.1%), Nasdaq 1093.17 (+5.9%), Dow Jones 5539.45 (+6.6%);
3 months later: S&P 500 reported 644.24 (+4.2%), Nasdaq 1105.66 (+7.1%), Dow Jones 5594.37 (+7.6%);
This resembles a typical pattern of rising first and then adjusting. Three major indices recorded around 6% rebounds one month after the shutdown, but by three months, the gains narrowed, with the S&P 500 even retreating from its one-month peak.
Although this is a long time ago, considering the political and economic environment at the time, the underlying reason may be that the market, after digesting the short-term benefits of the shutdown's end, returned to fundamental pricing.
The beginning of 1996 marked the start of the "golden age" of the U.S. economy, with the emergence of personal computers and the internet, and technology development was in its infancy, coupled with mild inflation, the market was already in a long-term upward channel, and the shutdown disturbance felt more like an interlude.
2. October 2013 Shutdown (16 days): U.S. stocks break above pre-financial crisis highs
On October 1, 2013, the Republican Party attempted to force the Obama administration to delay the implementation of the Affordable Care Act through a shutdown, leading to another government closure. This shutdown lasted 16 days and reached an agreement in the early hours of October 17.
Market performance:
1 month later: S&P 500 rose to 1791.53 (+3.4%), Nasdaq 3949.07 (+2.2%), Dow Jones 15976.02 (+3.9%);
3 months later: S&P 500 reported 1838.7 (+6.1%), Nasdaq 4218.69 (+9.2%), Dow Jones 16417.01 (+6.8%);
This shutdown occurred at a special historical juncture: October 2013 was when U.S. stocks emerged from the shadow of the financial crisis and broke above the 2007 highs.
The end of the shutdown coincided almost simultaneously with a technical breakthrough, combined with the QE3 quantitative easing that the Federal Reserve was implementing at the time, leading to extremely optimistic market sentiment. The Nasdaq saw nearly a 10% increase within three months, significantly outperforming traditional blue-chip stocks, with tech stocks once again becoming the leaders of the rebound.
3. December 2018 Shutdown (35 days): Bear market bottom reversal, the strongest rebound after a shutdown
On December 22, 2018, Trump insisted on $5.7 billion in funding for the U.S.-Mexico border wall, leading to a standoff with the Democrats. This confrontation lasted until January 25, 2019, setting the record for the longest shutdown at that time (35 days), until this current 42-day shutdown surpassed it.
Market performance:
1 month later: S&P 500 rose to 2796.11 (+4.9%), Nasdaq 7554.46 (+5.4%), Dow Jones 26091.95 (+5.5%);
3 months later: S&P 500 reported 2926.17 (+9.8%), Nasdaq 8102.01 (+13.1%), Dow Jones 26597.05 (+7.5%);
This was the strongest rebound among the three shutdowns, with special reasons behind it.
In the fourth quarter of 2018, U.S. stocks plummeted nearly 20% from their highs due to Federal Reserve interest rate hikes and trade frictions, hitting a temporary low on December 24.
The end of the shutdown coincided almost perfectly with the market bottoming out, combined with the Federal Reserve's subsequent policy shift to pause interest rate hikes, creating a double positive that likely drove the strong rebound.
The Nasdaq's 13% increase over three months once again confirmed the high elasticity of tech stocks during the risk appetite recovery phase.
Looking back at the historical data of U.S. stocks after shutdowns, three clear patterns emerge:

First, short-term rebounds are a high-probability event. After the end of the three shutdowns, all three major indices rose within one month, with increases ranging from 2% to 7%. The elimination of uncertainty itself is a positive factor.
Second, tech stocks often outperform the market. The Nasdaq's increases over three months were 7.1%, 9.2%, and 13.1%, all significantly higher than the Dow Jones's 7.6%, 6.8%, and 7.5%.
Third, medium-term trends depend on the macro environment. The performance differences in the 1-3 months following the end of the shutdown varied greatly, with 1996 showing a rise followed by a correction, 2013 showing sustained growth, and 2019 showing a strong rebound, each backed by their own macro logic rather than the shutdown itself.
Historical Review of Gold: Trends Do Not Depend on the Shutdown Itself
When we turn our attention to gold, we find a story that is completely different from the stock market.
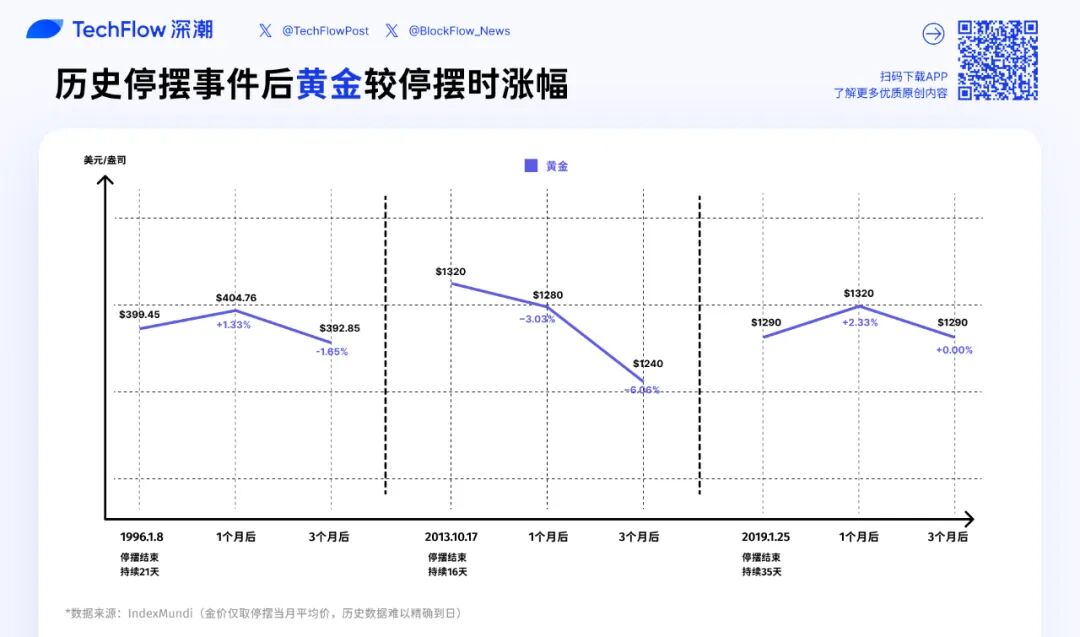
1. December 1995 Shutdown (21 days): Slight fluctuations
Gold Price Performance:
End of Shutdown (January 1996): $399.45/ounce
1 Month Later (February 1996): $404.76 (+1.3%)
3 Months Later (April 1996): $392.85 (-1.7%)
The impact of this political event on gold prices was minimal.
**2. October 2013 Shutdown (16 Days): Continued *Pullback*
Gold Price Performance:
End of Shutdown (October 2013): $1320/ounce
1 Month Later (November 2013): $1280 (-3.0%)
3 Months Later (January 2014): $1240 (-6.1%)
This was the weakest performance of gold among the three shutdowns. 2013 was a bear market year for gold, dropping from $1700 at the beginning of the year to $1200 by the end, with an annual decline of over 25%.
The underlying reason was that the Federal Reserve began discussing tapering quantitative easing, and a stronger dollar suppressed gold prices. After the shutdown ended, as uncertainty faded, gold's safe-haven attributes further weakened, leading to a rapid price decline.
3. December 2018 Shutdown (35 Days): Rise Followed by Decline
Gold Price Performance:
End of Shutdown (January 2019): $1290/ounce
1 Month Later (February 2019): $1320 (+2.3%)
3 Months Later (April 2019): $1290 (0%)
During this shutdown, U.S. stocks experienced a sharp decline at the end of 2018, with heightened safe-haven sentiment pushing gold prices from $1230 to $1290. After the shutdown ended, gold prices briefly surged to $1320, but as the stock market rebounded and risk appetite increased, gold prices fell back to the level at the end of the shutdown, resulting in no change over three months.
In the shutdowns of 2013 and 1996, the stock market rose by 3-6% after the shutdown ended, while gold either fell (2013: -6.1%) or remained flat (1996: -1.7%).
This aligns with the subjective understanding that when uncertainty is eliminated and risk appetite increases, funds flow from safe-haven assets to risk assets.
If history repeats itself, after the end of this 42-day shutdown, gold may face the following two scenarios:
Scenario 1: Rapid Decline in Safe-Haven Sentiment. If gold prices have already risen due to safe-haven demand during the shutdown, the end of the shutdown may trigger "profit-taking," leading to a short-term pullback of 5-10%. This was most evident in the 2013 case.
Scenario 2: Macroeconomic Risks Remain. If the shutdown ends but macro concerns such as U.S. fiscal issues, debt ceiling, and recession risks still exist, gold may maintain strength or even continue to rise.
After all, the shutdown is only temporarily over.
From the current gold price perspective, the end of the shutdown may alleviate short-term safe-haven demand, but it is unlikely to change the long-term upward trend of gold.
BTC Historical Review: Limited Samples, but Still Insightful
Finally, we arrive at the question most concerning cryptocurrency investors: how will Bitcoin perform after the shutdown ends?
To be frank, the historical samples are extremely limited. Bitcoin did not exist during the 1996 shutdown, and during the 2013 shutdown, BTC's market cap was too small and it was in a super bull market, leaving only the 2018-2019 instance as truly valuable for reference.

**1. October 2013 Shutdown (16 Days): A *Bull Market* Interlude, Little Relation to the Shutdown**
BTC Price Performance:
End of Shutdown (October 17, 2013): $142.41
1 Month Later: $440.95 (+209.6%)
3 Months Later: $834.48 (+485.9%)
These figures seem extremely exaggerated, tripling in one month and nearly sextupling in three months.
2013 was one of the craziest bull market years in Bitcoin's history, surging over 5000% throughout the year, from $13 at the beginning to a peak of $1,147 by the end.
October was the acceleration phase of this super bull market. BTC had just experienced a crash following the FBI's seizure of "Silk Road," and the market quickly rebounded after a brief panic, entering the most frenzied peak phase.
However, this shutdown had almost no causal relationship with BTC's price movement; the government shutdown was more of a noise-level event in BTC's price logic.
**2. December 2018 Shutdown (35 Days): The *Bear Market* Bottom, a Key Turning Point**
BTC Price Performance:
End of Shutdown (January 25, 2019): $3607.39
1 Month Later: $3807 (+5.5%)
3 Months Later: $5466.52 (+51.5%)
In December 2018, BTC was at the bottom of a long bear market. From the high of $19,000 in December 2017, BTC had plummeted over 80%, hitting a temporary low of $3,122 on December 15, 2018. The start of the shutdown (December 22) almost coincided with BTC's bottom.
In the month following the end of the shutdown, BTC only saw a modest rebound of 5.5%, significantly lower than the 4.9-5.5% gains in U.S. stocks;
However, by three months later, BTC's increase reached 51.5%, significantly outperforming the S&P 500's 9.8% and Nasdaq's 13.1%.
Several key factors contributed to this:
First, the logic of BTC's own bottom reversal. In early 2019, there was a consensus in the crypto market that "the worst moment has passed": miners capitulated, retail investors exited, but institutions began to position themselves.
Second, the improvement in the macro environment. The Federal Reserve signaled a dovish stance in early 2019, and global liquidity expectations improved, which was favorable for high-risk assets like BTC.
Third, BTC's market cap at the time was about $60 billion, much smaller than the stock market, with lower liquidity, leading to greater volatility. When risk appetite increased, BTC's elasticity naturally became stronger.
Compared to the performance of gold and stocks, Bitcoin exhibited more of a result from macro Beta combined with its own cycle.
In the short term, BTC behaves like a high Beta risk asset.
After the shutdown ends, when uncertainty is eliminated and risk appetite increases, BTC's rebound (12%) is close to that of the Nasdaq (5.4%) and far exceeds that of gold (2.3%). This indicates that in the **1-3 month time frame, BTC's pricing logic is closer to that of **tech stocks, rather than safe-haven assets.
However, in the medium to long term, BTC has its own cycle. After BTC rose to $5,200 in April 2019, it continued to rise to $13,800 in June, with gains far exceeding any traditional asset. The core driver of this rise may have come from the approaching four-year halving cycle, along with institutional and large company entries.
The government's shutdown is no longer a significant factor.
So looking ahead, how will BTC react after this 42-day shutdown ends?
Short-term (1-2 weeks): If the end of the shutdown triggers a "relief rally" in U.S. stocks, BTC is likely to follow suit and rise;
Medium-term (1-3 months): This will largely depend on the macro environment. If the Federal Reserve maintains an accommodative stance, economic data remains strong, and there are no new political crises, BTC may continue its upward trend.
But don't forget, the current crypto market lacks a breakthrough narrative, so expecting BTC's price to be driven by internal factors is unlikely.
The shutdown ends, but the game continues
The 42-day shutdown is about to come to an end, but this is not the conclusion; it is the beginning of a new round of market changes.
Looking back at history, markets typically experience a short-term rebound after a shutdown ends; however, the sustainability of this rebound needs to be viewed rationally.
When you see the market rise by 5% after the shutdown ends, don't rush to FOMO; when you see BTC pull back in the short term, don't panic sell.
Stay rational, focus on the fundamentals, manage risks well, and principles will not change because of a shutdown.
Events can turn the page, but the game will continue.

免责声明:本文章仅代表作者个人观点,不代表本平台的立场和观点。本文章仅供信息分享,不构成对任何人的任何投资建议。用户与作者之间的任何争议,与本平台无关。如网页中刊载的文章或图片涉及侵权,请提供相关的权利证明和身份证明发送邮件到support@aicoin.com,本平台相关工作人员将会进行核查。


