Author: Coinbase Institutional Research
Key Points
Despite the ongoing panic in the entire cryptocurrency market, we believe that the liquidation event in October is more likely to be the prelude to a medium- to long-term strengthening rather than a sign of weakness, creating a good start for the rise in the fourth quarter.
However, a comprehensive stabilization of the market may take several months, with a more likely gradual warming trend in the medium term rather than a surge to historical highs.
Over the past 30 days, the flow of "smart money" in the crypto space has concentrated around the EVM technology stack, moving away from Solana and BSC.
Summary
After the massive liquidation event on October 10, we believe the cryptocurrency market has reached a short-term bottom, and the current market position has significantly improved. The market seems to be resetting rather than collapsing. We believe this round of sell-off has restored the market's leverage levels to a healthier structural state, which may support the medium- to short-term trend. However, a slow rise rather than a direct surge to historical highs is more likely in the coming months.
From a technical perspective, this deleveraging event is more of a fundamental adjustment in the market rather than a solvency crisis, although the sell-off of altcoins and the withdrawal of market makers have indeed put pressure on the highest-risk areas of the cryptocurrency market. On the positive side, we believe this technically driven market indicates that the fundamentals of the crypto market remain robust. Institutional investors—most of whom were not affected by the leveraged liquidations—may lead the next round of increases. Although the macro environment is more complex and risky than at the beginning of the year, it still provides overall support.
Observing the flow of "smart money" in the field (according to Nansen's report), funds are shifting towards the EVM stack (such as Ethereum and Arbitrum), while momentum in Solana and Binance Smart Chain (BSC) is weakening. It should be noted that we only consider the flow of smart money as a screening tool—rather than a buy signal—to identify the distribution of market depth, incentive mechanisms, and developer/user activity across various protocols, decentralized exchanges, and blockchains. Meanwhile, stablecoin data points to capital rotation rather than new capital inflows, indicating that the market rebound in the short term will still rely on tactical incentives and narrative-driven rotation effects.
The Great Grain Robbery
A well-known anecdote in the commodity trading circle is the "Great Grain Robbery." This event occurred in 1973, and despite its name, it was not an actual robbery. Instead, the Soviet Union systematically withdrew wheat and corn stocks from the open market in secret over the course of a month. This action went unnoticed for a long time until global grain prices soared by 30%-50%, revealing that the Soviet Union was facing a massive crop failure—leading to a dangerous drop in global food supply.
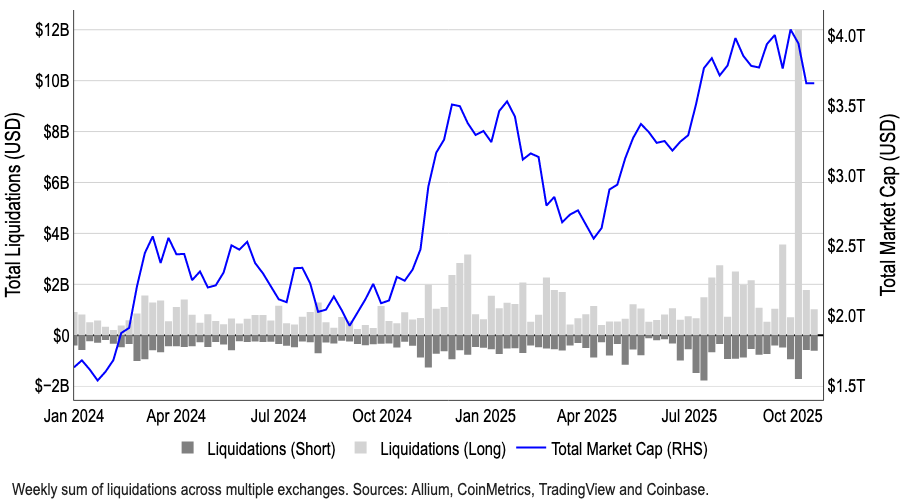
The chain reaction of cryptocurrency liquidations triggered by tariffs on October 10—causing many altcoins to plummet by 40%-70%—is remarkably similar to the information dissemination mechanism of that event. In both cases, the information asymmetry during periods of liquidity exhaustion caused significant market misalignment, leading to disproportionate impacts on low-liquidity, high-beta assets.
Figure 1: The Largest Liquidation Event in Cryptocurrency History
In 1973, U.S. officials failed to detect the global food shortage, rooted in flaws in the agricultural monitoring system. Senator Henry Jackson accused them of either "incredible negligence" or "deliberate concealment." The event led to the development of satellite crop monitoring technology to avoid future information asymmetries.
The chain reaction of collapses in the cryptocurrency space stems not only from information gaps but also from flaws in execution mechanisms: the liquidity of altcoins is dispersed across multiple exchanges, and decentralized protocols automatically liquidate over-collateralized altcoin positions when health metrics deteriorate. This often creates self-reinforcing selling pressure during price declines. Not to mention that market makers now primarily hedge risks by shorting altcoins (due to their significantly higher beta relative to large-cap coins, allowing for smaller position sizes). However, due to the automatic deleveraging mechanism (ADL), many institutions suddenly closed positions and withdrew buy-side liquidity, exacerbating the sell-off.
Both events confirm an eternal market truth: when liquidity is exhausted and information asymmetry increases, any corner of the market with the highest beta and leverage will become a pressure release valve, bearing the brunt of forced selling impacts. But what will happen next?
Recovery Pattern
We believe this sell-off is a necessary reset process for the crypto market, rather than a peak of the cycle, potentially paving the way for a slow rise in the coming months. Before the October 10 event, we were primarily concerned that the current bull market cycle might end too early. In fact, our survey conducted from September 17 to October 3 showed that 45% of institutional investors believed the bull market was nearing its end.
After the sell-off event, we are even more convinced that there is directional upside potential in the crypto market, although the layout of cryptocurrencies in the coming months will depend more on the repair of market structure rather than headline news catalysts. The liquidation chain reaction exposed vulnerabilities in collateral standards, pricing sources, and cross-platform transfer resilience.
Figure 2: The Brief but Intense Impact of Leverage Reshapes the Crypto Market Landscape
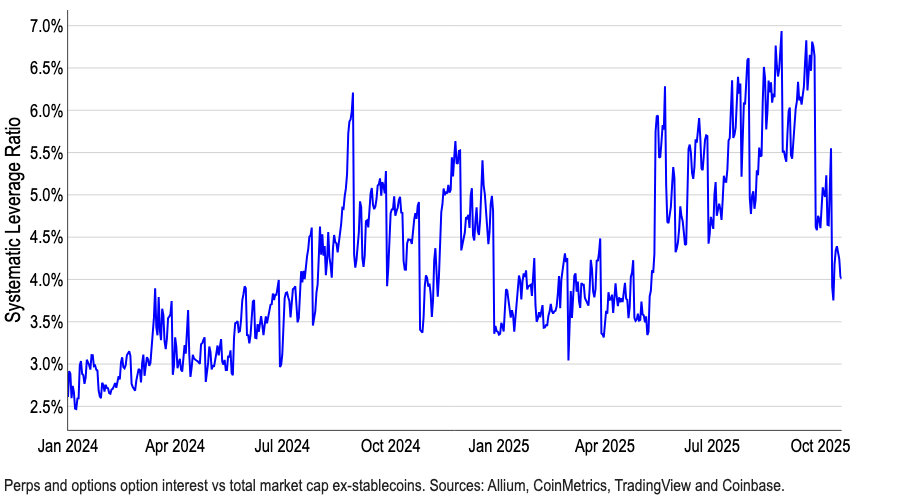
However, leverage levels have essentially reset—our systemic leverage ratio (based on total open interest in derivatives divided by total cryptocurrency market capitalization, excluding stablecoins) shows that the current level is only slightly above the beginning of the year (Chart 2). We believe this indicator will become one of the most critical monitoring data points in the medium- to short-term. The current leverage ratio indicates that, before risk control measures are coordinated and market maker depth fully recovers, the market will still face intermittent liquidity gaps and sharper risk tails.
Looking ahead, we expect market momentum to be primarily driven by institutional capital inflows—institutional investors were largely unaffected by this deleveraging event. Most institutions either maintained low-leverage exposure or concentrated their positions in large-cap assets, while alternative coins led by retail investors bore the brunt of the liquidation chain reaction. As institutional investment willingness recovers, the cryptocurrency market is expected to rebound, but this process may take several months.
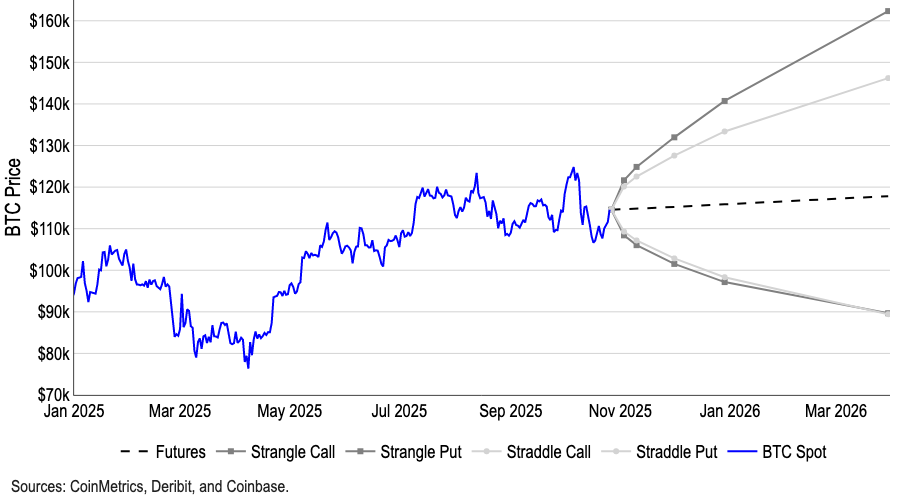
Therefore, we anticipate that Bitcoin's dominance will gradually increase over the next 2-3 months, which may exert downward pressure on ETH/BTC and altcoin/BTC trading pairs before the market ultimately rotates. It is worth noting that, based on the breakeven points of straddle and strangle options strategies, the current market's implied probability distribution range for Bitcoin prices over the next 3-6 months is between $160,000 and $90,000, with expectations showing an upward asymmetric bias (Chart 3).
Figure 3: Implied Distribution of BTC Price Expectations Based on Straddle and Strangle Options Breakeven Points
Tracking Fund Flows
We believe that fund flows are the most intuitive barometer of market participants' confidence after a decline. Following the recent deleveraging, we have observed price overshooting while market narratives have become ambiguous. To grasp position dynamics, we recommend paying attention to the current (re)deployment direction of "smart money"—including investment funds, market makers, venture capital firms, and consistently high-yield traders.
Tracking these fund flows can reveal which ecosystems are regaining depth, incentive mechanisms, and developer/user activity—i.e., hotspots for short-term opportunities, as well as protocols, decentralized exchanges, and blockchains worth monitoring. However, this does not mean that market participants should directly buy the native tokens of these platforms, as on-chain footprints may reflect yield farming, liquidity provision, basis/funding arbitrage, or airdrop positioning. Additionally, it is difficult to ascertain whether the buying by smart money is tactical (incentive-driven) or sustainable. We believe a more reasonable approach is to view the flow of smart money as a tool for screening opportunities.
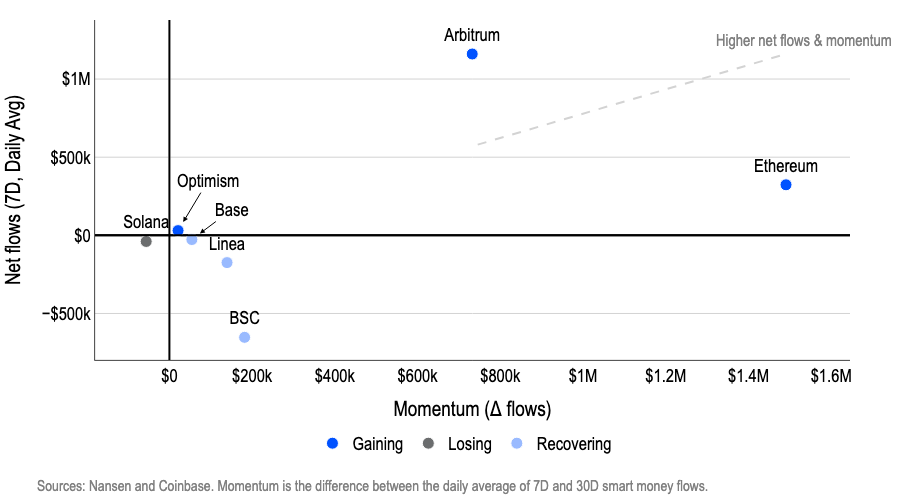
After October 10, funds have shifted towards Ethereum L1/L2 (i.e., Ethereum, Arbitrum), while Solana and BSC have lost momentum. Ethereum and Arbitrum lead in net inflows over the past seven days, and momentum has continued to strengthen over the past 30 days (Chart 4). Meanwhile, funds are withdrawing from Solana and BSC; although the outflows from BSC have eased, they remain negative.
Figure 4: Smart Money Flow—Categorized by Chain
The catalysts for these fund flows vary. For example, Arbitrum restarted its incentive mechanisms and DAO plans in October (such as DRIP Epoch 4 directing rewards towards Aave lending/liquidity, Morpho, and gaming-related activities), coinciding with the re-deployment of liquidity and restarting the flywheel effect.
We believe it may be wise to closely monitor tokens on the Base chain to capture potential turning point trading opportunities. This weekend (October 25-26), activity on the Base chain surged: the x402 ecosystem exhibited parabolic growth, and the acquisition of Clanker by Farcaster led to new token issuance and user traffic. This growth builds on previous catalysts—ongoing speculation around Base tokens, open-source Solana bridging solutions, Zora's landing on the Robinhood platform, and Coinbase's acquisition of Echo—collectively expanding application scenarios and creating more opportunities for liquidity rotation.
Meanwhile, since October 10, the sector rotation has seen the "utility + yield" logic replace speculative operations as the mainstream. In the market misalignment following the collapse, yield protocols have led the flow of smart money, reopening double-digit APYs (such as fixed/variable yield combinations and funding rate arbitrage), while the NFT/metaverse/gaming sectors have been driven by strategy-driven mechanisms (such as the deflationary NFT trading cycle of PunkStrategy) and significant transactions (such as Coinbase's acquisition of UPONLY).
Figure 5: Fund Flows—Categorized by Sector
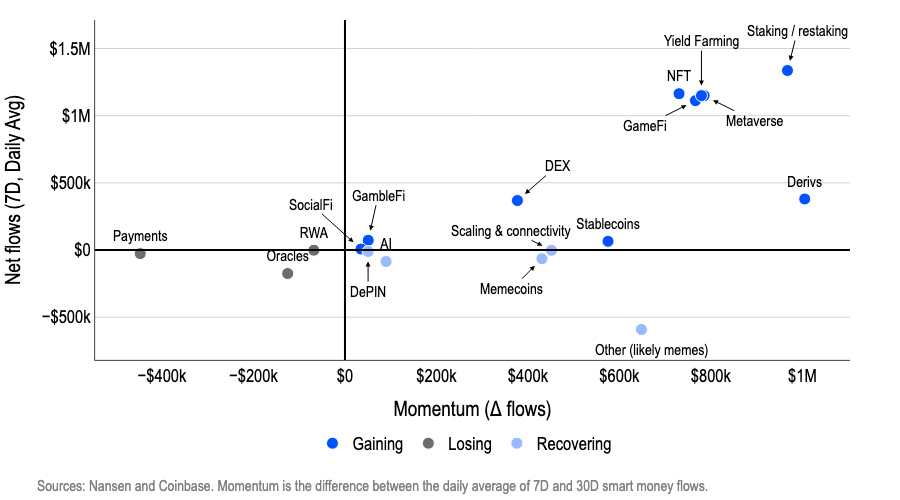
The staking/re-staking theme continues to strengthen, with institutional products making headlines—Grayscale launched the first Ethereum and SOL staking-based U.S. exchange-traded products. In short, smart money is gathering in areas with clear income paths, reliable incentive mechanisms, and institutional access points, reallocating risks through stablecoins (Chart 5).
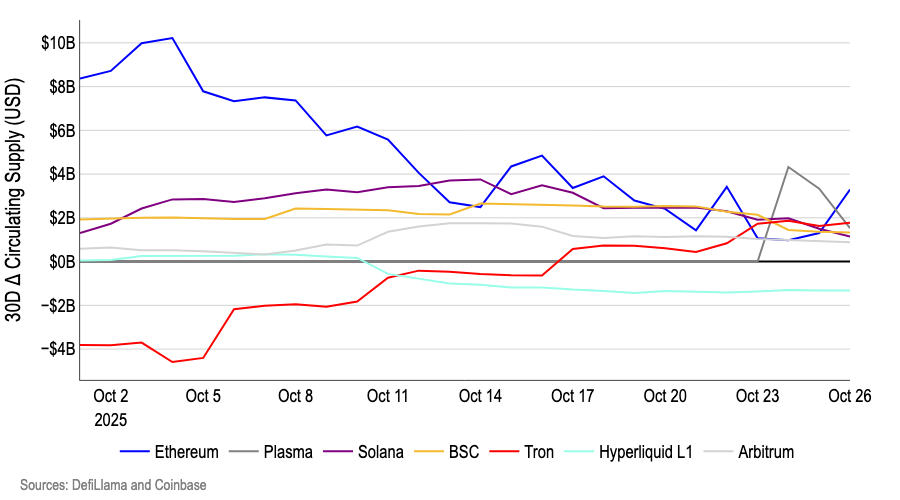
Stablecoin liquidity data also indicates a current trend of capital rotation rather than new capital inflows. Over the past month, the 30-day stablecoin growth rate has shown a downward trend across most mainstream blockchains, except for Tron (Chart 6). We believe this indicates that the fund flows after the collapse are redistributions rather than new inflows—liquidity is selectively shifting between protocols with actual catalysts, but there has not been a widespread surge in stablecoin supply. In practical terms, this means that the rebound will still rely on tactical incentives and narrative-driven rotations until a clear expansion of stablecoin circulation supply leads to a broad-based rally.
Figure 6: Stablecoin Supply Momentum—Categorized by Chain
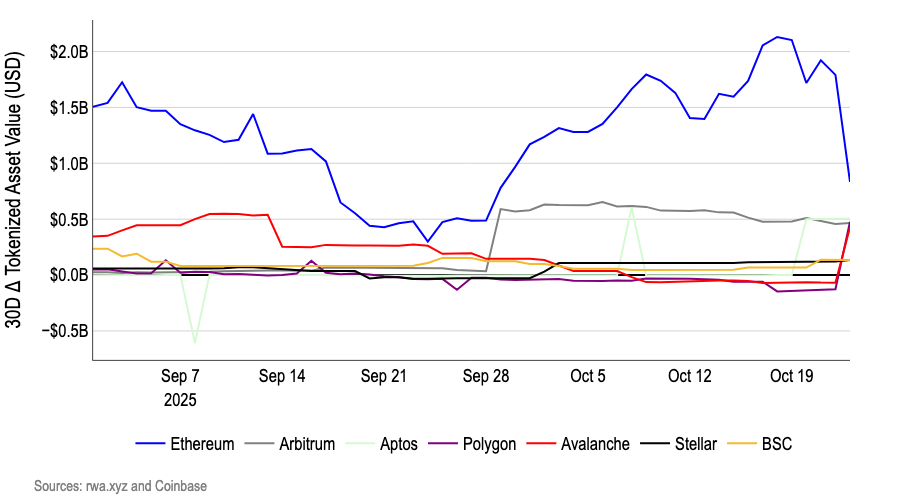
The tokenized asset sector is a key area of focus for institutions. In October, BlackRock's BUIDL injected approximately $500 million into Polygon, Avalanche, and Aptos, respectively (Figure 7). This total investment of about $1.5 billion highlights the value of real-world assets (RWAs) as a resilient narrative—attracting traditional financial participation during volatile periods by providing stable returns (tokenized government bond yields of 4-6%) and liquidity, while avoiding the speculative bubbles that were liquidated during the chain reaction collapse on October 10.
These deployments are gradually breaking through the limitations of Ethereum (BUIDL's initial base) and fully leveraging the advantages of each chain: Polygon offers Ethereum-compatible scalability with low fees; Avalanche, with its high throughput subnet, becomes an ideal choice for institutional-grade DeFi integration; Aptos handles complex assets with the security mechanisms of the Move language. Although this appears to be a selective expansion by a single participant (BlackRock), we believe that, in the context of increasing overall uncertainty in the cryptocurrency space, its commitment to expanding access channels for RWAs underscores the strategic value of the RWA sector as a future growth point.
Figure 7: Flow of Real-World Assets—Categorized by Chain
Do Not Ignore the Macroeconomic Environment
Finally, it is essential to remember that cryptocurrencies are still trading in a highly complex and increasingly risky macroeconomic environment. This round of sell-offs has eliminated the excess leverage commonly seen at the end of a market cycle. However, multiple macro factors continue to impact investor confidence: trade frictions (such as tariff policies), geopolitical conflicts (such as U.S. sanctions on Russian oil producers), soaring fiscal deficits (in the U.S. and globally), and overvaluations in other asset classes.
Despite the Federal Reserve implementing easing policies, the yield on the U.S. 10-year Treasury remains around 4.0%, with a volatility range locked between 3.5% and 4.5%. This stability partly explains why we maintain a tolerant view towards the steepening of the yield curve (which typically flattens during prolonged easing periods). However, we believe the trend of yield curve steepening may continue, and if yields suddenly rise, risk assets such as U.S. stocks and cryptocurrencies may face downward correction risks. For instance, this could occur when fiscal buffer mechanisms fail.
On the other hand, if long-term yields do rise in line with U.S. economic growth, it would reflect strengthening economic fundamentals rather than policy concerns. Faster nominal growth and productivity improvements can absorb higher discount rates, thereby providing strong support for risk assets, including cryptocurrencies. Notably, we believe that current economists generally underestimate productivity levels—partly because factors like artificial intelligence are enhancing labor efficiency in ways that official statistics fail to fully capture.
Figure 8: Rising U.S. Labor Productivity (10-Year Annualized Growth Rate)
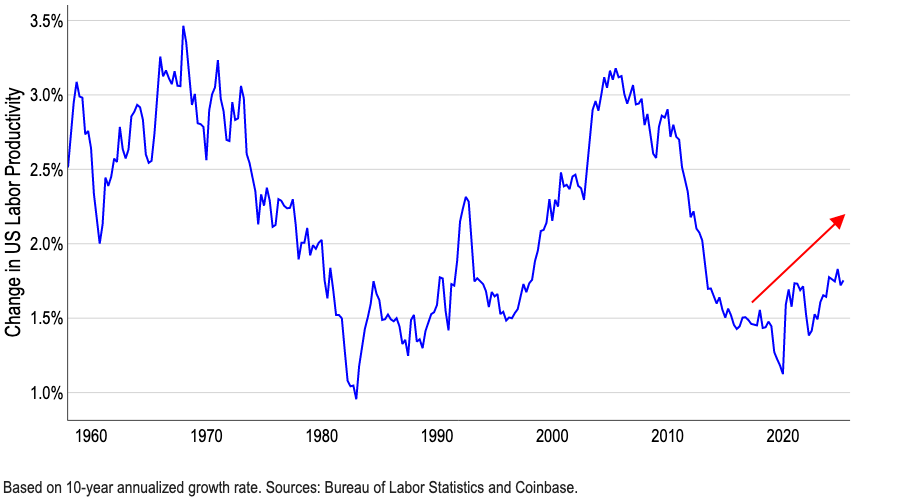
If this is the case, it suggests that the impact of macro volatility on risk assets through discount rates may be diminishing. This would shift the drivers of cryptocurrencies back to endogenous factors such as liquidity, fundamentals, positioning, and regulatory progress favorable to cryptocurrencies (e.g., the U.S. cryptocurrency market structure bill).
Conclusion
Overall, there is still intense debate about the phase of the cycle in which the crypto market finds itself, but we believe that the recent leverage liquidations have laid the groundwork for a slow rise in the coming months. The Federal Reserve's interest rate cuts, liquidity easing, and regulatory changes favorable to cryptocurrencies, such as the GENIUS/CLARITY bill, continue to support bullish expectations, potentially extending this cycle until 2026.
However, the flow of smart money after October 10 appears more like a selective re-risking rather than a large-scale return to risk assets. These funds are shifting towards the EVM stack (such as Ethereum and Arbitrum) and the "utility + yield" sectors, while inflows into Solana and BSC have slowed, and stablecoin growth has also decelerated. This indicates that capital is being redistributed towards specific verticals rather than being injected systemically.
At the same time, significant RWA fund flows indicate that institutions are cautiously expanding their on-chain layouts with a multi-platform strategy. In practical terms, we believe that short-term rebounds will still focus on areas where incentive mechanisms, product launches, and institutional channels intersect, although more sustainable cryptocurrency price trends may require an initial recovery in overall liquidity. While the sentiment in the crypto market remains in the "panic" zone, the recent leverage liquidations are indeed a precursor to medium- to long-term strengthening, laying the foundation for further increases in the first quarter of 2026.
免责声明:本文章仅代表作者个人观点,不代表本平台的立场和观点。本文章仅供信息分享,不构成对任何人的任何投资建议。用户与作者之间的任何争议,与本平台无关。如网页中刊载的文章或图片涉及侵权,请提供相关的权利证明和身份证明发送邮件到support@aicoin.com,本平台相关工作人员将会进行核查。


