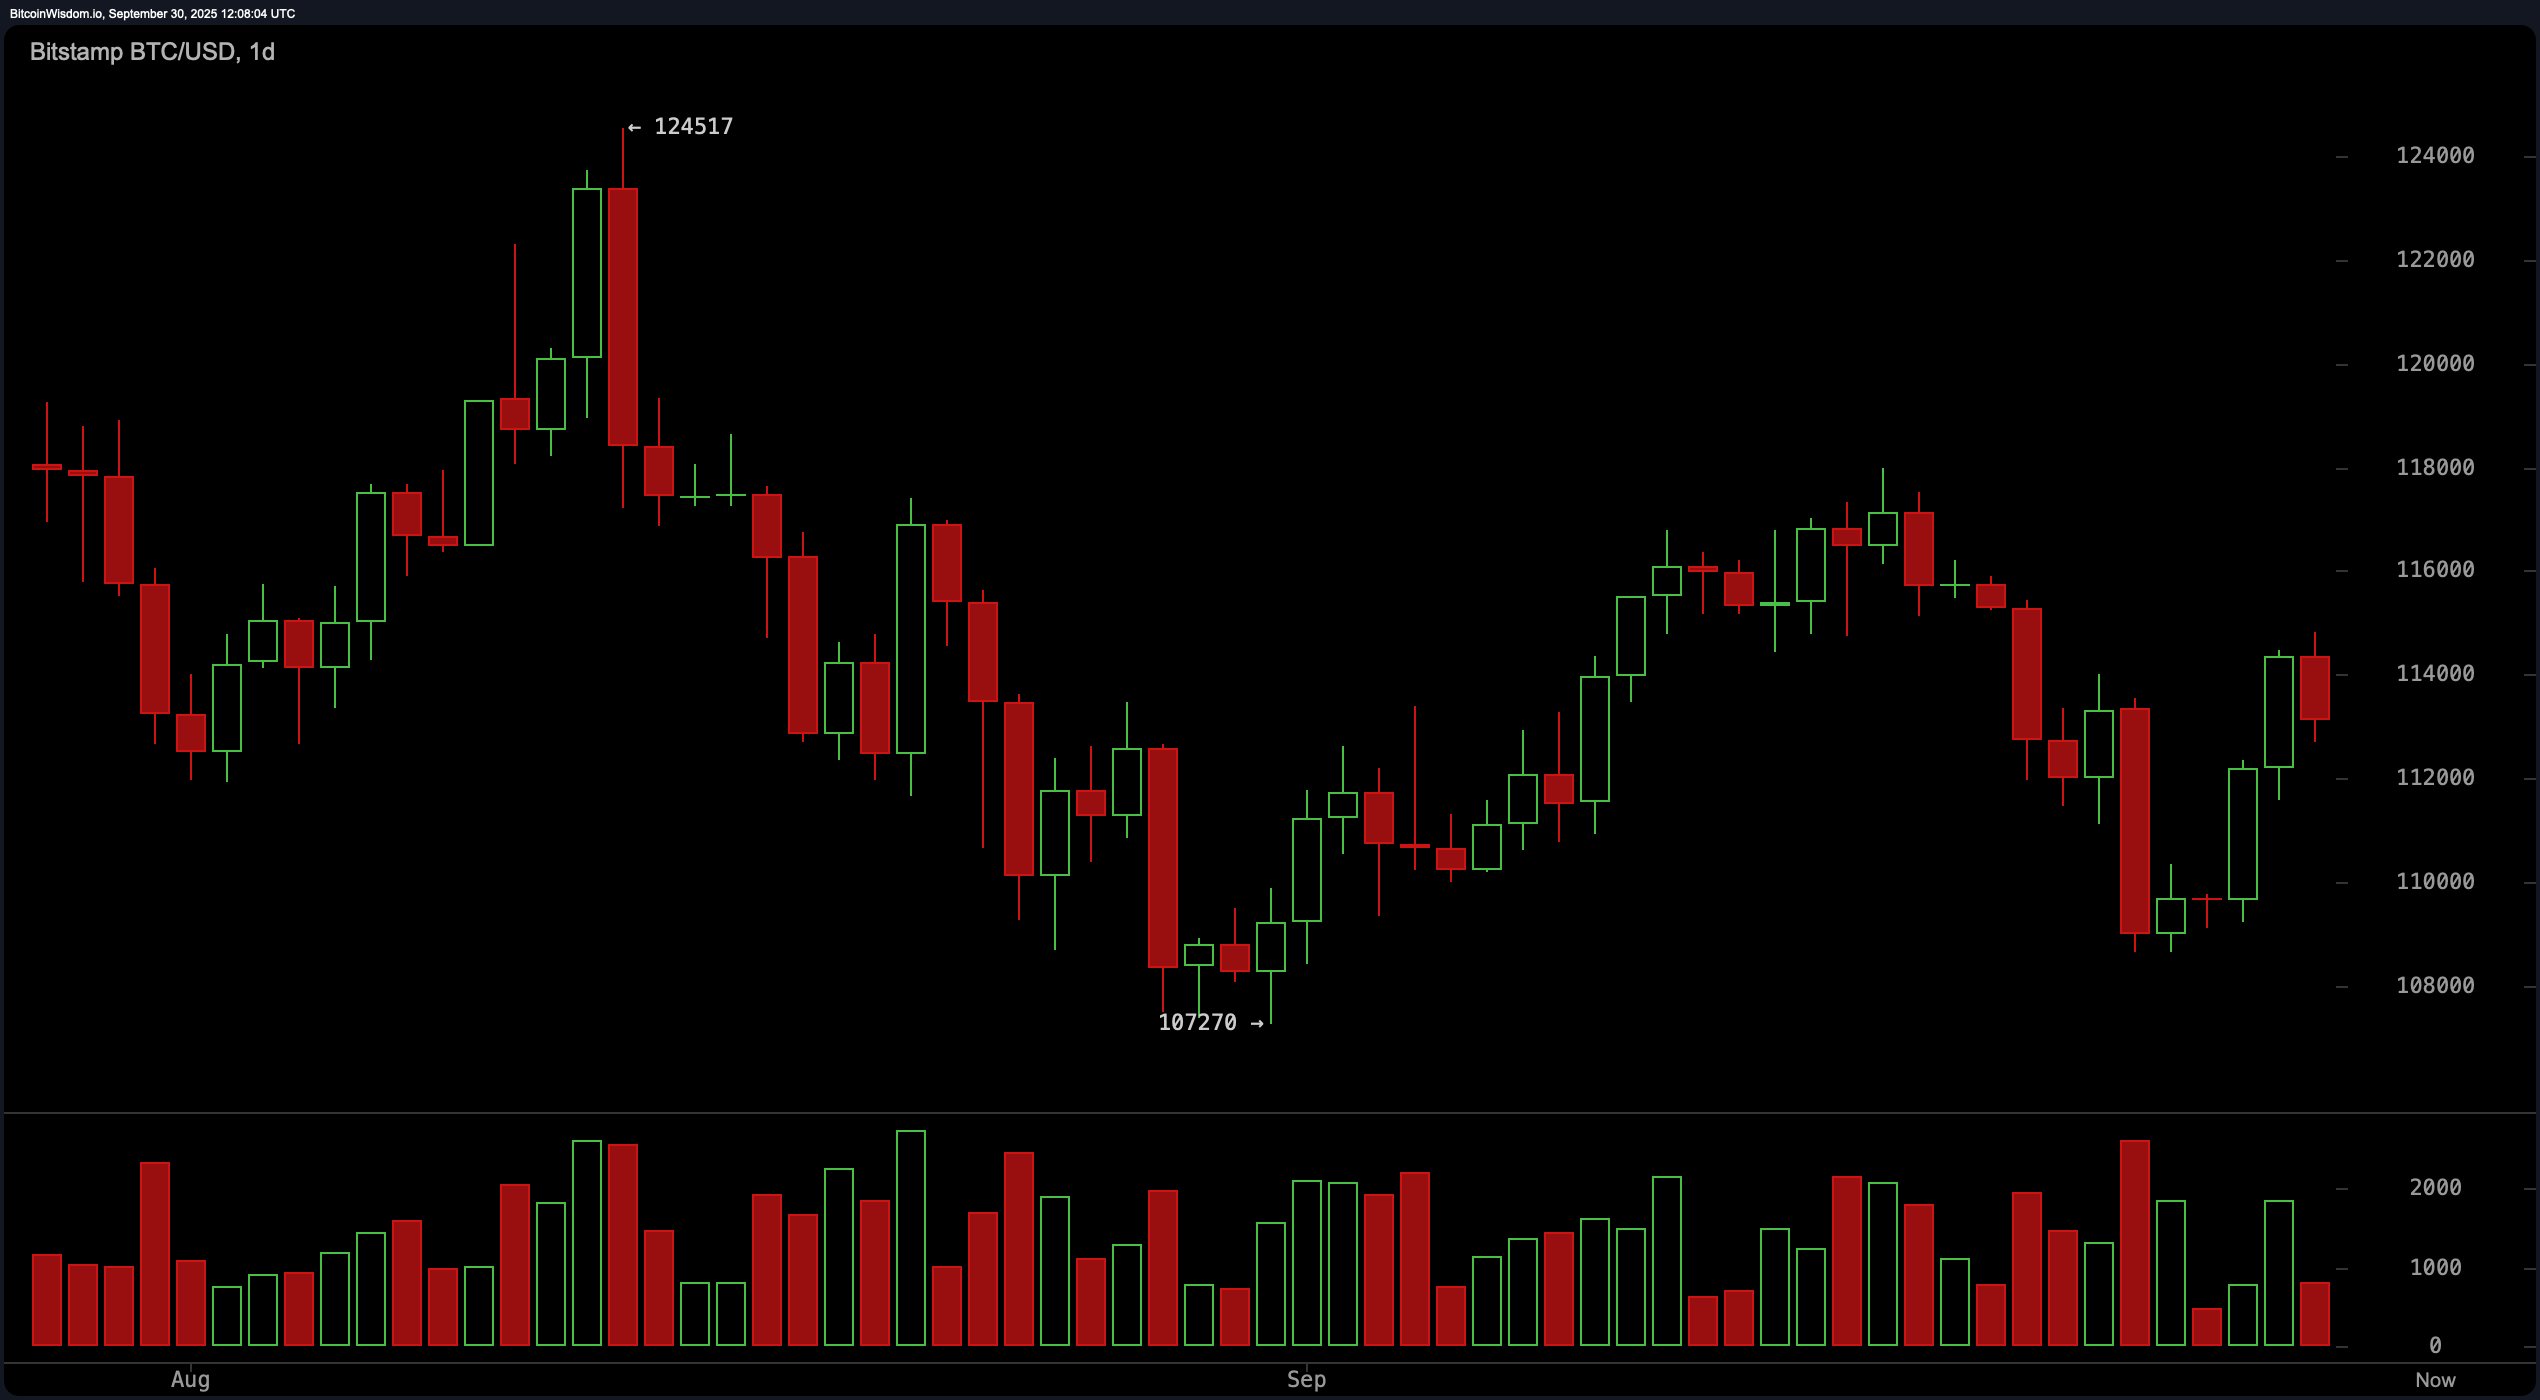
On the daily chart, bitcoin is doing a high-wire act after a dramatic plunge from its $124,517 peak to $107,270. It’s since staged a comeback and is now floating above $114,000, clinging to the support zone around $108,000–$110,000 like it’s a safety net.
Resistance is camped out around $118,000–$120,000, waiting to play spoiler if buyers get too cocky. Traders with ice in their veins may want to eye entries in the $111,000–$112,000 dip zone, targeting exits near that $120K psychological barrier—provided the bulls don’t get lazy.

BTC/USD 1-day chart via Bitstamp on Sept. 30, 2025.
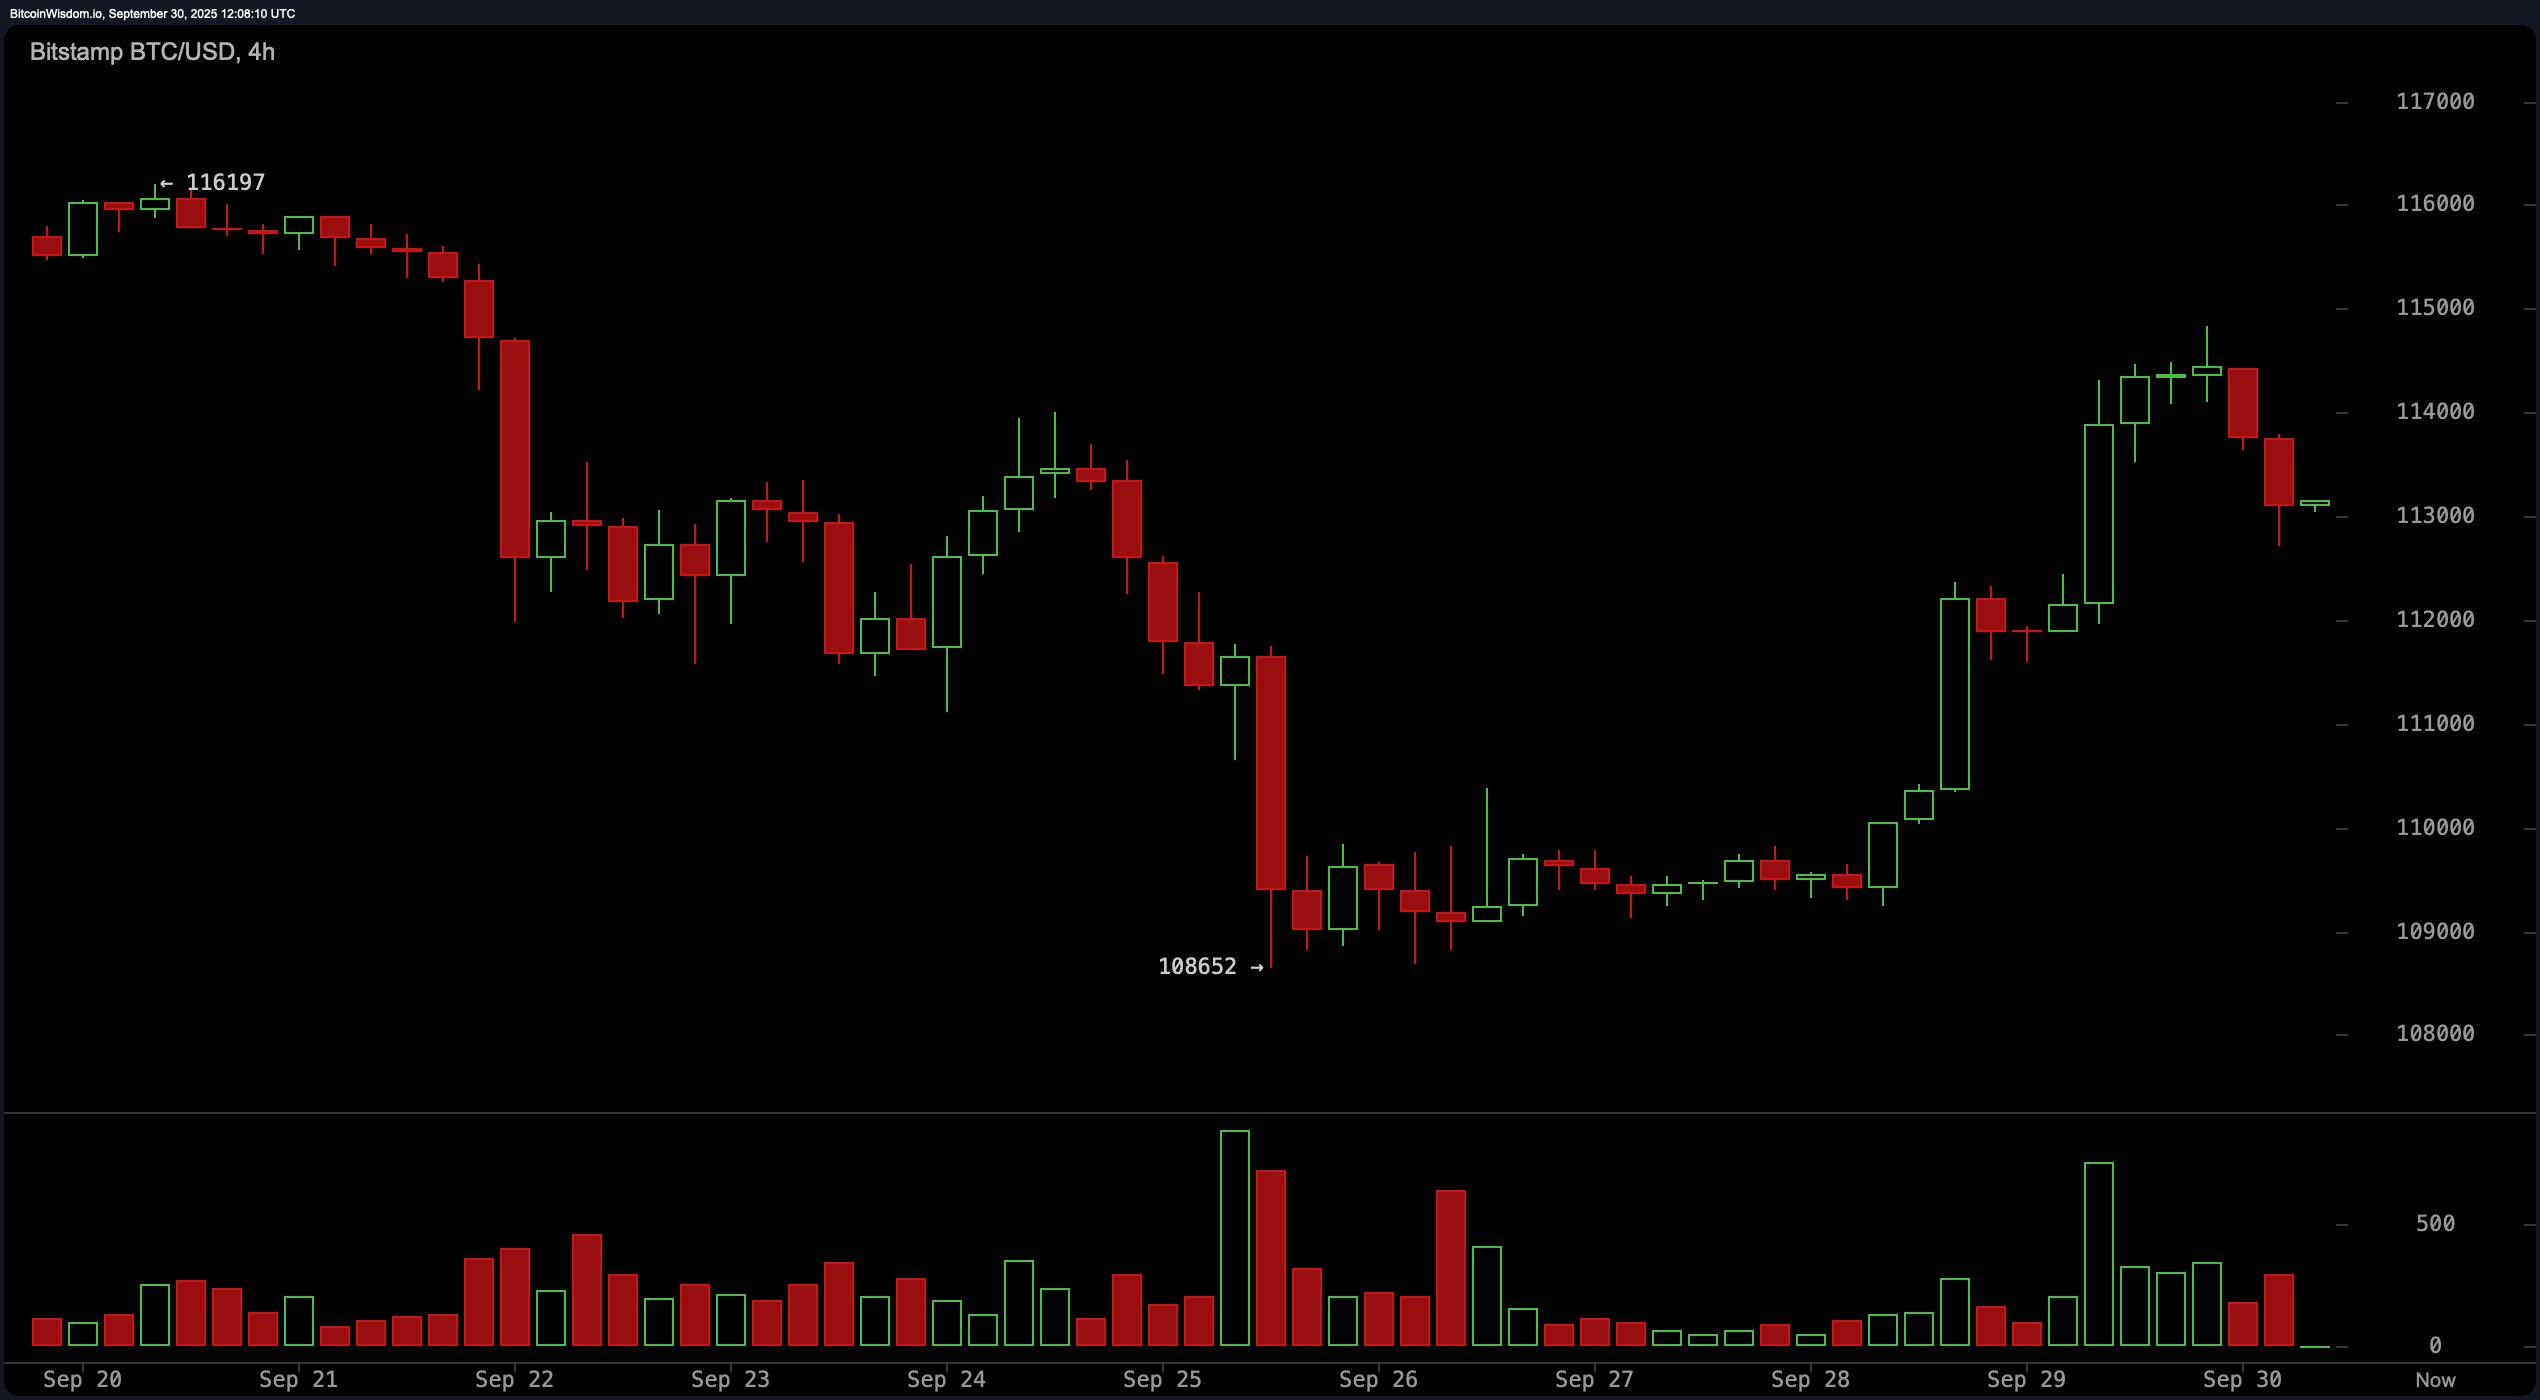
On the 4-hour chart, bitcoin staged a handsome rebound from $108,652 to nearly $115,000. Since then, price action has been churning in the $113,000 neighborhood, suggesting the market is flirting with consolidation more than commitment. Volume did spike during the recovery, a solid tell that buyers are not ghosting yet—but those shrinking candles are whispering, not shouting. A tactical long entry near $112,000–$113,000 with exits at $115,500–$116,000 looks juicy, though any break below $111,000 spells trouble faster than you can say “double top.”

BTC/USD 4-hour chart via Bitstamp on Sept. 30, 2025.
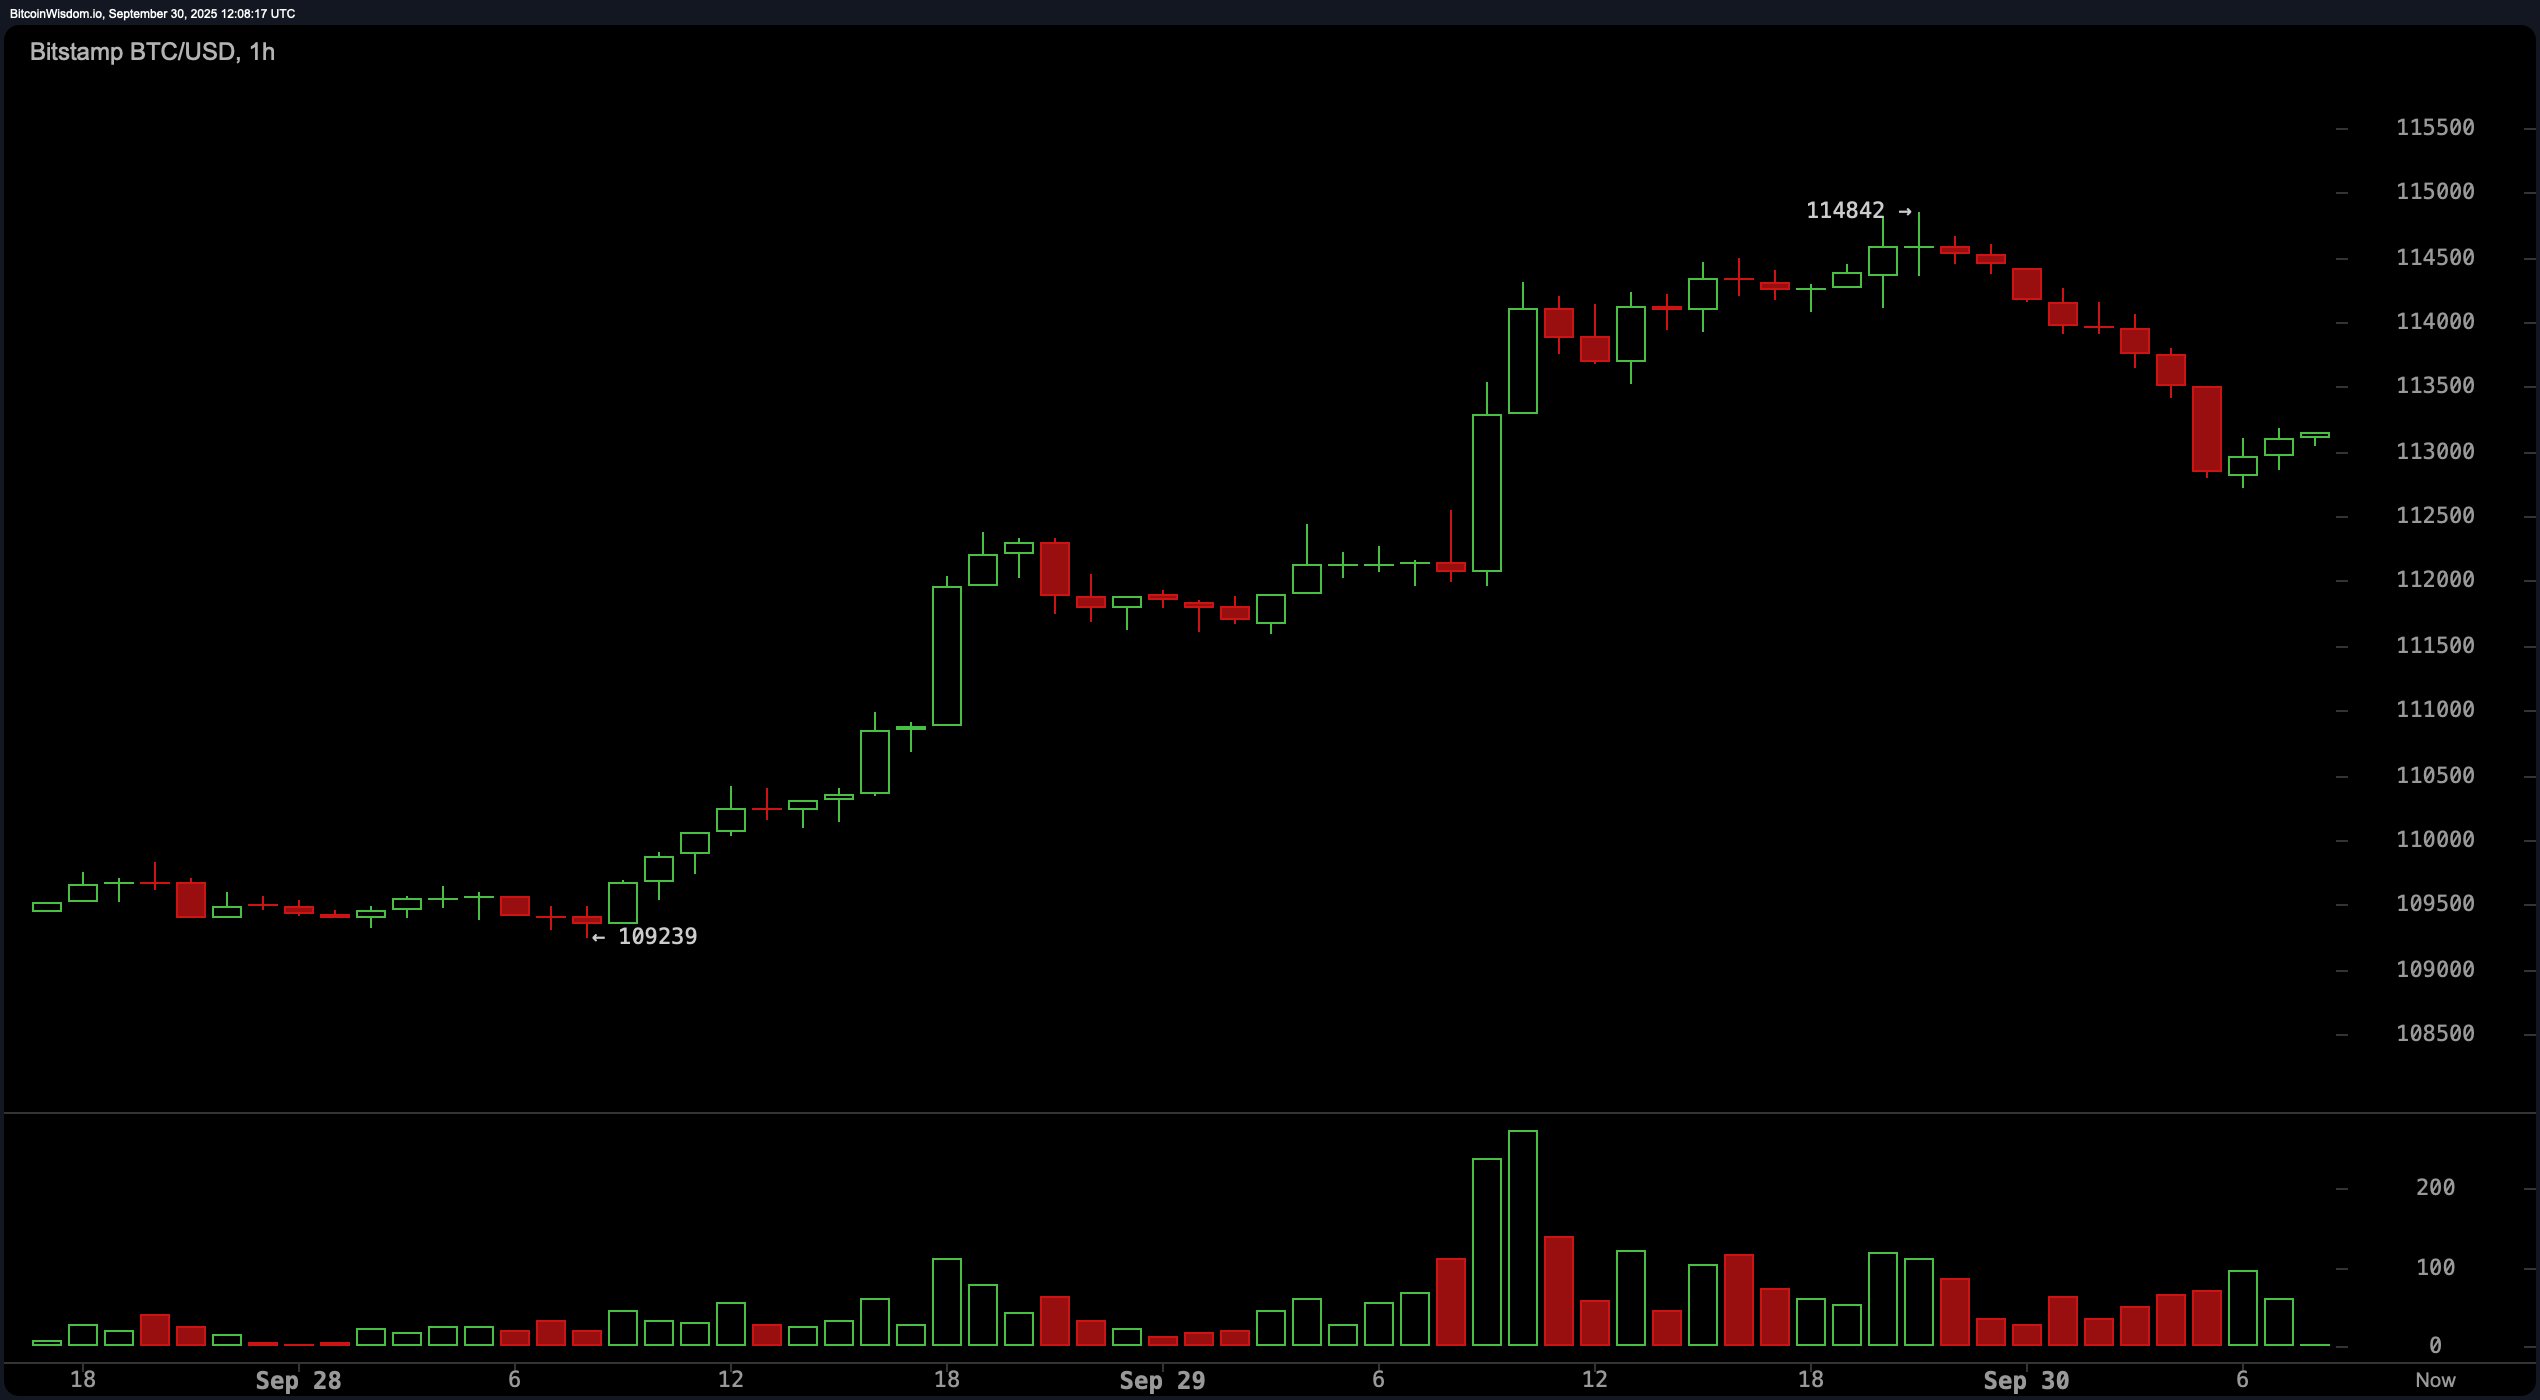
Zooming into the 1-hour chart, bitcoin dipped to $109,239 before getting its groove back at $114,842, and it’s now cooling its heels around $113,000. The momentum has lost a bit of its swagger, but it’s not in panic mode either. Entries between $112,800 and $113,200 remain viable for scalpers aiming at $114,500–$115,000, but a flush below $112,500 could crack open a downside ride straight to $111,000.

BTC/USD 1-hour chart via Bitstamp on Sept. 30, 2025.
Now let’s talk oscillators—because every good trader knows the indicators throw more shade than a crypto Twitter feud. The relative strength index (RSI), Stochastic oscillator, commodity channel index (CCI), average directional index (ADX), and the Awesome oscillator are all yelling “neutral,” like a panel of undecided jurors. But momentum and the moving average convergence divergence (MACD) aren’t pulling punches—they’re flashing bearish signals, with momentum dragging at -2,643 and the MACD level lagging at -419. These bearish cues could mean the bulls are out of breath, or just pacing themselves before the next leg up.
And the moving averages? It’s a messy kitchen. The 10-day exponential moving average (EMA) and simple moving average (SMA) are both pointing to positivity, but the 20-day to 100-day crew is as split as a DAO vote gone wrong. The 20-day EMA indicates a bullish trend while the 20-day SMA is bearish. The 30-day and 50-day averages are mostly bearish, with both EMAs and SMAs signaling a negative trend. Only the 100-day EMA and both 200-day averages lean bullish, suggesting long-term holders may still have the upper hand—unless short-term volatility has other plans.
Bottom line: as long as bitcoin holds above $111,000, the bullish bias remains intact with targets in the $115,000–$118,000 range. But lose that critical level with conviction, and the sell-off could head straight for $108,000. This market may not be for the faint of heart, but it sure is entertaining.
Bull Verdict:
If bitcoin stays above $111,000 and buyers keep trickling in, we’re looking at a potential grind higher toward $118,000. Momentum may be lagging, but as long as the support holds, the bulls have every reason to stay in the arena—cautiously optimistic, but still swinging.
Bear Verdict:
Should bitcoin tumble below $111,000 with volume to back it up, the stage is set for a deeper correction toward $108,000. With momentum indicators and several key moving averages leaning bearish, the bears may soon reclaim the mic—this rally could just be a well-dressed pause before another leg down.
免责声明:本文章仅代表作者个人观点,不代表本平台的立场和观点。本文章仅供信息分享,不构成对任何人的任何投资建议。用户与作者之间的任何争议,与本平台无关。如网页中刊载的文章或图片涉及侵权,请提供相关的权利证明和身份证明发送邮件到support@aicoin.com,本平台相关工作人员将会进行核查。


