Despite potential fluctuations in the short term, Ethereum has not yet reached the peak of this cycle, and its long-term upward trend remains solid.
Written by: Michael Nadeau
Compiled and organized by: BitpushNews
In the past two months, various "treasury companies" have acquired over 3.4 million ETH. At current market prices, this amounts to $14.6 billion.
Capital rotation is manifesting across markets. Bitcoin's dominance has dropped from 65% to 57%. Meanwhile, ETH has risen by 81% (up 171% from the April low).
But these are now sights in the rearview mirror. Now, we need to look forward.
This article will share some on-chain data updates while looking ahead to ETH's next moves.
Let's get started.
ETH Compared to BTC
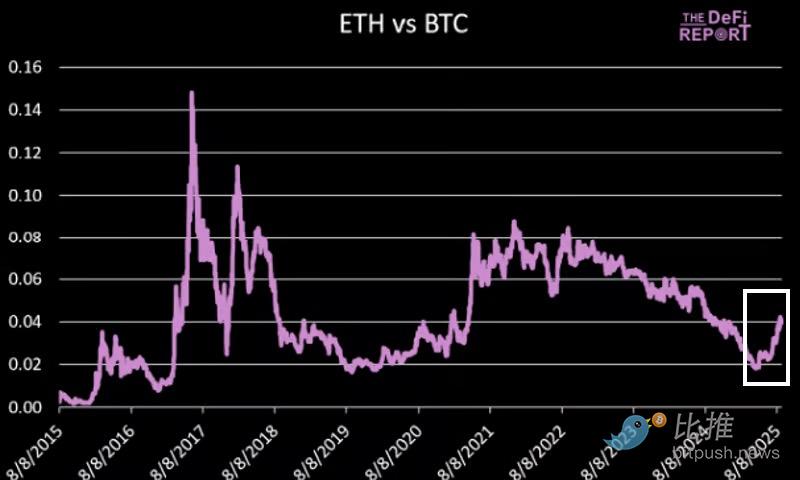
Data Source: The DeFi Report
As mentioned in the introduction, liquidity has been flowing into ETH through "treasury" companies.
It is also flowing in through ETFs…
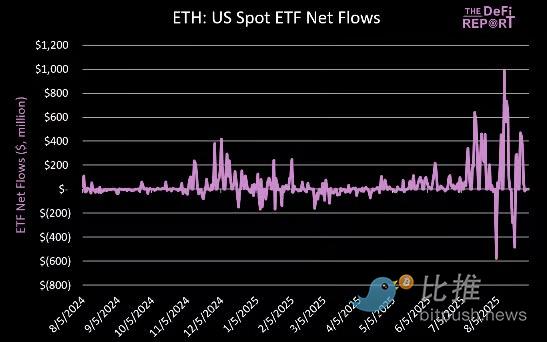
ETFs
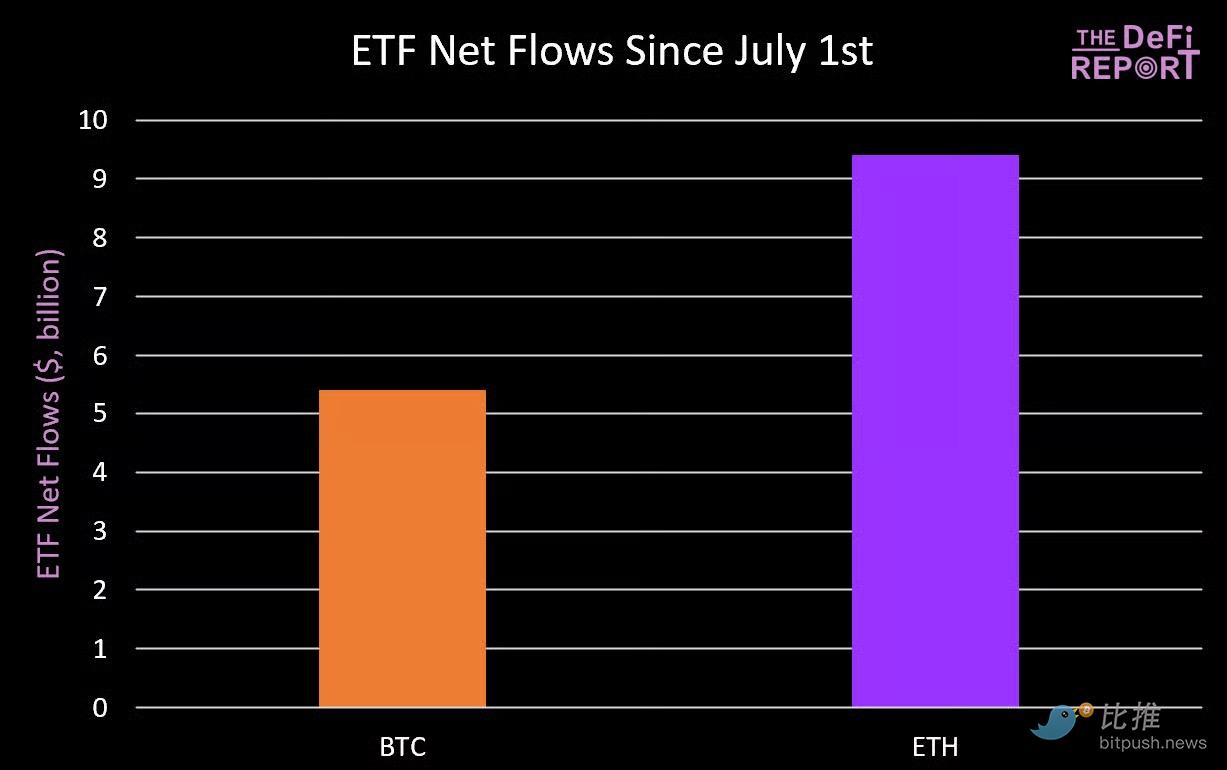
Since July 1, net inflows into ETH have exceeded $9.4 billion—an astonishing figure for such a short time.
These inflows have placed ETH ETFs among the top ten in total assets across all ETFs—indicating that the level of institutional demand has reached a level typically seen only in top stocks and bond ETFs.
In total, ETH ETFs have seen nearly $14 billion in net inflows and manage $29 billion in assets. They collectively hold 5.4% of the total ETH supply.
During the same period, BTC's net inflows were $5.4 billion.
Data Source: The DeFi Report, Glassnode
Investors are rotating into ETH. We believe this trend will continue.
But it won't be a straight line (more on this later).
Open Interest in Options
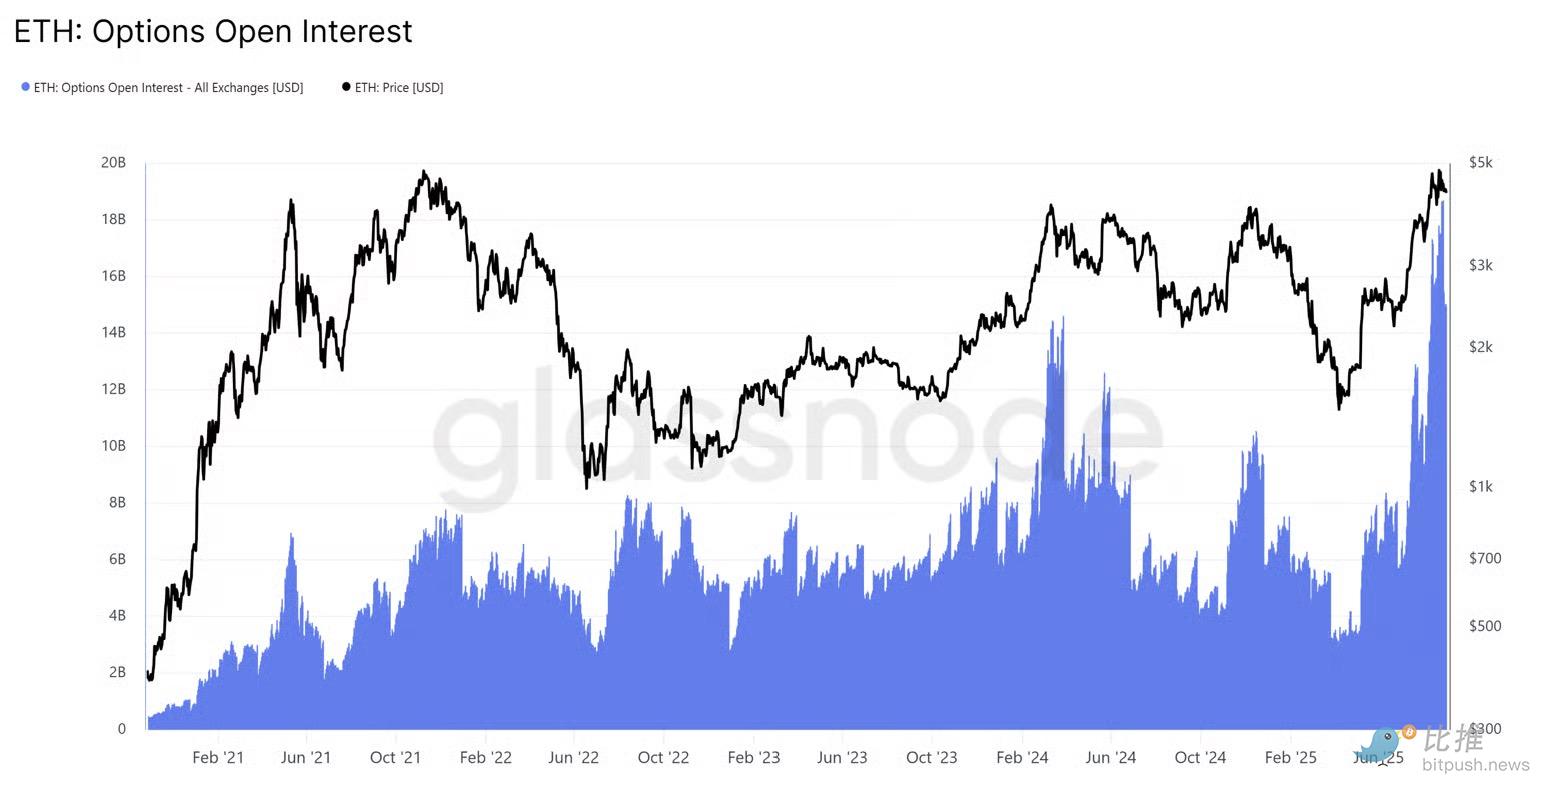
Data Source: Glassnode
To further demonstrate where investor interest and risk appetite are shifting, the current open interest in ETH options has surpassed $15 billion, just slightly below its all-time high.
In the past two months alone, this figure has increased by 158%. We believe a significant portion of this is institutions hedging their ETF risk exposure.
For reference, BTC's open interest currently stands at $44 billion, down from the historical high of $54 billion set in mid-August.
Validator Queue
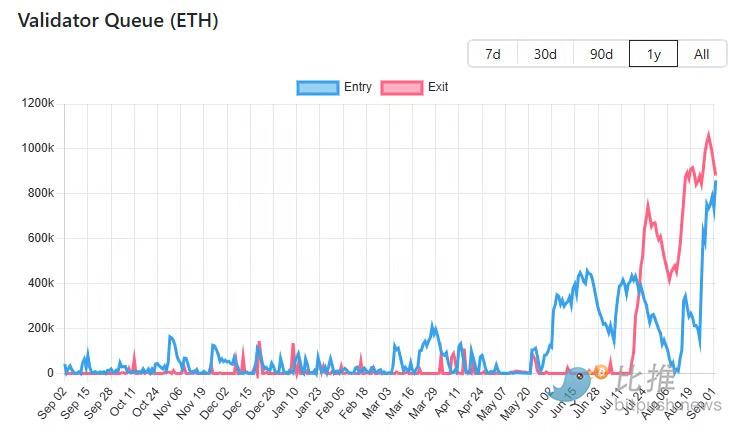
Data Source: validatorqueue
Currently, 927,000 ETH are waiting to exit the staking queue (worth $4 billion).
Given that ETH has risen by 81% over the past few months and rebounded 171% from the April low, this is not surprising.
At the same time, there are now 787,000 ETH (worth $3.4 billion) entering the validator queue (likely staked by ETH treasury companies to earn yields).
How much of the ETH exiting will likely be sold?
It's hard to say. Many staked ETH are held in cryptocurrency exchanges like Coinbase, Binance, and Kraken. This movement may partly stem from operations in a bull market. Of course, some of it may also be sold.
As this reshuffling occurs, we may see some volatility in ETH prices (along with some panic, uncertainty, and doubt, or FUD, on crypto Twitter).
DeFi: Active Loans
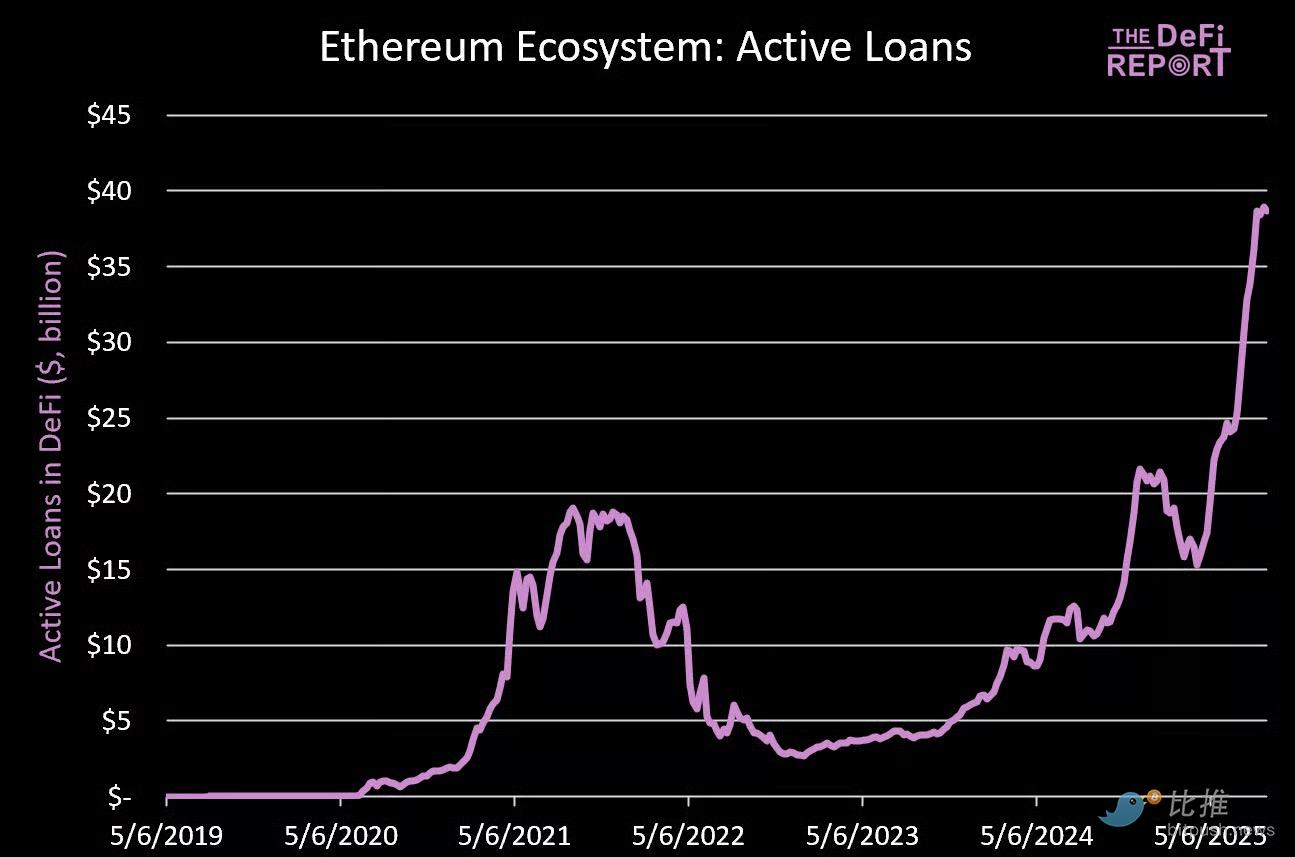
Data Source: The DeFi Report, Token Terminal
With the total amount of active loans nearing $40 billion, Ethereum DeFi remains vibrant.
The vast majority (71%) comes from Aave.
Based on its total assets under management / total value locked (TVL), Aave could rank 38th among all banks in the U.S.
DEX (Decentralized Exchange) Trading Volume
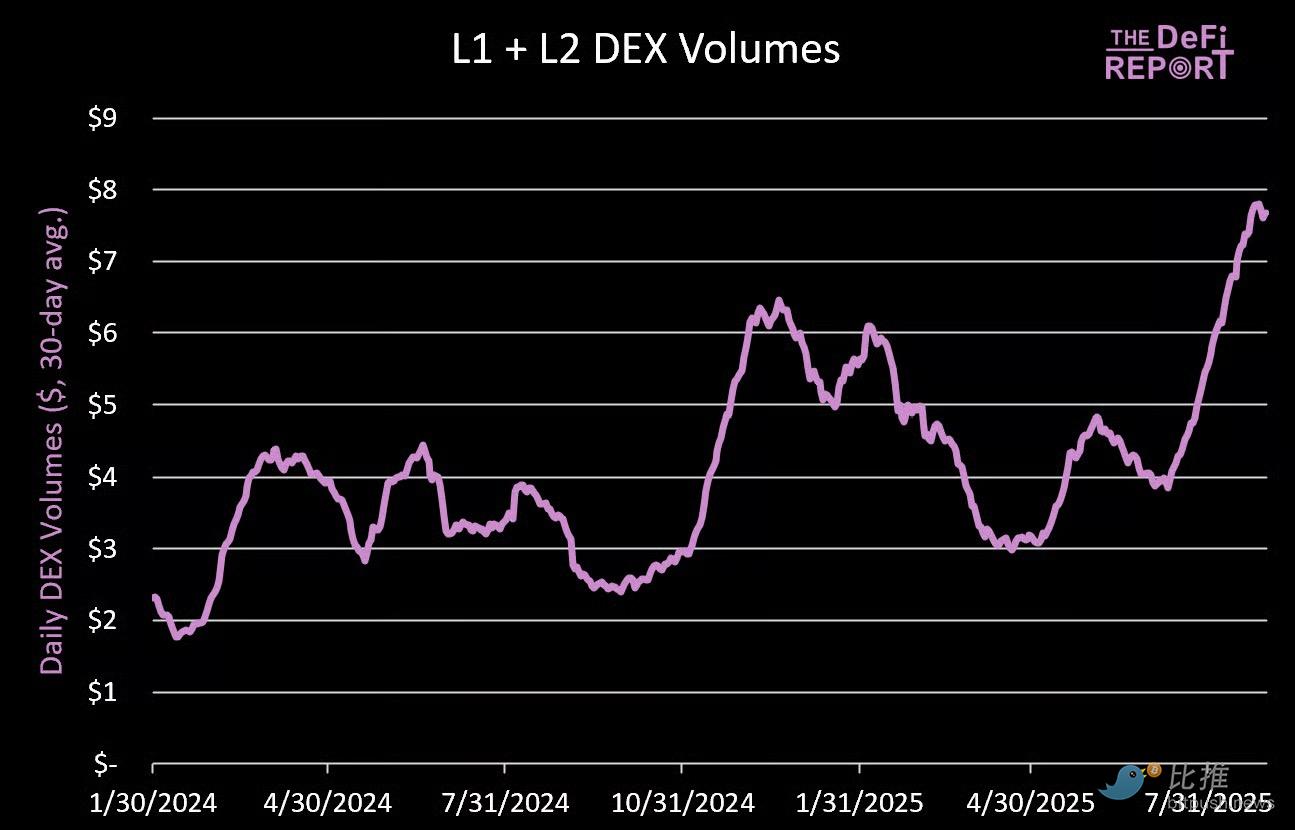
Data Source: The DeFi Report
Average daily DEX trading volume has increased by 266% from the April low, with L1 (Layer 1) mainnet contributing about 67% of the trading volume.
L1 Transaction Fees
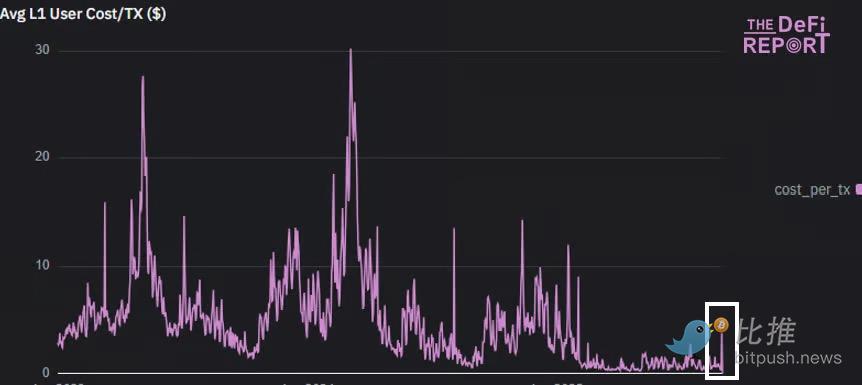
Data Source: The DeFi Report
With the rise of DeFi activity, average transaction fees on L1 have surged for the first time since the fourth quarter of last year.
A reflexive flywheel is starting: price increase → increase in on-chain activity → improvement in fundamentals (demand for block space and higher transaction fees) → price increase → increase in on-chain activity.
Long-Term Holders' Unrealized Net Profit and Loss
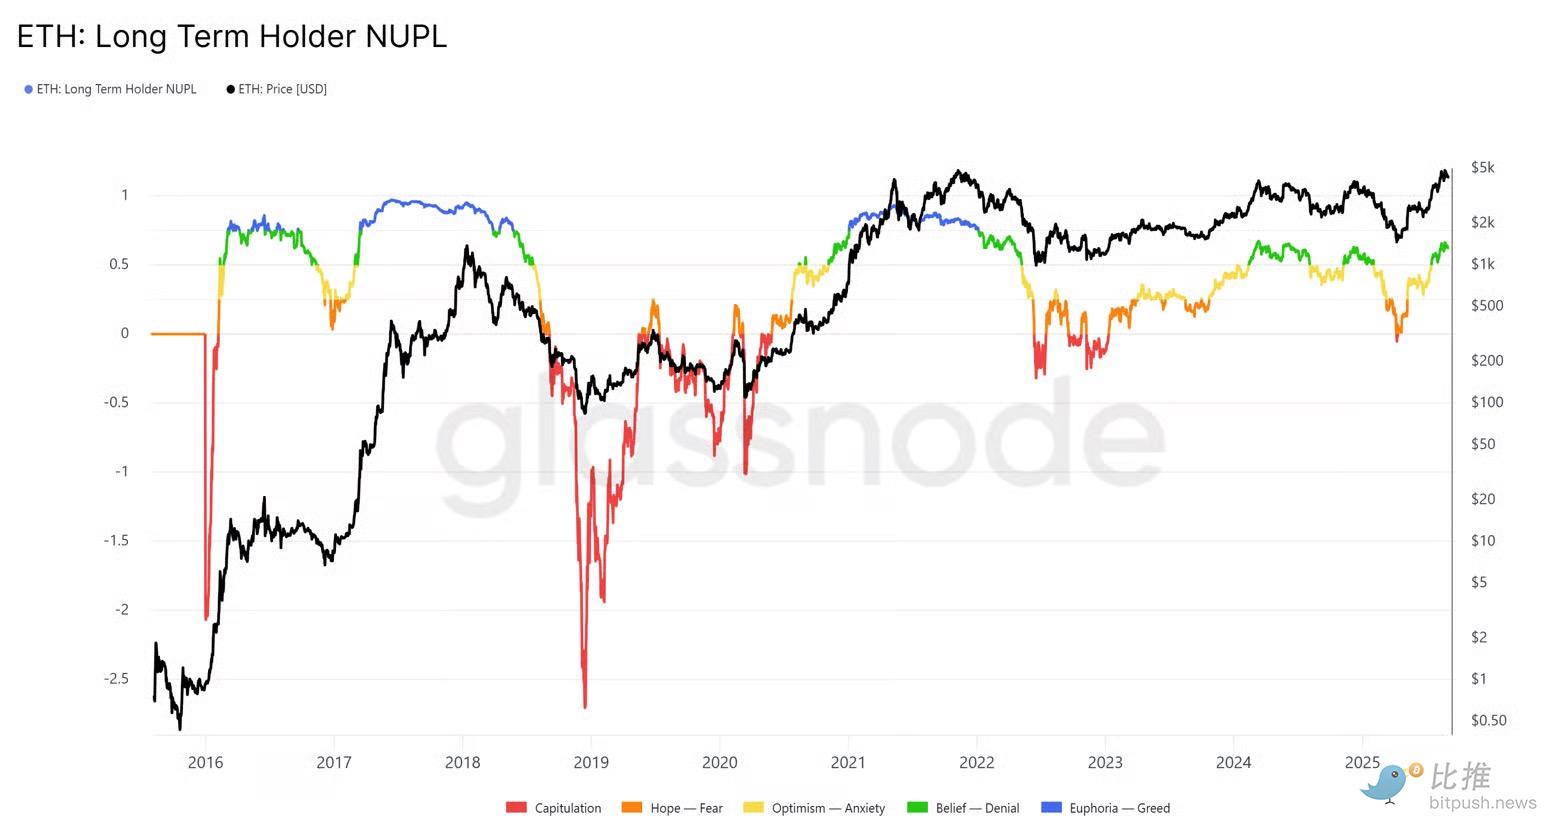
Data Source: Glassnode
In terms of unrealized net profit and loss for long-term holders, ETH has not yet reached the extreme levels we have seen in past cycles (blue area).
Market Cap to Realized Value Ratio (MVRV)
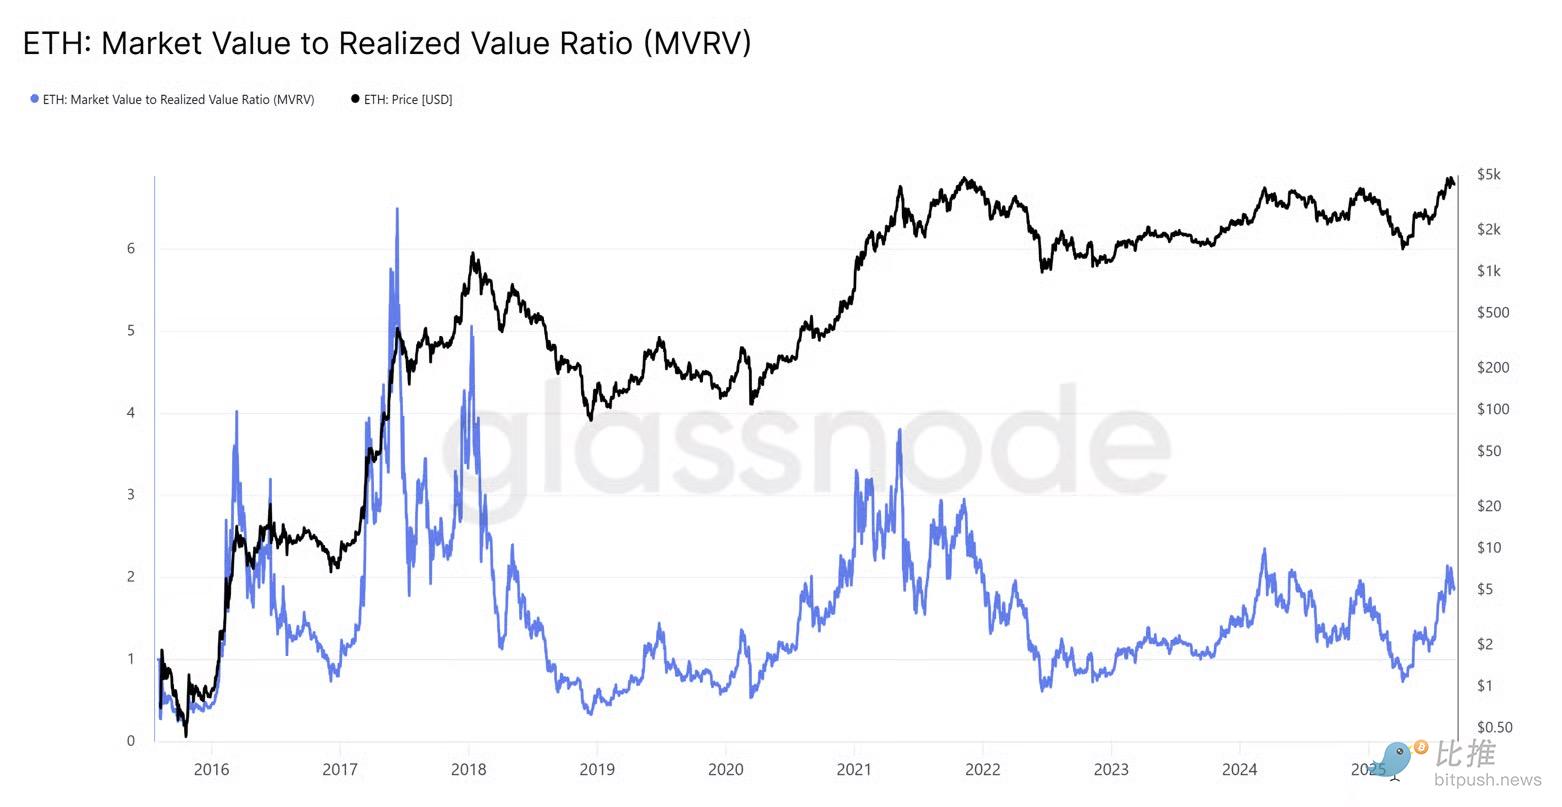
Data Source: Glassnode
The realized price represents the average cost basis of ETH's circulating supply. It is currently $2,300.
When the market cap significantly diverges from the realized value, it is a sign that the market is overheating.
The current reading is 1.87. This indicates that, on average, ETH holders are enjoying an unrealized profit of 87%.
MVRV reached as high as 2.2 in the first quarter of last year and 3.8 during the 2021 cycle.
* Please note that this data only captures on-chain ETH (excluding ETFs and ETH held on exchanges).
Where do we go from here?
Based on all the on-chain data, our core conclusion is: despite potential fluctuations in the short term, Ethereum has not yet reached the peak of this cycle, and its long-term upward trend remains solid.
免责声明:本文章仅代表作者个人观点,不代表本平台的立场和观点。本文章仅供信息分享,不构成对任何人的任何投资建议。用户与作者之间的任何争议,与本平台无关。如网页中刊载的文章或图片涉及侵权,请提供相关的权利证明和身份证明发送邮件到support@aicoin.com,本平台相关工作人员将会进行核查。


