As of June 30, the open interest in perpetual futures was $108.922 billion, an increase of $29.2 billion (+36.66%) compared to the end of the first quarter.
Written by: Zack Pokorny, Galaxy
Translated by: AididiaoJP, Foresight News
Introduction
The leverage in the cryptocurrency market rebounded in the second quarter, following a decline in both cryptocurrency-backed loans and the futures market in the first quarter. After the market volatility on "Liberation Day" in early April, optimism towards cryptocurrencies was reignited, and the rise in asset prices also fueled the expansion of leverage in the second quarter. Notably, on-chain cryptocurrency collateralized loans grew by 42% during this period, reaching a historical high of $26.5 billion.
Digital Asset Reserve Companies (DATCOs) remained a core topic in the second quarter. However, these companies overly relied on non-debt strategies to drive asset purchases, resulting in their debt balances remaining unchanged compared to the previous quarter.
This article tracks the leverage trends in cryptocurrency collateralized loans on DeFi and CeFi platforms, publicly traded reserve companies, and the cryptocurrency futures market, while also introducing new participants in CeFi and DeFi lending platforms and the futures market.
Key Points
As of June 30, Galaxy Research tracked CeFi outstanding loans at $17.78 billion. This figure increased by 14.66% ($2.27 billion) quarter-over-quarter and has grown by $10.59 billion (+147.5%) since the bear market low of $7.18 billion in Q4 2023.
The outstanding loans in DeFi applications, denominated in USD, rebounded strongly from the first quarter, increasing by $7.84 billion (+42.11%) to reach $26.47 billion, setting a new historical high.
Digital Asset Reserve Companies (DATCOs) remained a core theme in the second quarter. The rise of Ethereum reserve companies from March to June became a significant trend in the DATCOs space, while such entities were not common in the first few months of the year.
Due to Bitcoin DATCOs not issuing new debt, the outstanding debt balance of traceable reserve companies remained unchanged. Nevertheless, June 2028 is still a month to watch, as $3.65 billion of outstanding debt will mature.
The open interest in futures (including perpetual futures) saw significant growth in the second quarter. As of June 30, the total open interest in futures on major platforms was $132.6 billion.
As of June 30, the open interest in perpetual futures was $108.922 billion, an increase of $29.2 billion (+36.66%) compared to the end of the first quarter.
Cryptocurrency Lending
The following showcases the main participants in the CeFi and DeFi cryptocurrency lending markets. With the sharp decline in cryptocurrency asset prices and liquidity exhaustion, some large CeFi lending institutions, measured by loan size, collapsed in 2022 and 2023. These lending institutions are marked with red warning points. Since the last Galaxy cryptocurrency leverage report, we have added 5 DeFi applications, 1 CeFi lending institution, and 1 collateralized debt position (CDP) stablecoin.
The newly added DeFi applications include:
Fraxlend (Ethereum, Fraxtal, and Arbitrum)
Curve Llamalend (Ethereum, Arbitrum, Fraxtal, and OP Mainnet)
Lista (BSC)
Hyperlend (HyperEVM)
Venus (BSC, Ethereum, Unichain, Arbitrum, zkSync Era, Base, OP Mainnet, and opBNB)
Existing applications expanding chain coverage include:
Echelon (Echelon Chain)
Save (Eclipse)
Euler (Arbitrum)
Kamino (13 new markets)
Dolomite (Ethereum)
The newly added collateralized debt position (CDP) stablecoin includes:
- Felix (HyperEVM native)
The newly added CeFi lending institutions include:
Figure Markets
Nexo
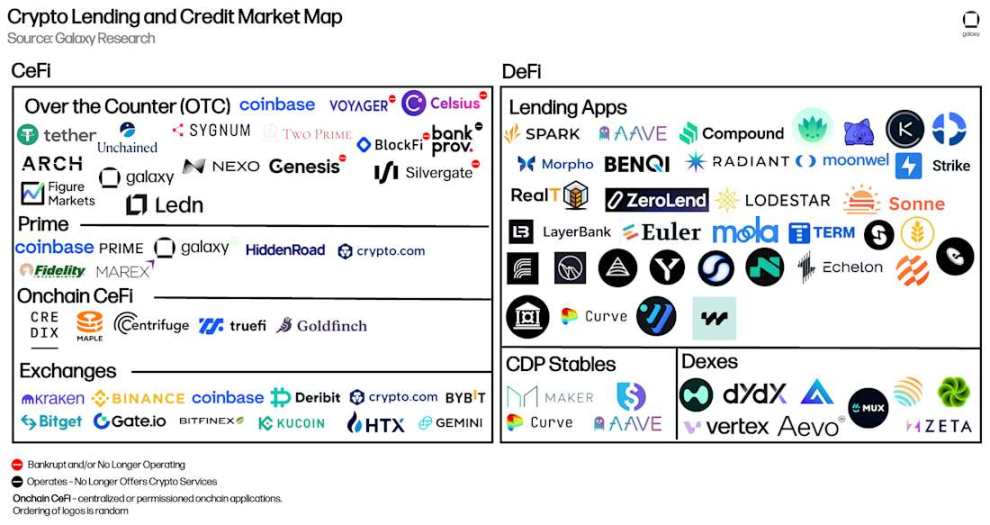
Cryptocurrency Lending and Credit Market Map
CeFi
The table below compares CeFi cryptocurrency lending institutions in market analysis. Some companies offer multiple services to investors. For example, Coinbase primarily operates as an exchange but also provides credit to investors through over-the-counter cryptocurrency loans and margin financing. However, the analysis only covers the scale of its cryptocurrency collateralized loans.
This is Figure Markets' first participation in this report. Figure is a top player in the on-chain credit space, with $11.1 billion in private credit and home equity lines of credit (HELOCs). Additionally, the company offers Bitcoin-backed loan products, and the relevant data has been included in the table below. Although Figure's Bitcoin loan products have been available since April 2024, the company has only recently begun incentivizing their use.
Nexo also participated in the report for the first time this quarter. This lending institution has been operating since 2018 and currently serves only non-U.S. customers. The company recently announced plans to re-enter the U.S. market.
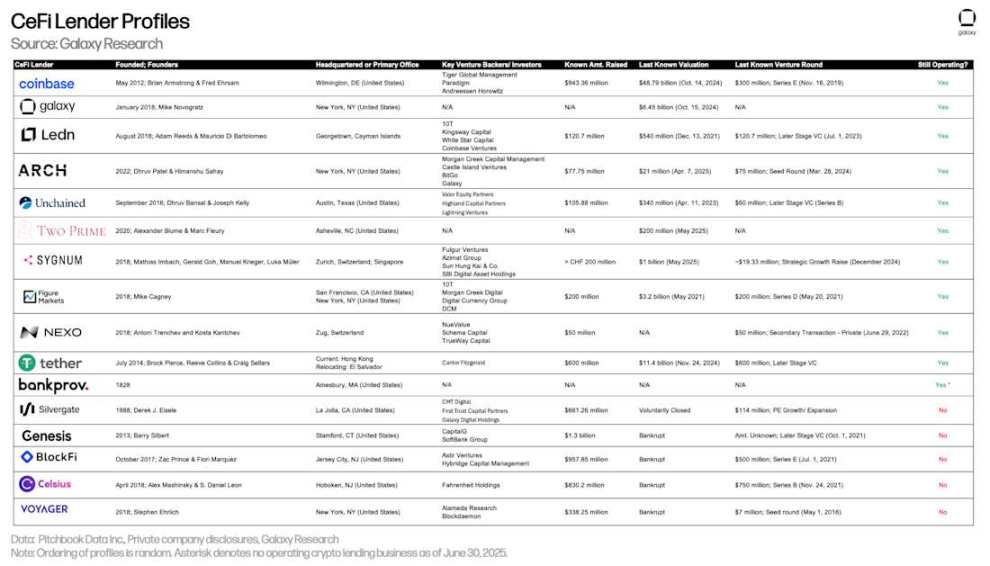
CeFi Cryptocurrency Lending Institution Overview
As of June 30, Galaxy Research tracked CeFi outstanding loans at $17.78 billion. This figure increased by 14.66% ($2.27 billion) quarter-over-quarter and has grown by $10.59 billion (+147.5%) since the bear market low of $7.18 billion in Q4 2023.
Galaxy Research believes that the growth in the CeFi lending space is primarily driven by the following factors:
The reflexive relationship between lending activity and price increases; as prices rise, lending activity typically increases. This applies to both DeFi and CeFi lending.
Increased competition may begin to reflect in lending costs. More competition means better cost control, leading to larger-scale lending activities in the market at more attractive rates.
Reserve companies have started to finance through CeFi lending institutions, representing a significant new source of demand.
Due to adjustments in loan issuance strategies, Ledn has fallen out of the top three in outstanding loan size. In the second quarter, Ledn decided to fully commit to Bitcoin-backed loans, discontinuing yield products and Ethereum-related products. This decision led to a historical high in Ledn's Bitcoin-backed loan issuance. However, due to the cancellation of institutional loans (from discontinued Bitcoin and Ethereum yield products), its overall loan size decreased compared to the first quarter. It is worth noting that as of the end of the second quarter, 100% of the loans reported by Ledn were USD-denominated, with 99% being Bitcoin-backed loans and 1% being legacy Ethereum-backed loans, which will gradually phase out.
Tether, Nexo, and Galaxy are the top three lending institutions tracked by Galaxy Research in terms of outstanding loan value. As of June 30, Tether's outstanding loans were $10.14 billion, Nexo's were $1.96 billion, and Galaxy's were $1.11 billion.
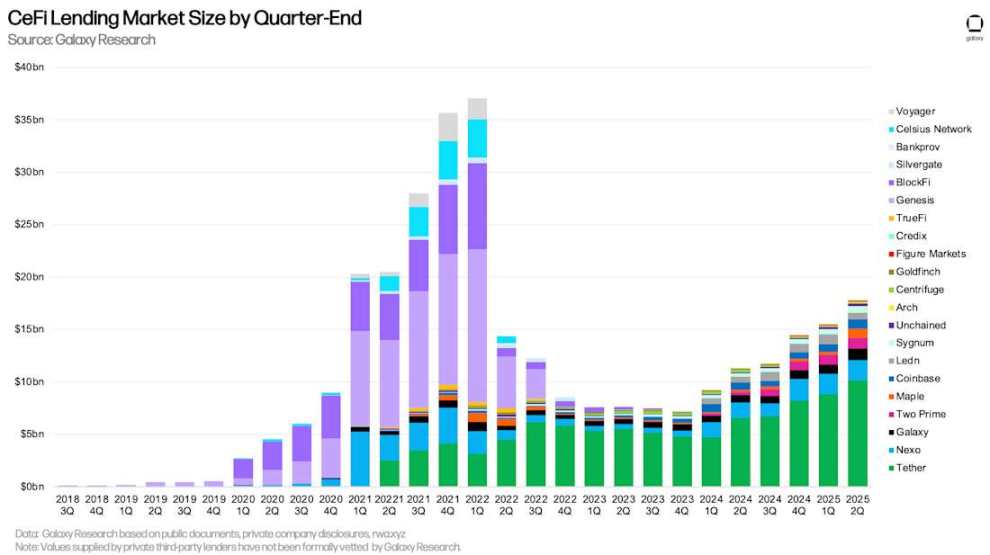
CeFi Cryptocurrency Lending Market Size at Quarter-End
Tether dominates our analysis with a market share of 57.02%. Together with Nexo (11.01%) and Galaxy (6.23%), the top three CeFi lending institutions account for 74.26% of the market share.
When comparing market shares, it is important to note the differences between CeFi lending institutions. Some lending institutions only offer specific types of loans (e.g., only Bitcoin collateralized, altcoin collateralized products, or cash loans excluding stablecoins), serve only specific types of clients (e.g., institutional or retail), or operate only in specific jurisdictions. The combination of these factors makes it easier for some lending institutions to scale.
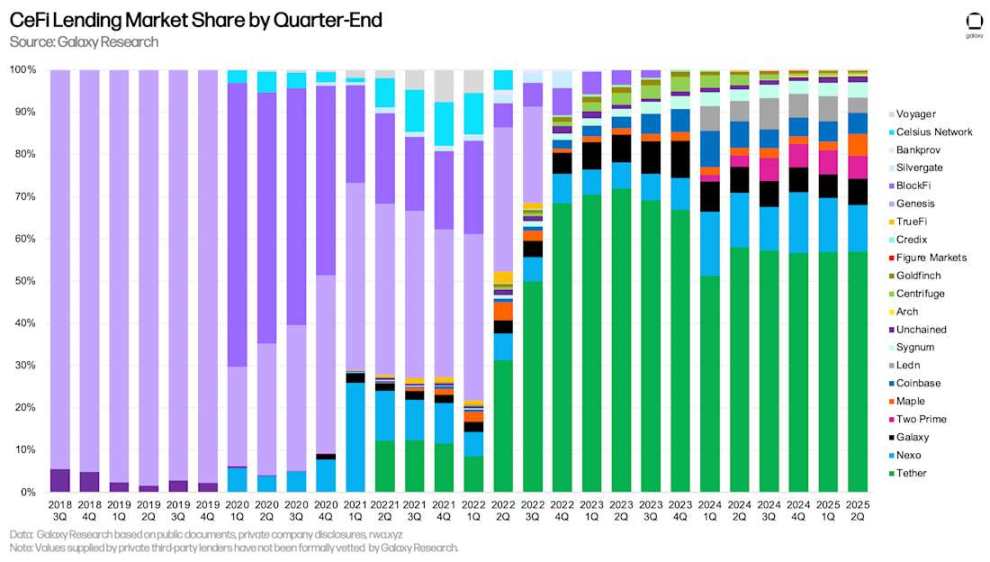
CeFi Lending Market Share at Quarter-End
The table below details Galaxy Research's data sources and the logic behind calculating the loan sizes for each CeFi lending institution. While DeFi and on-chain CeFi loan data can be obtained through transparent on-chain data, acquiring CeFi data is more complex. This is due to inconsistencies in how CeFi lending institutions account for outstanding loans, the frequency of information disclosure, and the difficulty of obtaining this information.
It is important to note that the values provided by third-party private lending institutions have not been formally verified by Galaxy Research.
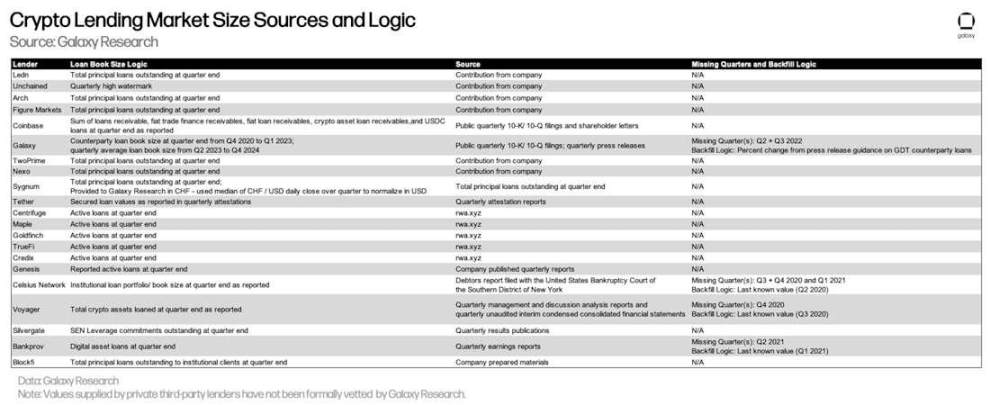
Cryptocurrency Lending Market Size Data Sources and Logic
CeFi vs. DeFi Lending
The outstanding loans in DeFi applications, denominated in USD, rebounded strongly from the first quarter, increasing by $7.84 billion (+42.11%) to reach $26.47 billion, setting a new historical high. When combining DeFi applications with CeFi lending platforms, the total outstanding cryptocurrency collateralized loans at the end of the quarter amounted to $44.25 billion. This figure increased by $10.12 billion (+29.64%) compared to the previous quarter, primarily due to the growth in outstanding loans on DeFi lending platforms. Only in Q4 2021 ($53.44 billion) and Q1 2022 ($48.39 billion) was the outstanding loan size higher than in Q2 2025.
Note: There may be double counting between the total scale of CeFi loans and DeFi borrowings. This is because some CeFi entities rely on DeFi applications to lend to off-chain clients. For example, suppose a CeFi lending institution uses its idle Bitcoin as collateral to borrow USDC on-chain and then lends the USDC to off-chain borrowers. In this case, the on-chain borrowing of that CeFi lending institution will appear in both DeFi outstanding borrowings and its financial statements (as outstanding loans to clients). Due to a lack of disclosure or on-chain attribution information, it is difficult to filter this out.
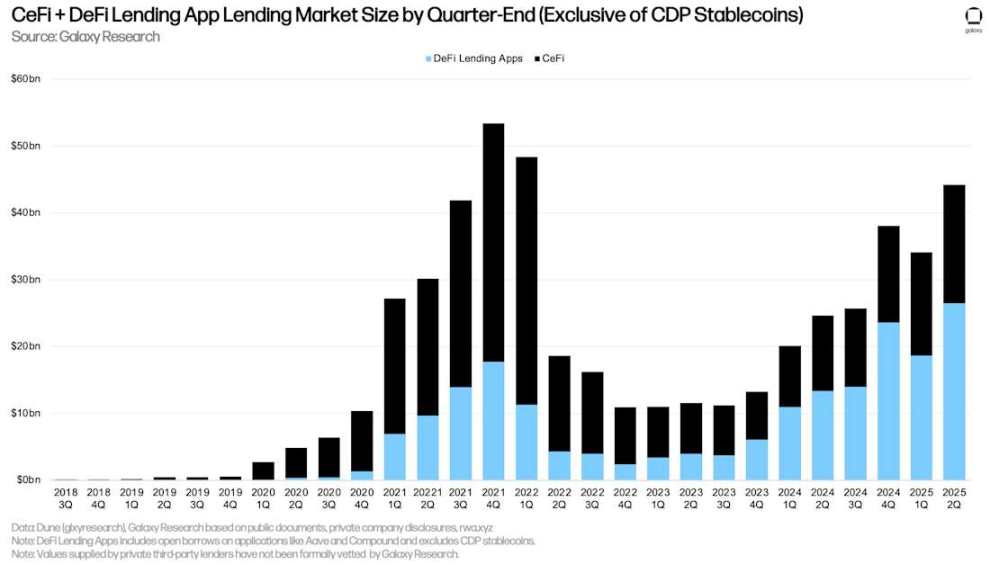
CeFi + DeFi Lending Application Market Size at Quarter-End (Excluding CDP Stablecoins)
Due to the quarter-over-quarter growth in outstanding borrowings of DeFi lending applications, their leading advantage over CeFi lending platforms has once again approached the historical high of Q4 2024. As of the end of Q2 2025, DeFi lending applications accounted for 59.83% of CeFi lending platforms, up from 54.56% in Q1 2025, but down 216 basis points from the peak of 61.99% in Q4 2024.
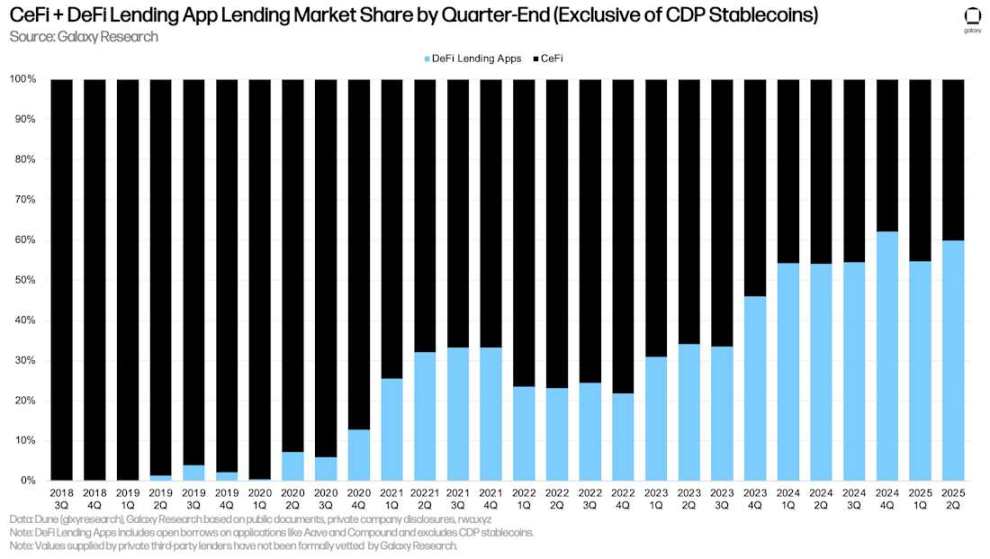
CeFi + DeFi Lending Application Market Share at Quarter-End (Excluding CDP Stablecoins)
The third component, the cryptocurrency collateral portion of collateralized debt position (CDP) stablecoin supply, increased by $1.24 billion (+16.45%) quarter-over-quarter. Similarly, there may be double counting between the total scale of CeFi loans and the CDP stablecoin supply, as some CeFi entities may rely on minting CDP stablecoins through cryptocurrency collateral to provide loans to off-chain clients.
Overall, in Q2 2025, cryptocurrency collateralized loans grew by $11.43 billion (+27.44%), reaching $53.09 billion. Only in Q4 2021 ($69.37 billion) and Q1 2022 ($63.43 billion) were the balances of cryptocurrency collateralized loans and CDP stablecoins higher than the current level.
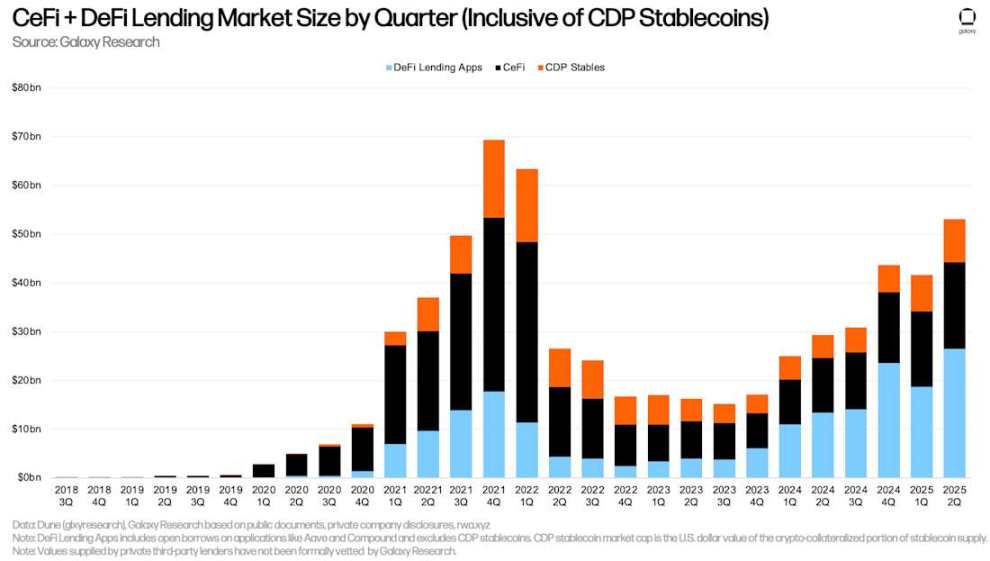
CeFi + DeFi Lending Market Size at Quarter-End (Including CDP Stablecoins)
As of the end of Q1 2025, DeFi lending applications accounted for 49.86% of the cryptocurrency collateralized loan market (up 515 basis points from Q1 2025), CeFi platforms accounted for 33.48% (down 373 basis points), and the cryptocurrency collateral portion of CDP stablecoins accounted for 16.65% (down 142 basis points). When combining DeFi lending applications and CDP stablecoins, the market share of on-chain lending platforms was 66.52% (up 373 basis points), slightly below the historical high of 66.86% at the end of Q4 2024.
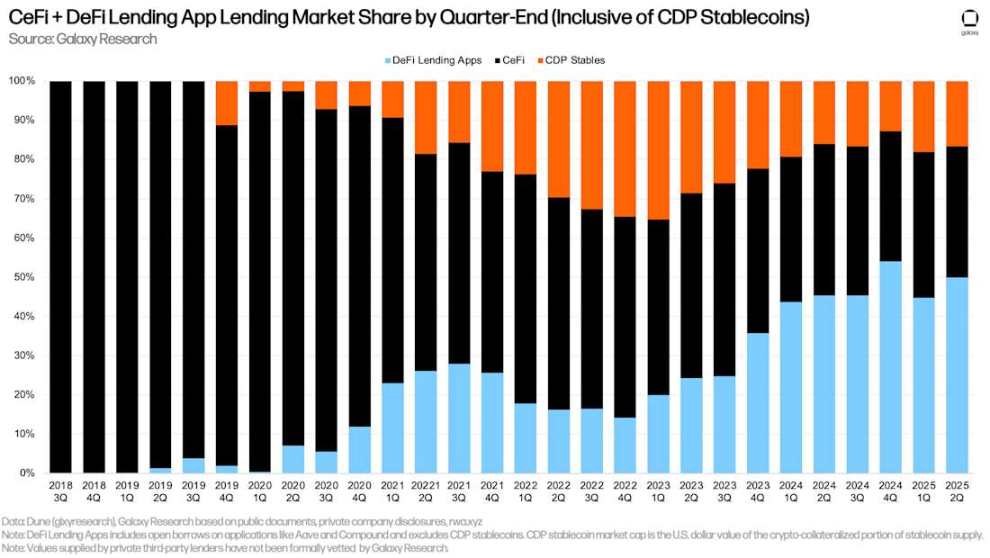
CeFi + DeFi Lending Application Market Share at Quarter-End (Including CDP Stablecoins)
Other Perspectives on DeFi Lending
DeFi borrowing continues to reach historical highs, with activity on Ethereum dominating. The "Liquid Leverage" program in collaboration with Aave by Ethena, along with the continued use of Pendle principal tokens (PTs) on Aave and Euler, has played a significant role in the expansion of the on-chain lending market. Supported by the "Liquid Leverage" program and Pendle PT tokens, users implement "circular strategies," allowing them to profit from arbitrage between the yield of collateralized assets and borrowing costs. This strategy is common with ETH and stETH (liquid-staked ETH), where users gain leveraged exposure to Ethereum staking annual percentage yields (APY) through circular strategies.
Since the end of the quarter on June 30, the asset supply of DeFi lending applications has increased by $20.06 billion (+33.91%), reaching $79.22 billion. As of July 31, 2025, Ethereum accounted for 78.22% of the DeFi lending supply. During the same period, Solana's deposits amounted to $4.3 billion, accounting for 5.43%.
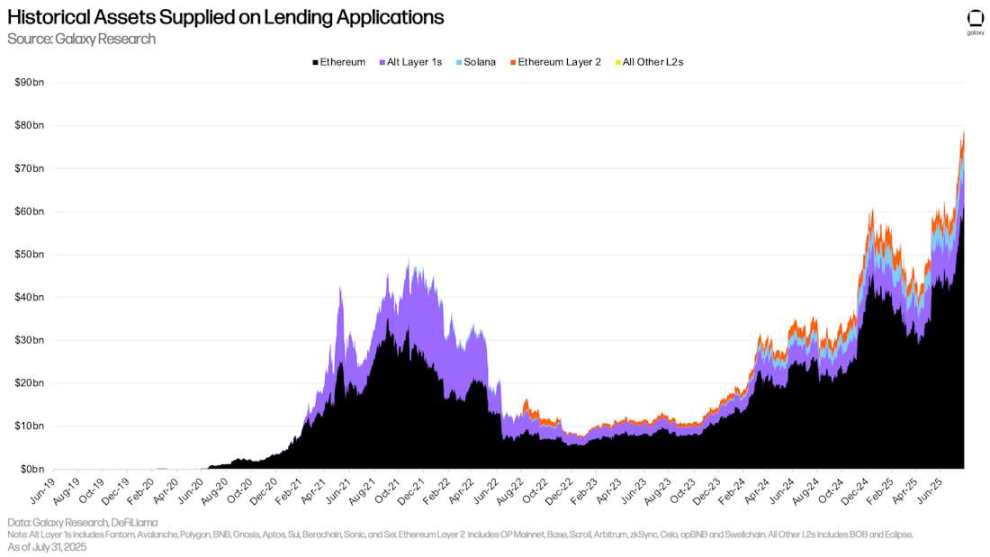
Historical Asset Supply on Lending Applications
The trend of borrowing assets in DeFi lending applications is similar to that of supply. From June 30 to July 31, new borrowings in DeFi lending applications amounted to $6.2 billion (+33.94%). Ethereum led both in absolute and relative growth, with new borrowings of $8.48 billion, a growth rate of +42.73%. During the same period, the borrowing growth rate of Ethereum Layer 2 ranked second, with total borrowings increasing by $309.73 million (+24.71%).
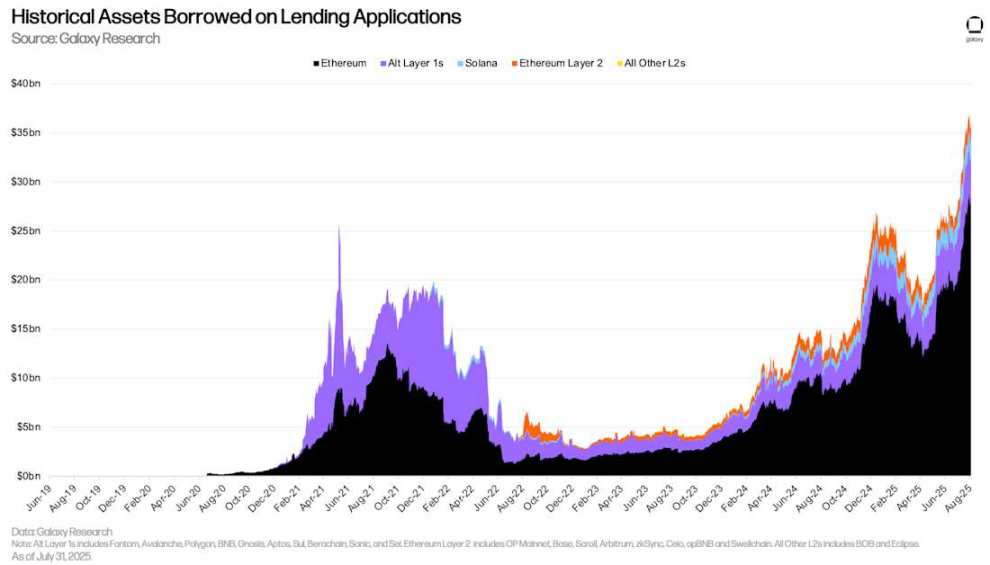
Historical Borrowing Assets on Lending Applications
As of August 8, there were $5.79 billion worth of Ethena-issued assets on Aave V3 Core, of which 55.88% were Pendle PT tokens. Additionally, the total amount of USDe (Ethena's synthetic dollar) and sUSDE (staked USDe, with yields derived from the underlying collateral of USDe) was $2.45 billion.
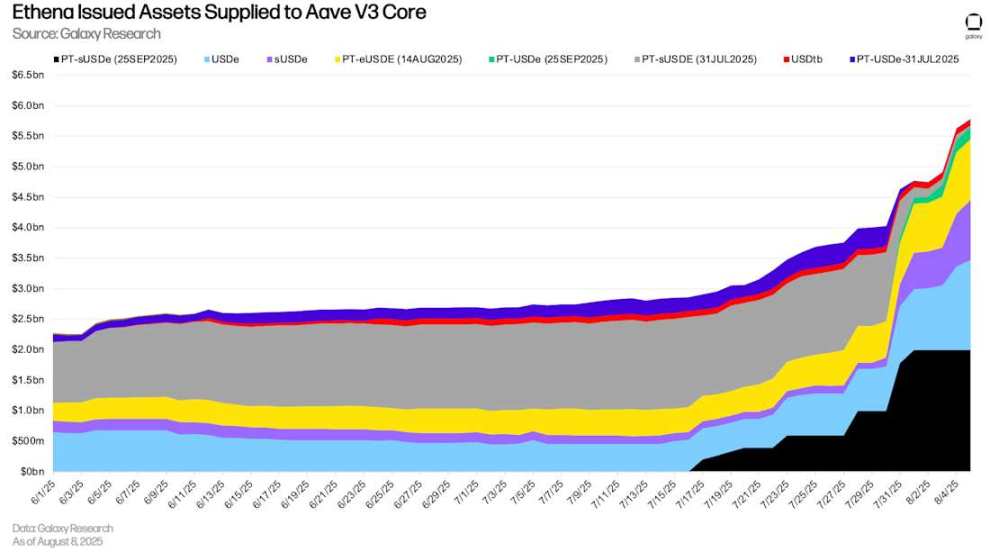
Ethena Issued Assets Supplied to Aave V3 Core
On-chain vs. Off-chain Rates
The following compares the borrowing rates of stablecoins, BTC, and ETH in the on-chain lending market versus off-chain platforms.
Stablecoins
The weighted average borrowing rate for stablecoins slightly increased from 4.7% on March 31 to 4.96% on July 31 (using a seven-day moving average of the weighted average stablecoin borrowing rate and CDP stablecoin minting fees). This slight increase was due to a slight uptick in borrowing activity, while the parameters of the stablecoin lending market remained largely unchanged. Since mid-March 2025, the stablecoin rates on Aave (the largest liquidity hub for stablecoins) have remained unchanged.
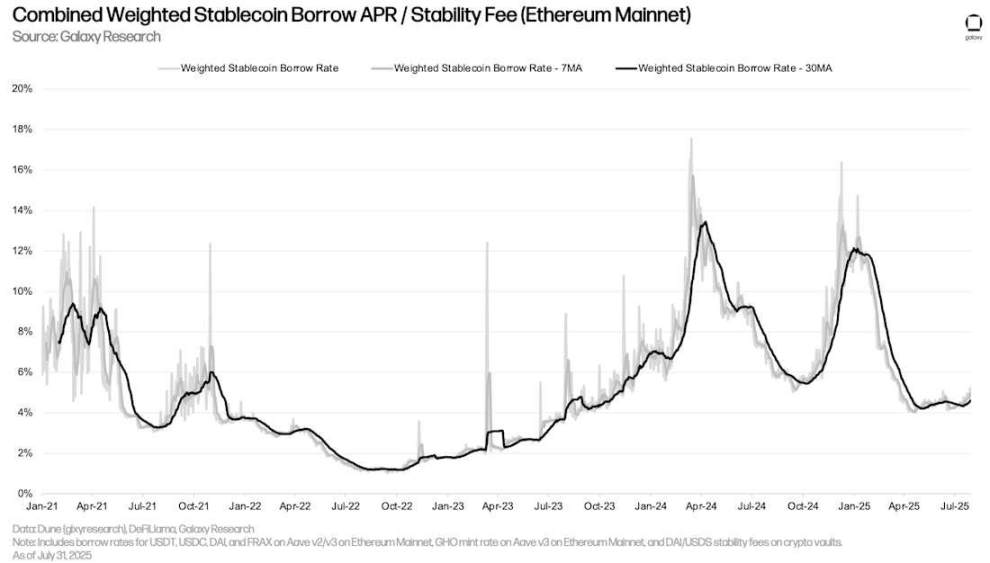
Comprehensive Weighted Stablecoin Borrowing Annual Rate / Stability Fee (Ethereum Mainnet)
The costs of borrowing stablecoins through lending applications and minting CDP stablecoins through cryptocurrency collateral are listed separately. The trends of the two rates are similar, but the CDP stablecoin minting rates typically exhibit less volatility, as they are manually set periodically and do not fluctuate in real-time with the market.
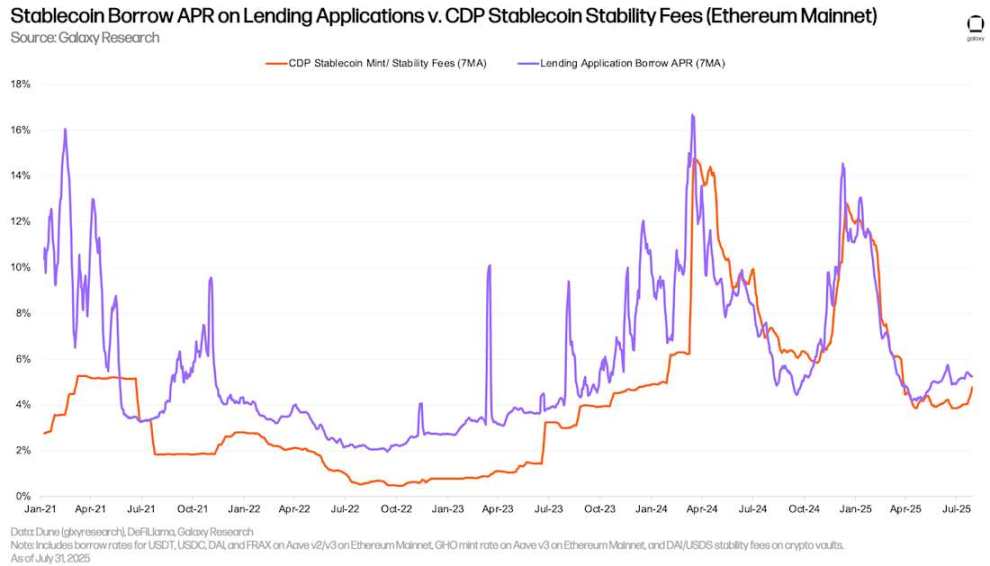
Stablecoin Borrowing Annual Rate on Lending Applications vs. CDP Stablecoin Stability Fee (Ethereum Mainnet)
Since early July, off-chain USDC rates have begun to rise slightly, while the rates on on-chain lending applications have remained relatively stable. As of July 28, 2025, the spread between on-chain USDC rates and off-chain rates (on-chain rates minus off-chain rates) reached its highest level since December 30, 2024. Despite continuous price increases throughout the quarter, both on-chain and off-chain stablecoin rates remained stable.
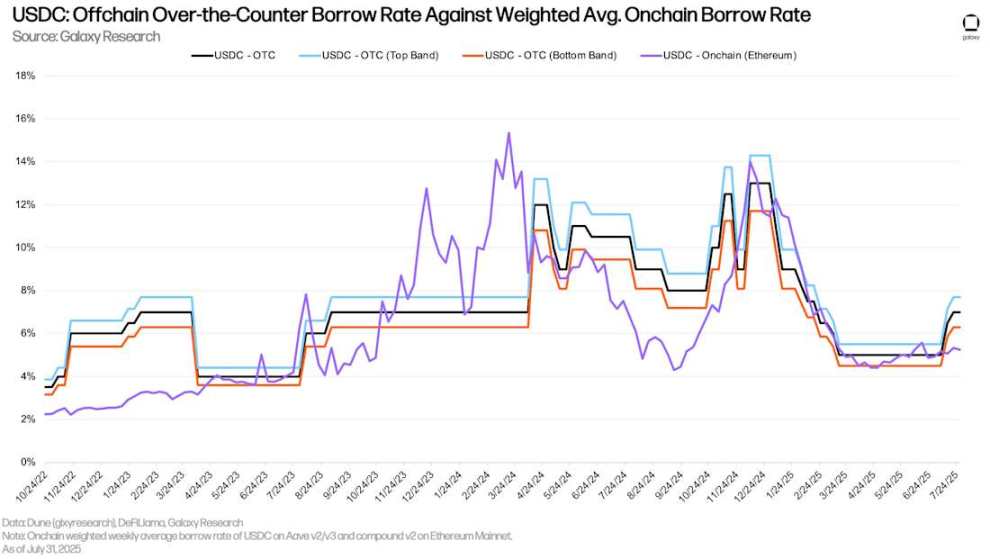
USDC: Off-chain Borrowing Rate vs. Weighted Average On-chain Borrowing Rate
The following chart tracks the same rates for USDT. Since early July, the on-chain and off-chain rates for USDT have been closer than those for USDC.
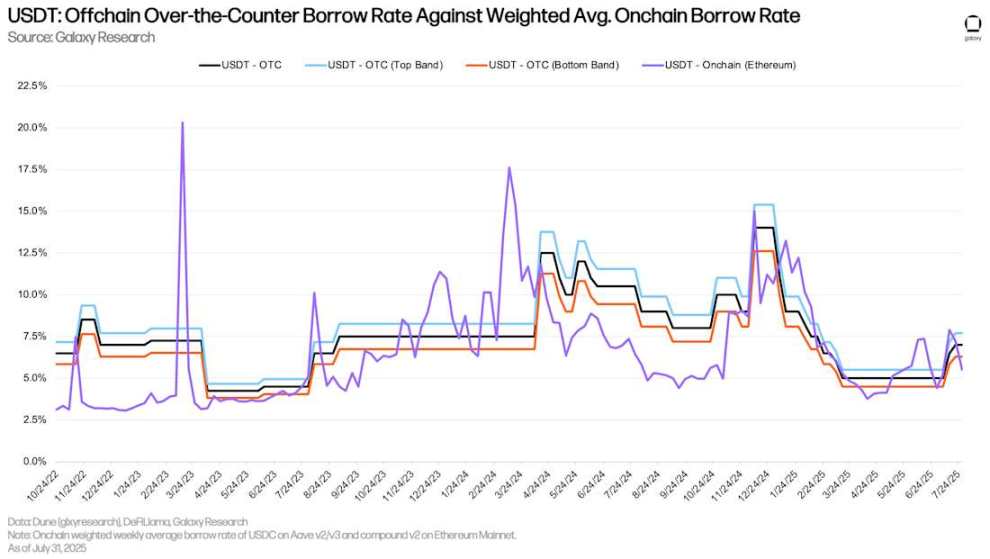
USDT: Off-chain Borrowing Rate vs. Weighted Average On-chain Borrowing Rate
Bitcoin
The following chart shows the weighted borrowing rates for wrapped Bitcoin (WBTC) across multiple applications and chains in lending applications. The borrowing costs for on-chain WBTC are generally lower, as wrapped Bitcoin is primarily used as collateral in on-chain markets, leading to lower borrowing demand. Compared to stablecoins, the borrowing costs for on-chain BTC remain stable, as the frequency of borrowing and repayment is lower.
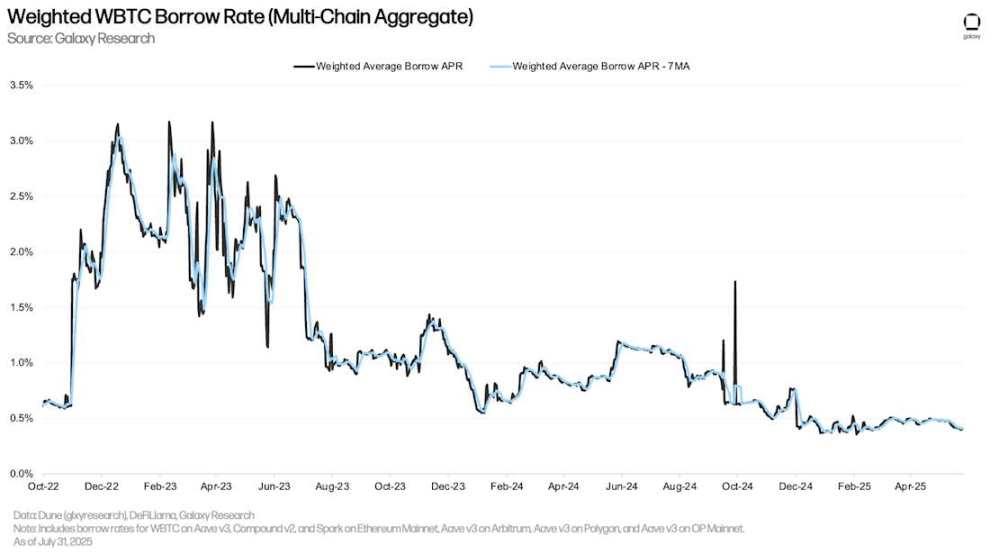
Weighted WBTC Borrowing Rate (Multi-chain Summary)
The historical divergence between on-chain and off-chain BTC borrowing rates persisted in Q2. In the off-chain market, the demand for BTC is primarily driven by two factors: 1) the demand to short BTC; 2) using BTC as collateral for stablecoin and cash loans. The former is a demand source that is not commonly seen in the on-chain lending market, leading to differences in borrowing costs between on-chain and off-chain BTC.
In early April, as the market rebounded strongly from the "Liberation Day" lows, off-chain BTC rates rose slightly. However, as the market cooled at the end of July, rates fell back to the 2.25% level seen at the beginning of Q2.
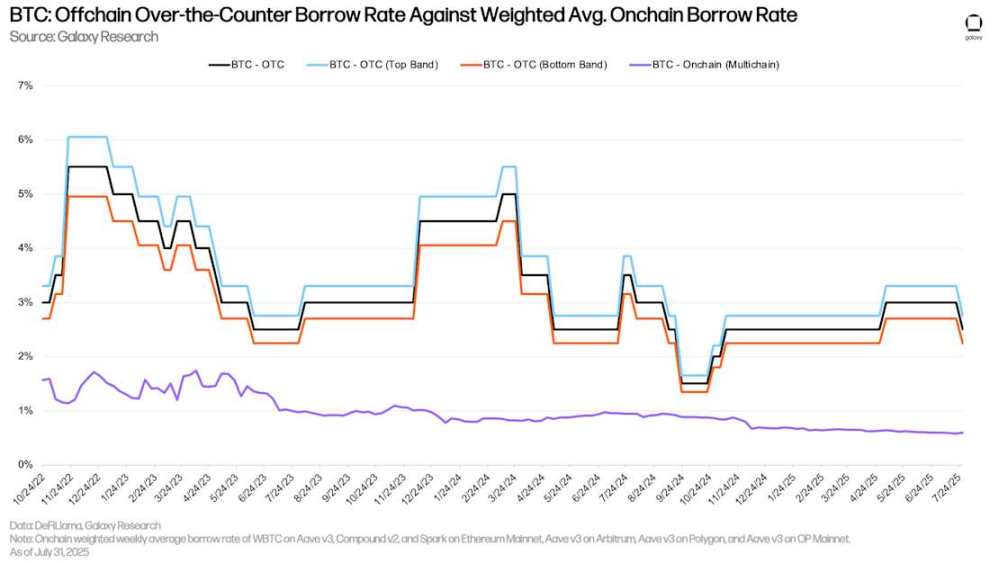
BTC: Off-chain Borrowing Rate vs. Weighted Average On-chain Borrowing Rate
ETH and stETH
The following chart shows the weighted borrowing rates for ETH and stETH (staked ETH on the Lido protocol) across multiple applications and chains. Historically, the borrowing cost of ETH has been higher than that of stETH because users borrow ETH to implement circular strategies, thereby gaining leveraged exposure to the staking annual percentage yield of the Ethereum network (using stETH as collateral). As a result, the annual borrowing rate for ETH typically fluctuates around 30-50 basis points above the staking annual percentage yield of the Ethereum network. When borrowing costs exceed staking yields, this strategy becomes uneconomical, so the annual borrowing rate for ETH rarely stays above the staking annual yield for long. However, in July, the borrowing rate for ETH surged significantly due to a large amount of ETH being withdrawn from Aave V3 Core. The impact of this event will be discussed in detail below.
Similar to WBTC, the borrowing cost of stETH is generally lower because this asset is primarily used as collateral, resulting in relatively low utilization.
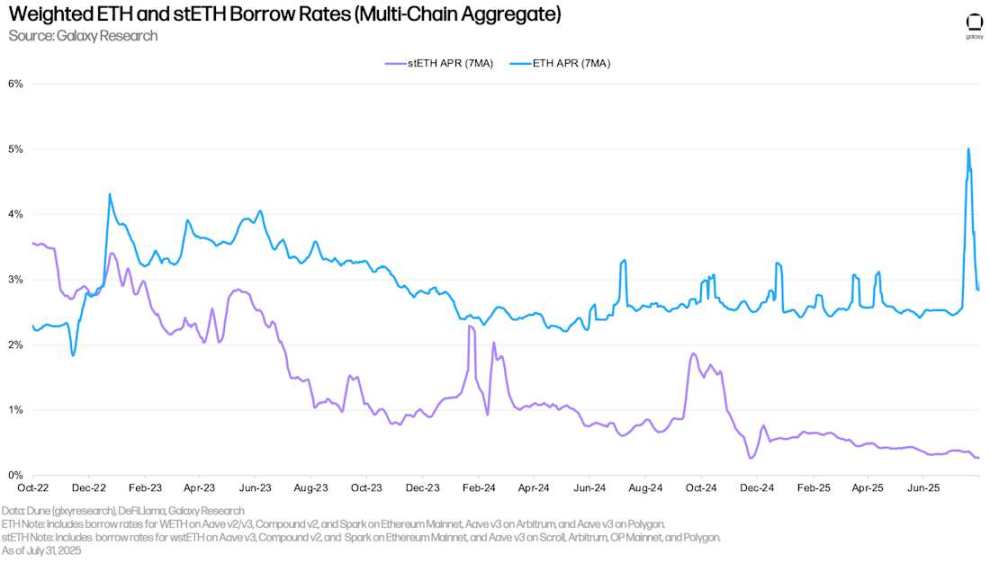
Weighted ETH and stETH Borrowing Rates (Multi-chain Summary)
By using liquid staking tokens (LSTs) or liquid re-staking tokens (LRTs) as collateral (which can generate yields), users can obtain ETH loans at lower (or even negative) net borrowing rates. This cost efficiency drives the implementation of circular strategies: users repeatedly use LSTs as collateral to borrow unstaked ETH, stake it, and then use the generated LSTs to borrow more ETH, thereby amplifying their exposure to the ETH staking annual yield. This strategy is only effective when the borrowing cost of ETH is lower than the staking annual yield of stETH. In most cases, users can successfully implement this strategy. However, during the period from July 15 to July 25, nearly 300,000 ETH were withdrawn from Aave V3 Core, causing the borrowing rate for ETH to spike, making the circular strategy unprofitable (as shown in the chart below, the net rate remained above 0%).
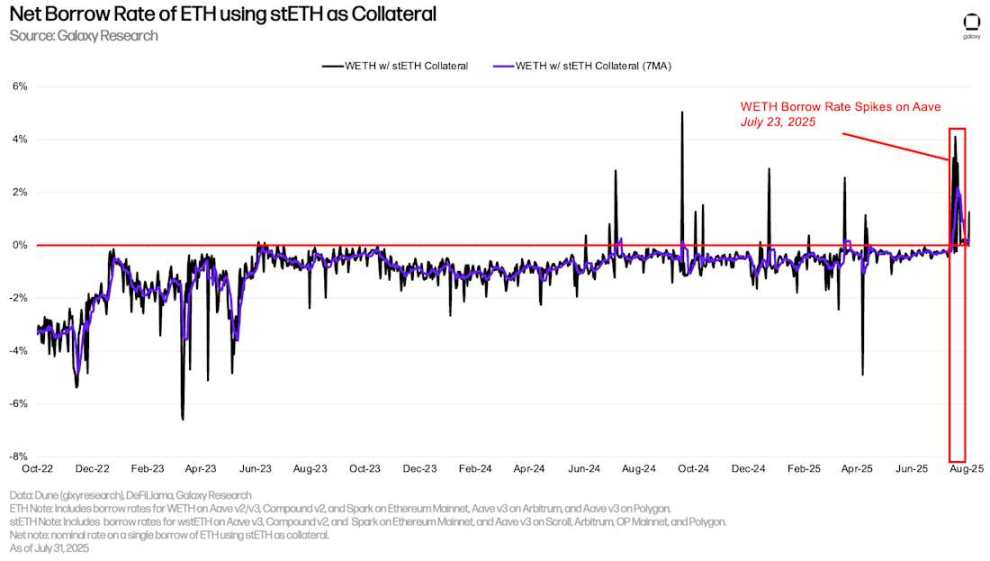
Net Borrowing Rate for ETH Using stETH as Collateral
This event triggered a chain reaction in the Ethereum staking withdrawal queue, with users eager to close circular positions, which required unstaking ETH from Ethereum's Beacon Chain. At its peak, the waiting time for ETH unstaking approached 13 days, setting a historical record. This event on Aave indicates that, although rare, the DeFi market can have a significant impact on the operation of the blockchain itself.
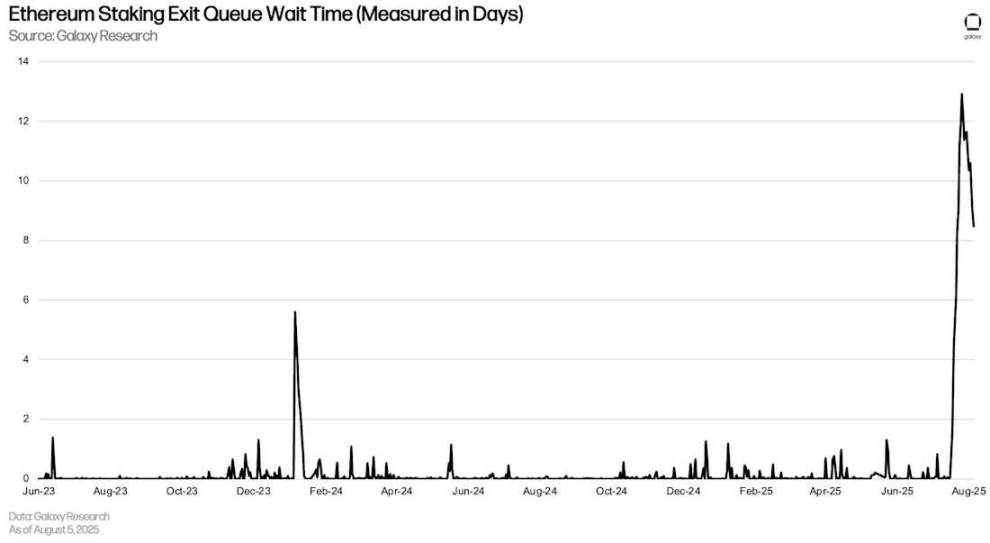
Waiting Time for Ethereum Staking Withdrawals (in Days)
Off-chain ETH Rates
Similar to Bitcoin, the cost of borrowing ETH through on-chain lending applications is significantly lower than off-chain. This is primarily driven by two factors: 1) Similar to BTC, there is short-selling demand off-chain, which is not commonly seen on-chain; 2) The staking annual yield of Ethereum provides a floor rate for off-chain borrowing, as suppliers have little incentive to deposit assets on off-chain platforms at rates below the staking annual yield, or for off-chain platforms to lend assets at rates below the staking annual yield. Therefore, for ETH, the floor borrowing rate off-chain is typically the staking annual yield, while the on-chain staking annual yield usually serves as the ceiling rate.
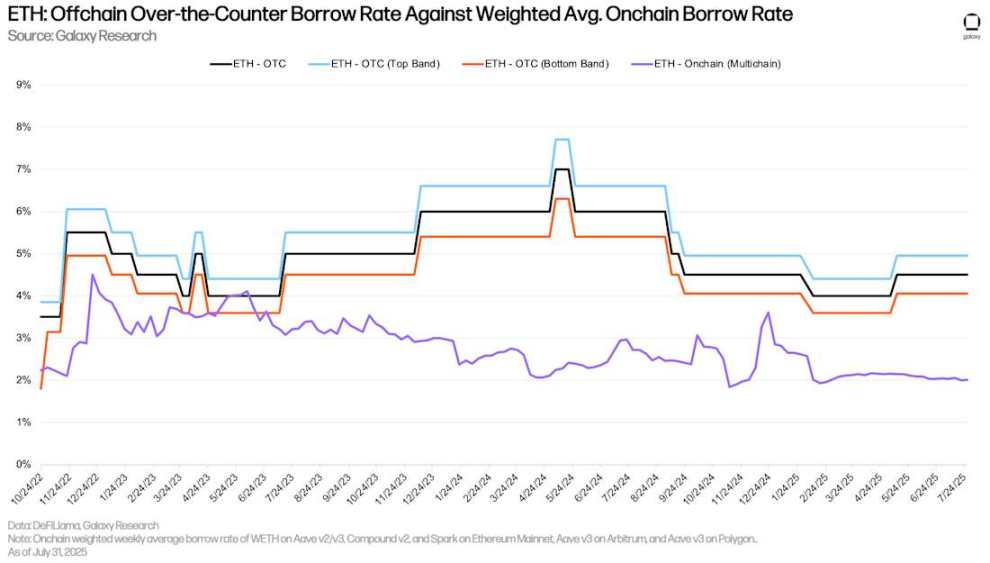
ETH: Off-chain Borrowing Rate vs. Weighted Average On-chain Borrowing Rate
Corporate Debt Strategy
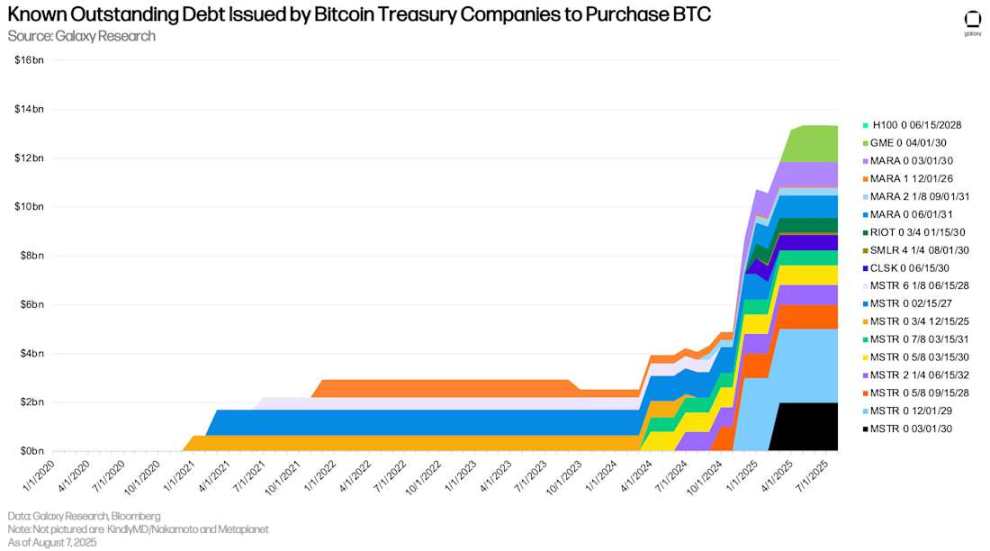
Digital Asset Treasury Companies (DATCOs) remained a core theme in Q2. From March to June, the rise of Ethereum treasury companies became a significant trend in the DATCOs space, whereas such entities were not common in the early months of the year. A key difference between some Bitcoin treasury companies and Ethereum treasury companies is that Bitcoin treasury companies utilize debt financing to purchase assets. In contrast, the large Ethereum treasury companies that launched in recent months have relied entirely on public equity private investment (PIPEs), private placements, market issuances (ATMs), and selling other assets (e.g., selling BTC to buy ETH) for financing. Consequently, along with the fact that Bitcoin DATCOs have not issued new debt, the outstanding debt balance of traceable treasury companies has remained unchanged at $12.74 billion (including GameStop).
Known Outstanding Debt Issued by Bitcoin Treasury Companies for Purchasing BTC
Due to the lack of new debt issuance, the scale and maturity of DATCOs' debt are consistent. Nevertheless, June 2028 remains a month to watch, as $3.65 billion of outstanding debt will mature at that time. There are currently 16 months until the first batch of debt matures (December 2026).
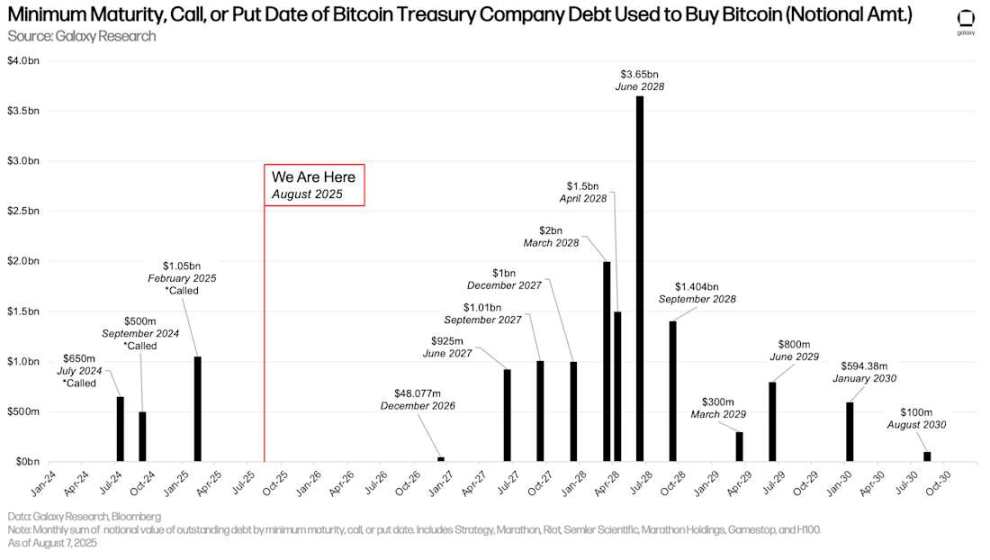
Earliest Maturity, Redemption, or Resale Dates for Debt Used by Bitcoin Treasury Companies to Purchase Bitcoin (Nominal Amount)
Similar to the maturity schedule, the interest payments made by DATCOs that issue interest-bearing debt each quarter remain consistent with the previous quarter. Strategy (formerly MicroStrategy) has the highest quarterly interest expense at $17.5 million.
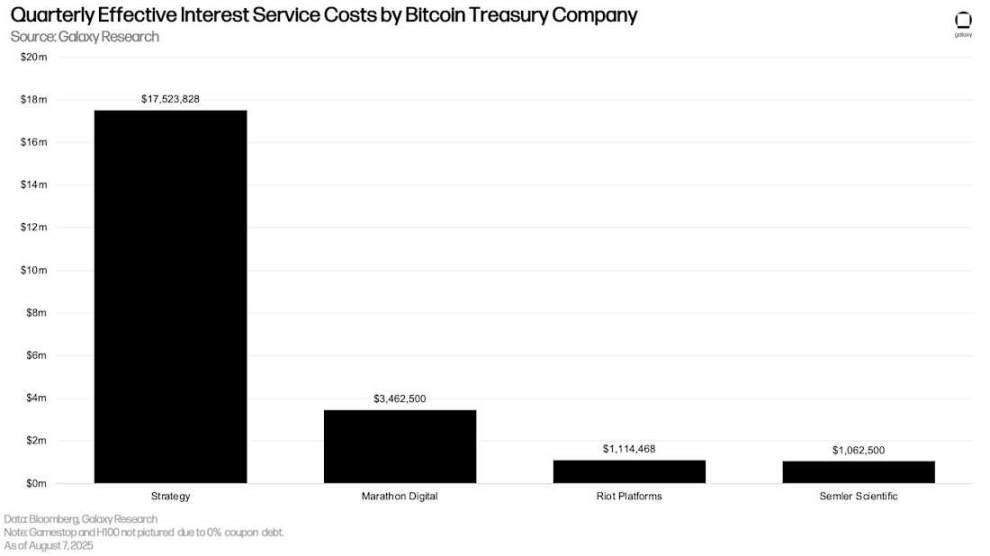
Quarterly Actual Interest Expenses of Bitcoin Treasury Companies
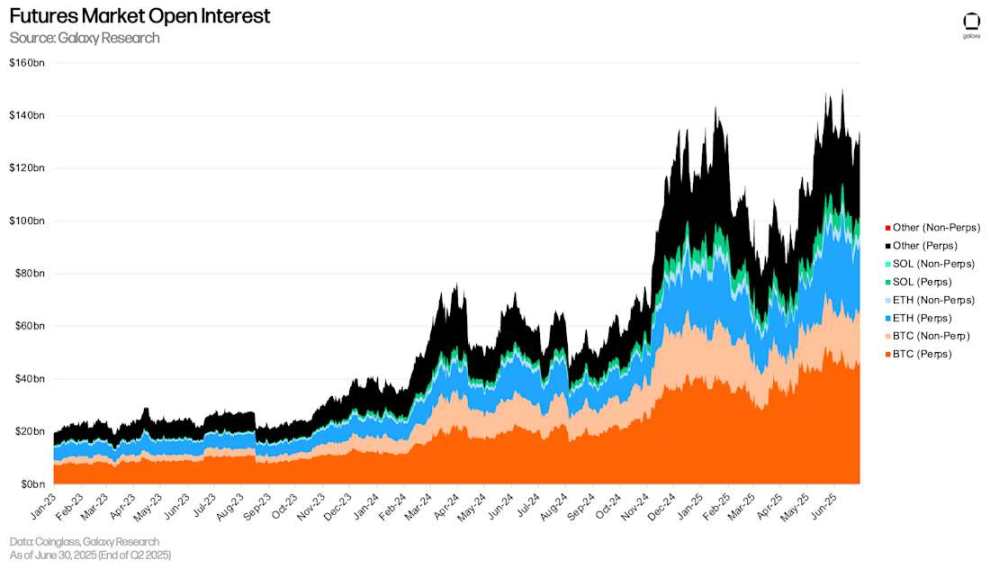
Futures Market
Open interest in futures (including perpetual futures) saw significant growth in Q2. As of June 30, the total open interest in futures on major platforms was $132.6 billion, an increase of $36.14 billion (+37.47%) from the end of Q1 on March 31. During the same period, open interest in token futures grew by $16.85 billion (+34.92%), Ethereum futures open interest increased by $10.54 billion (+58.65%), Solana futures open interest rose by $1.97 billion (+42.82%), and open interest in other cryptocurrency futures increased by 38.52%. It is important to note that the total open interest does not fully represent the absolute amount of leverage, as some open interest may be hedged by spot long positions, resulting in traders maintaining a delta-neutral exposure to the underlying asset.
Since the last quarter, we have added the following futures platforms:
BingX
Bitunix
CoinEx
Coinbase
Gate
KuCoin
MEXC
dYdX
Futures Market Open Interest
As of June 30, CME (including perpetual and non-perpetual contracts) accounted for 15.48% of open interest, up 149 basis points from 13.99% on March 31, and down 58 basis points from January 1. The open interest share of this Chicago exchange peaked at 19.08% on February 21, before declining by 360 basis points.
As of June 30, the share of Ethereum open interest on CME (calculated as CME Ethereum open interest divided by total market open interest) was 10.77%. This is an increase of 218 basis points from the end of Q1 2025 and a decrease of 118 basis points from January 1, 2025. Similarly, the share of Bitcoin open interest on CME rose by 380 basis points in Q2 to 26.32%, down 152 basis points from the beginning of the year.
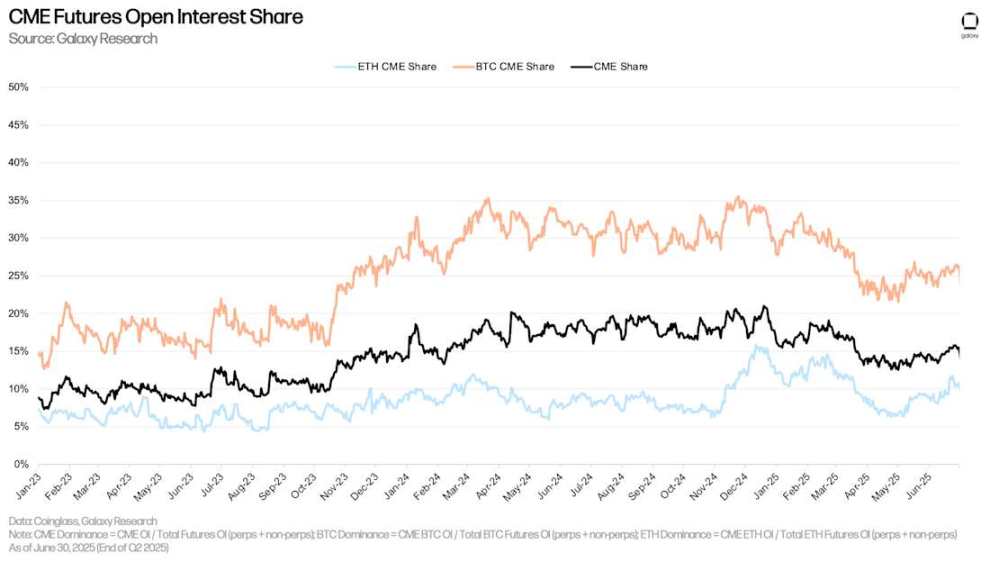
CME Futures Open Interest Share
Perpetual Futures
As of June 30, open interest in perpetual futures was $108.92 billion, an increase of $29.2 billion (+36.66%) from the end of Q1. Open interest in perpetual futures is down 14.18% from the historical high of $126.7 billion on June 10. As of June 30, the market share of Bitcoin perpetual futures was 41.77%, Ethereum was 23.13%, Solana was 5.88%, and other assets accounted for 29.23%.
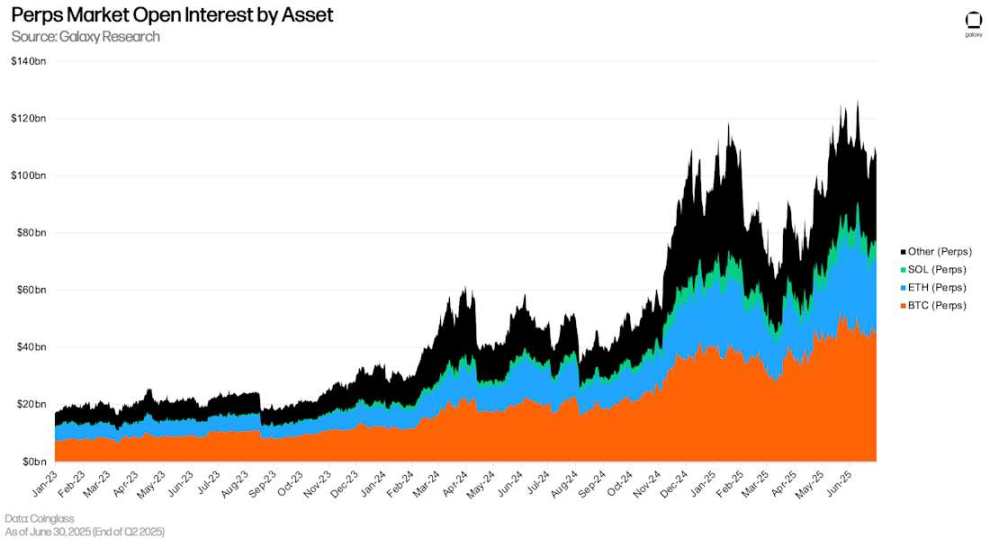
Perpetual Futures Open Interest by Asset
As of June 30, the share of open interest in perpetual futures was 82.02%, down 231 basis points from the end of Q1.
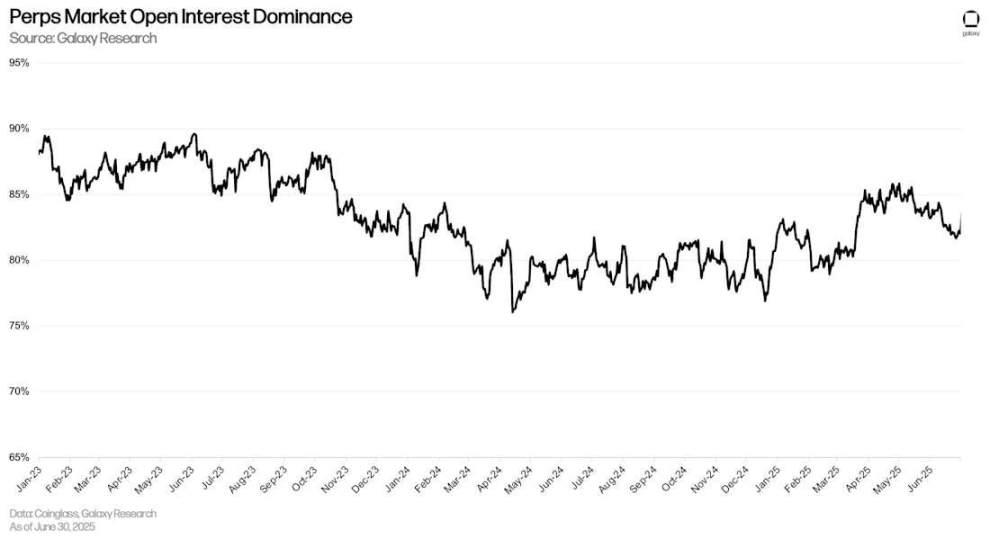
Share of Open Interest in Perpetual Futures
By open interest, Binance holds the largest share in the perpetual futures market at 20.83%. This is followed by Bybit (15.41%) and Gate (12.85%). As of the end of Q2, Hyperliquid had open interest of $7.516 billion, accounting for 6.91% of the total perpetual futures market.
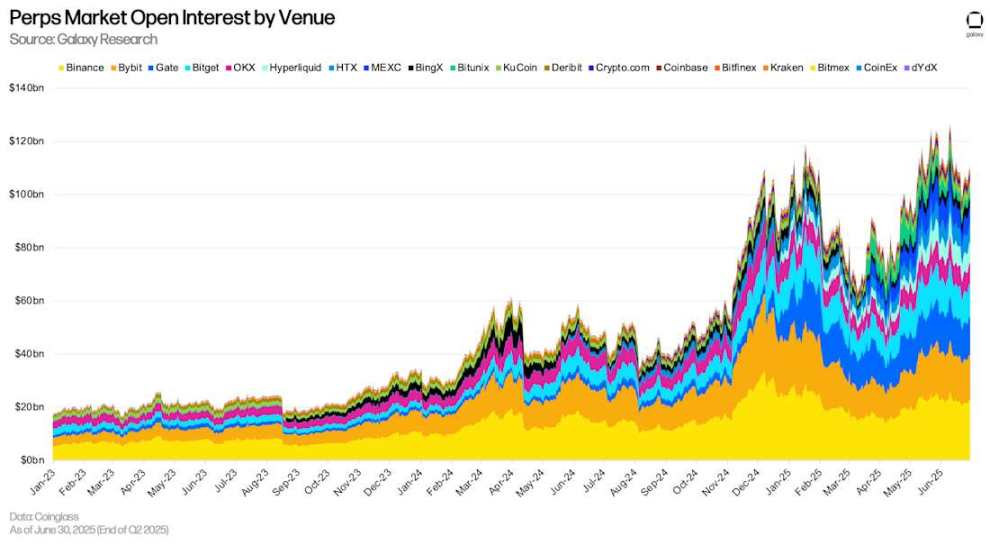
Perpetual Futures Open Interest by Platform
Conclusion
Leverage in the system continues to expand to new highs, with on-chain borrowing reaching historical peaks and overall cryptocurrency collateralized loans hitting multi-year highs. Factors driving this growth include: the reflexive relationship between borrowing activity and price increases; treasury companies leveraging as a significant new source of demand; and the expansion of new capital-efficient collateral in DeFi. This trend is also evident in the futures market, where open interest has seen substantial growth.
Looking ahead, the ongoing collaboration among DeFi participants and the optimization of new collateral suggest that the DeFi lending market is likely to continue growing in the coming quarters. Meanwhile, CeFi lending also benefits from the optimism driven by treasury companies and the overall market sentiment.
免责声明:本文章仅代表作者个人观点,不代表本平台的立场和观点。本文章仅供信息分享,不构成对任何人的任何投资建议。用户与作者之间的任何争议,与本平台无关。如网页中刊载的文章或图片涉及侵权,请提供相关的权利证明和身份证明发送邮件到support@aicoin.com,本平台相关工作人员将会进行核查。


