The market's trust and confidence in Ethereum is continuously strengthening.
整理 & 编译:深潮TechFlow
Guest: Mike Nadeau, Founder of DeFi Report
Host: Ryan Sean Adams
Podcast Source: Bankless
Original Title: 10 Bullish ETH Charts
Broadcast Date: July 17, 2025
Key Points Summary
The enthusiasm for Ethereum continues to rise, but has the real bull market just begun?
Mike Nadeau from DeFi Report will join us to delve into Ethereum's fundamental performance in the second quarter and share the 10 most bullish charts from his latest report.
We will explore why institutional demand may be a key driver of this surge, how ETF fund flows and treasury holdings could accelerate this trend, and whether there is still potential for Ethereum to be undervalued given the recent significant price increases.
Additionally, we will examine the Genius Bill, the growth trend of stablecoins, on-chain real-world assets, and key on-chain indicators that could drive the next bull market for Ethereum.
Highlights
Bitcoin funds are gradually flowing into the early rotation phase of Ethereum, a trend that may continue for a longer time and have more far-reaching effects.
With the support of the Genius Bill, all major banks will also launch their own stablecoin strategies.
The market's trust and confidence in Ethereum is continuously strengthening.
The current asset scale on Ethereum has reached $7.5 billion, a figure that is expected to experience explosive growth in the future. Stablecoins and certain stocks that may go on-chain at future points will be the main drivers of this growth.
The crypto market has strong reflexivity, and sometimes the key factor driving market development is actually the price of ETH itself. An increase in ETH price attracts more assets to go on-chain, more users to enter the on-chain ecosystem, while other fundamental factors also improve accordingly.
Key data: Active loans on Ethereum have increased by 98%; the annual growth rate of on-chain RWA has reached 200%; the asset management scale on the Ethereum chain has reached an all-time high; ETH balances on CEX are at historical lows.
Introduction
Ryan:
The price of Ethereum is rising, and today we will share 10 of the most bullish Ethereum charts. Today, we have invited Mike Nadeau, who has just released the Q2 Ethereum quarterly report. We have selected five of the most bullish charts from it for detailed discussion.
The current price of Ethereum is $32,255. Although this price is still far below the all-time high, I want to remind everyone that it is also lower than the $4,100 from last December. However, Ethereum has indeed shown good upward momentum recently.
Do you think this momentum can be explained by the Q2 fundamental data? Are you feeling optimistic about the market?
Mike:
I think so. I hope so. We just held a financial report conference call yesterday. Today, I want to highlight some key points. In the call, we mainly provided data rather than sharing opinions. Today, we will delve deeper into the implications of this data and attempt some forward-looking analysis.
Ryan:
A lot has happened this week that is worth noting. I feel that the treasury issue has become particularly tense this week. But at the same time, we found that Ethereum has shown an upward trend on days when Bitcoin is down. This situation has occurred several times this week, which is something I haven't seen in a long time. During this cycle, I can't even remember a similar situation happening. While there are occasional days when Bitcoin rises slightly and Ethereum rises more, this is not common. And one day this week, possibly yesterday, Monday, or Tuesday, Bitcoin fell by 2% in 24 hours, while Ethereum rose by about 4%. This is very rare.
Mike:
This is a very significant shift, and it is exactly the trend I have been watching. I may be one of the early ones to notice this, and many predicted the shift in the Ethereum to Bitcoin price ratio (EBTC ratio) early on, but now it really feels like we have hit the bottom. As you said, we are currently at a five-year low. I have never seen Bitcoin fall while Ethereum rises by 4% or 5%. So for me, this is exactly the phenomenon I have been waiting for. It seems to indicate that Bitcoin funds are gradually flowing into the early rotation phase of Ethereum, a trend that may continue for a longer time and have more far-reaching effects.
Peter Thiel buys 9.1% stake in Tom Lee's ETH Treasury company
Ryan:
Interestingly, institutions seem to be leading this trend, or rather, institutional inflows may be driving the rise in Ethereum's price. I saw a news item yesterday that Peter Thiel recently purchased a 9.1% stake in Tom Lee's East Treasury company. As you may know, this company's stock code is MNR, and it is essentially an Ethereum treasury. Peter Thiel disclosed that he holds about 9% of the shares. I believe this has had a significant impact on the current market momentum. Therefore, today we will discuss some of the most bullish charts. These charts may be among the most representative content selected from your ETH Q2 report. Additionally, there are other noteworthy charts in the report, such as declining revenues, reduced fees, and increased L2 usage, which I recommend everyone check out for a comprehensive understanding of Ethereum's overall performance.
Institutional Adoption of Stablecoins
Ryan:
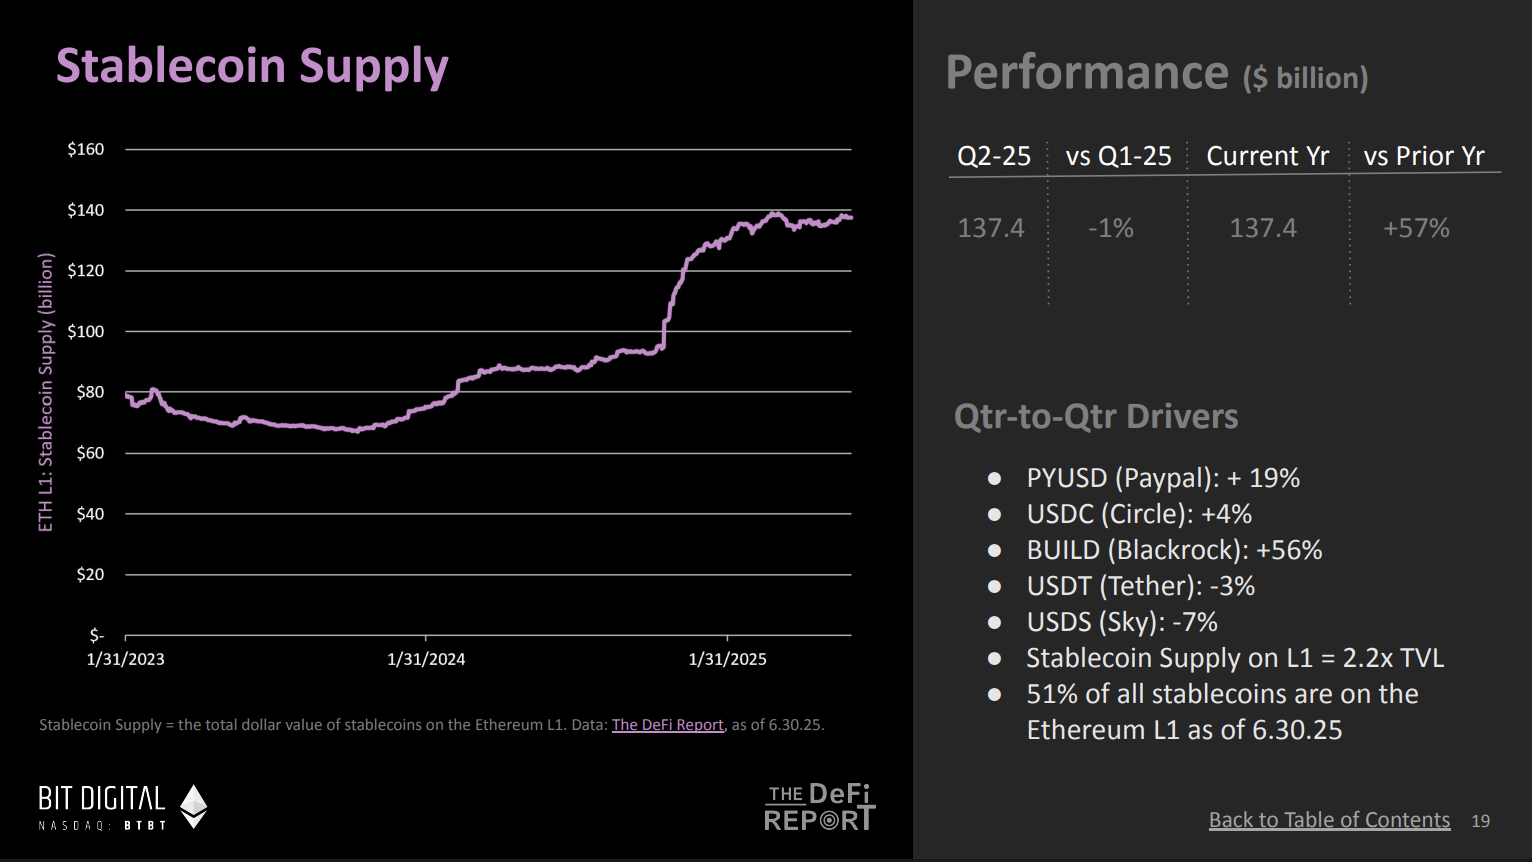
Let's discuss the trend of institutional adoption of stablecoins through some charts. I think this story starts with stablecoins. Tom Lee likened stablecoins to the ChatGPT moment in the cryptocurrency space, and he talks about this topic almost every day on CNBC. When you look at the stablecoin supply chart on Ethereum, what do you see? This is the first chart we are analyzing Ethereum today.
(Chart excerpted from The ETH Report - DeFi Report)
Mike:
Yes, it is indeed refreshing to see Tom Lee publicly discussing stablecoins on CNBC. He is highly respected in the financial community and views stablecoins as a key moment for cryptocurrency. I believe this is an important component of the Ethereum ecosystem.
We see that the passage rate of the Genius Bill related to stablecoins seems to be as high as 95% this year. The general consensus is that this bill will pass this summer. This will be an important milestone for Ethereum and the entire cryptocurrency market.
The concept of stablecoins is actually quite easy to understand. Anyone familiar with the crypto space knows the potential of stablecoins, and its influence is gradually entering the public eye. I am currently writing a report analyzing the potential impacts of this bill and its significance for fintech companies. We have already seen that almost all fintech companies will soon launch their own stablecoins, and the banking industry may also take the lead in launching their own stablecoins. This will have a profound impact on e-commerce payments and global financial inclusion. Bitcoin was originally seen as a tool to achieve these goals, but I believe stablecoins are the best solution for achieving financial inclusion. I spent five weeks in Buenos Aires, Argentina last year. In the U.S., people may not fully understand the necessity of stablecoins because of the low inflation rate here. But in Argentina, stablecoins have become an indispensable part of people's daily lives.
I see this as a huge opportunity. From the chart, the supply of stablecoins shows a long-term growth trend, and although it stabilized in the second quarter, I expect this trend to experience rapid growth with the passage of the Genius Bill.
Ryan:
According to the chart, by the end of the second quarter, the supply of stablecoins on Ethereum had reached about $140 billion. This figure already accounts for the majority of the sources of stablecoin supply, and you also predict that this number will further increase.
Regarding the Genius Bill, Trump referred to it as "Crypto Week." I think they hope to pass and push this bill within this week. Although Congress faced some resistance earlier, Trump is working to persuade the remaining opponents within the party to ensure the bill passes smoothly. Therefore, this bill may not only pass in the summer but could also be legislated within this week. If passed, this will further drive the growth of stablecoin supply on Ethereum. Last night, I also saw a news item that Jamie Dimon—who is well-known for not supporting cryptocurrencies—also stated that even JP Morgan is considering doubling down on investments in stablecoins. Jamie Dimon's exact words were: "I don't quite understand the purpose of people using these things, but we will make a big push in this area." Similar statements. Now we have already seen PayPal, Circle, BlackRock, and crypto-native companies like Tether actively promoting the development of stablecoins. I believe with the support of the Genius Bill, all major banks will also launch their own stablecoin strategies.
Mike:
I completely agree. I expect Stripe may also launch its own stablecoin. Through this bill, I think another area worth paying attention to is payroll payments. How can we get everyone to have a crypto wallet and start using stablecoins? I think some kind of mandatory mechanism is needed to achieve this. Payroll payments could be that mechanism. If we can speed up the payment process and move away from the traditional weekly or bi-weekly payroll payment model, I think this would be a significant breakthrough.
We can observe changes in this field over the next one to two years. However, it is essential to get stablecoins into everyone's hands and circulate them on the blockchain. I believe this will significantly enhance economic activity on the Ethereum chain. Currently, 51% of stablecoins in the crypto market are on the Ethereum main chain (L1), with an additional 4% to 5% on layer two networks (L2). Therefore, overall, about 55% of stablecoins are within the Ethereum ecosystem. This is a critical moment, and we even see major retailers like Walmart discussing the launch of stablecoins. Such trends indicate the enormous growth potential of stablecoins, and the Genius Bill could become a catalyst for this trend. Looking back at the previous cycle in 2021, a stablecoin-related bill passed OCC scrutiny, leading to a bull market for Ethereum. Thus, the Genius Bill may again be a key factor driving the market.
Active loans on Ethereum have increased by 98%
Ryan:
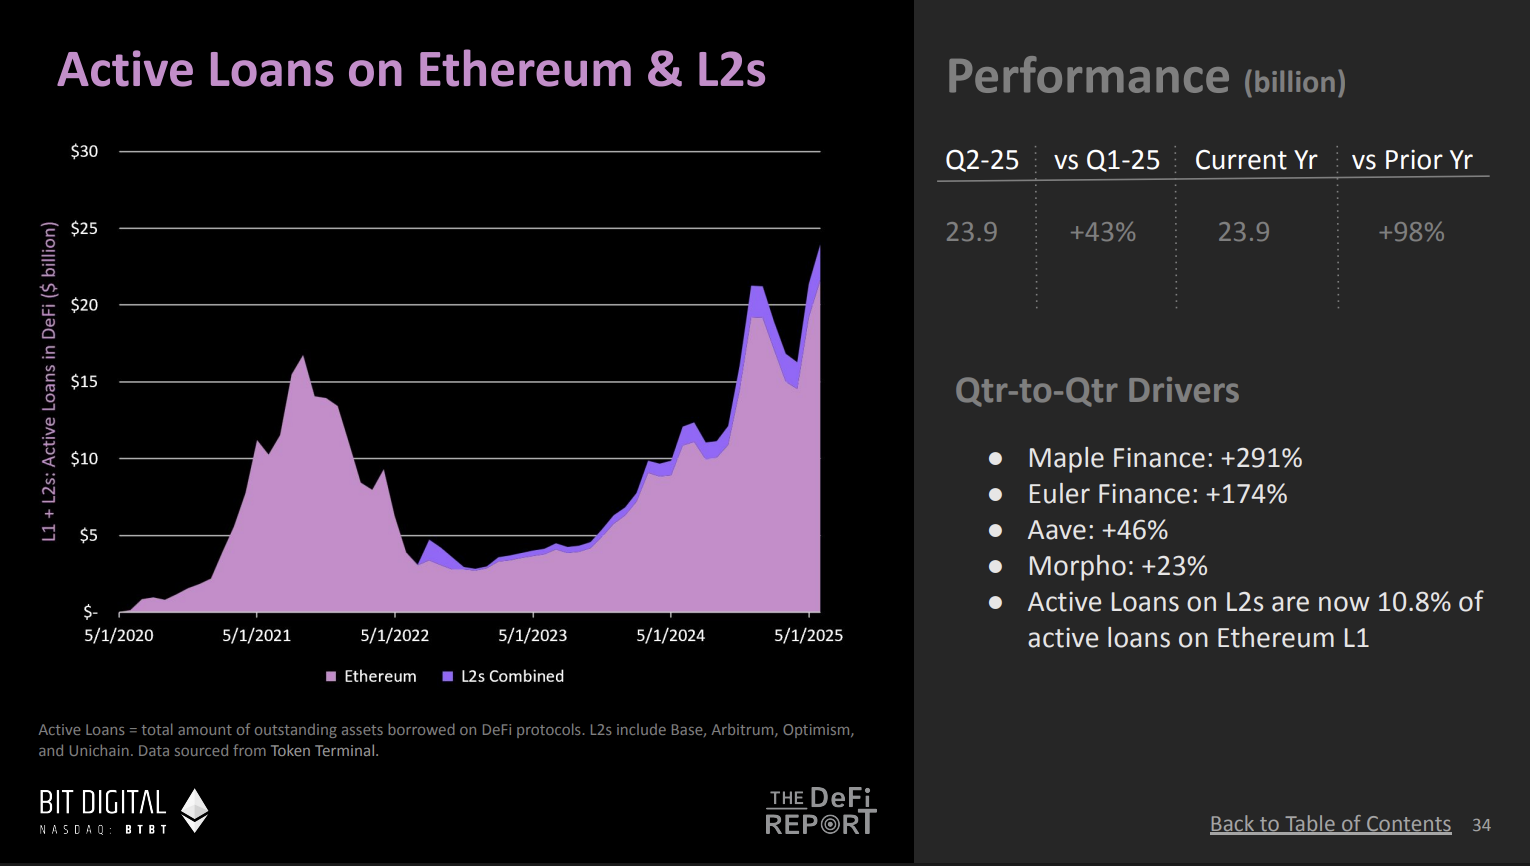
I guess institutions deploying stablecoins may also choose to purchase Ethereum (ETH) as part of their strategy within the Ethereum ecosystem. This is a chart reflecting the activity of Ethereum and its L2 networks, which is very noteworthy. This chart shows the active loan data on Ethereum, which has now reached an all-time high. What is the significance of this?
(Chart excerpted from The ETH Report - DeFi Report)
Mike:
This is very important because it indicates that the market's trust and confidence in Ethereum is continuously strengthening. We also see that the staking rate of Ethereum has reached an all-time high, with an increasing proportion of circulating supply. This not only reflects the market's confidence in the Ethereum protocol itself but also shows that user interest in loans and accessing decentralized finance (DeFi) is on the rise. At the same time, we may also observe more phenomena of re-mortgaging, which refers to the process of increasing leverage by reusing collateral, indicating that the activity level within the Ethereum ecosystem is significantly increasing.
For me, this chart signals that the demand for accessing DeFi, using collateral, and taking on corresponding risks is rising. The chart reflects the overall trend over the past five years, and the current active loan data has surpassed the historical peak of the previous cycle. I expect this number to continue to climb in this cycle.
Ryan:
Compared to last year, active loans on Ethereum have grown by 98%. I believe the importance of this growth also lies in its close relationship with institutional financial strategies. Currently, billions of dollars are driving competition among several listed financial companies to acquire more Ethereum assets. This is not just a billion-dollar scale; I believe many of these companies are actively deploying ETH as a productive asset within Ethereum and its broader ecosystem. This trend may bring about a "late-stage prosperity effect" in the DeFi market, where the massive influx of institutional funds will lead to a rapid development phase for the DeFi market. Imagine these financial companies; they essentially act like actively managed funds, and where do their returns come from? First, staking is a low-risk way to earn, but beyond staking, they may also utilize some decentralized lending protocols, such as Aave. Therefore, I think this is a very noteworthy story.
On-chain RWA annual growth rate has reached 200%
Ryan:
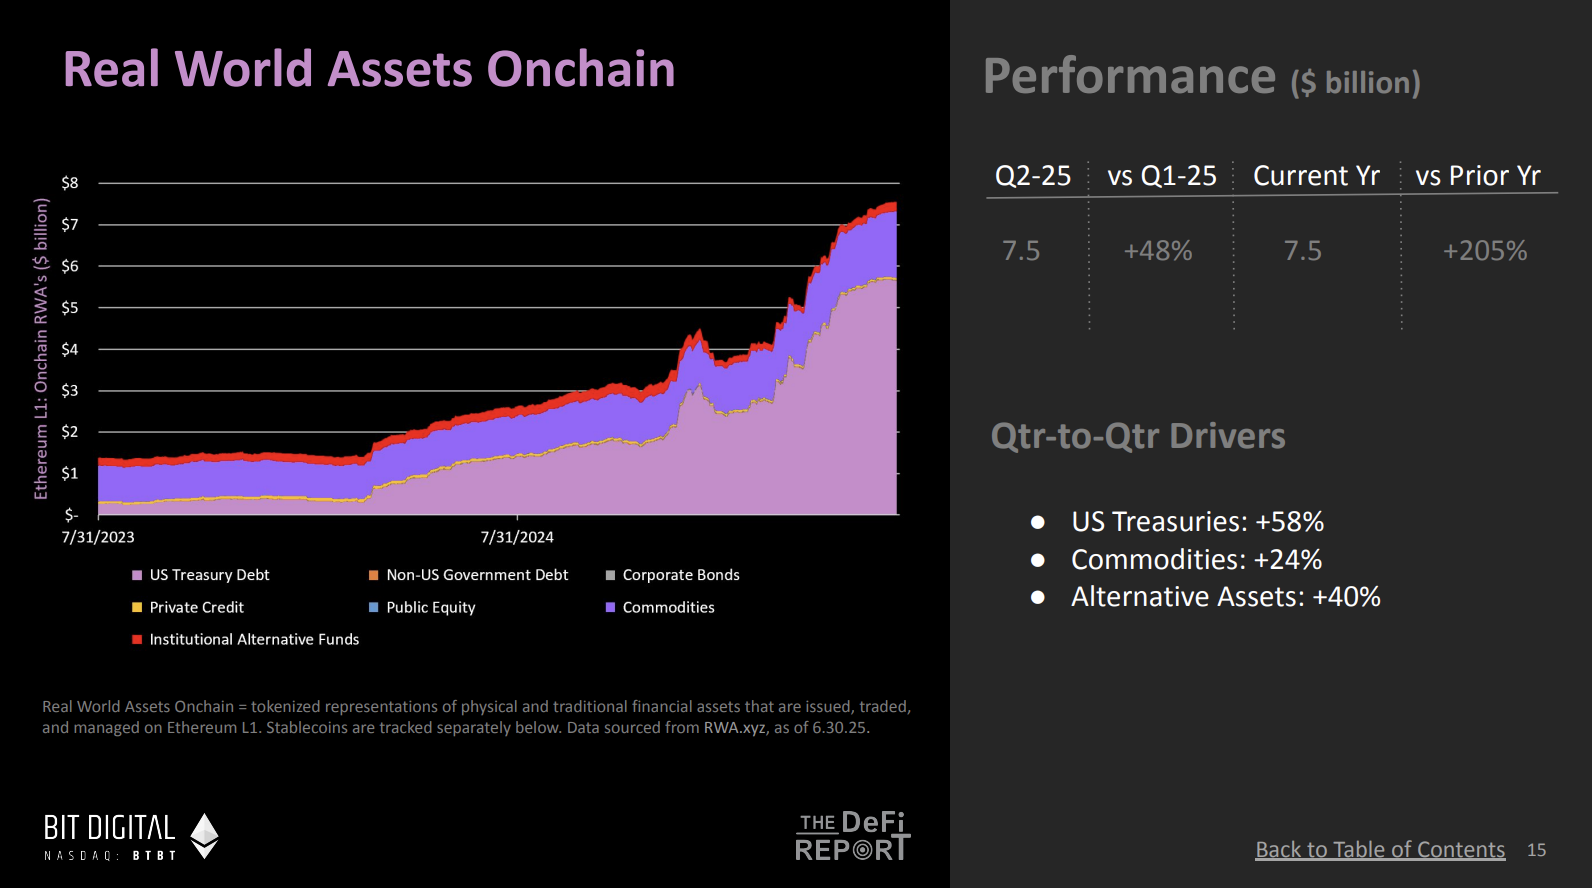
On-chain real-world assets are another important component of Ethereum's institutional development. We have observed that since last year, the growth of these assets has shown a hockey stick trend, with a very significant acceleration. Currently, the annual growth rate of real-world assets on Ethereum has reached 205%. What do you think this phenomenon reflects?
(Chart excerpted from The ETH Report - DeFi Report)
Mike:
This chart is very meaningful; it shows that more and more assets are migrating to Ethereum. Currently, the asset scale on Ethereum has reached $7.5 billion, a figure that is expected to experience explosive growth in the future. In my view, stablecoins and certain stocks that may go on-chain at future points will be the main drivers of this growth. Notably, companies like Robinhood have already begun related construction work within the Ethereum ecosystem.
Bringing assets on-chain is a key first step in driving this trend, while enabling liquidity for these assets on-chain is an even more important next step. If we can successfully bring more real-world assets on-chain, it will further promote the development of active loans and decentralized finance (DeFi). As more assets and collateral enter DeFi, users will be able to utilize these on-chain assets to optimize capital efficiency, thereby enhancing capital efficiency and driving the prosperity of the entire ecosystem.
I believe there is a feedback loop phenomenon here: as more assets go on-chain, more funds flow into DeFi, and more assets are used as collateral, which will lead to changes in gas fees and further impact Ethereum's burn mechanism.** The burn mechanism reduces the supply of Ethereum by burning a portion of transaction fees, thereby optimizing the entire ecosystem. Ultimately, this cycle will drive rapid development across the entire ecosystem.
The crypto market has strong reflexivity, and sometimes the key factor driving market development is actually the price of ETH itself. An increase in ETH price attracts more assets to go on-chain, more users to enter the on-chain ecosystem, while other fundamental factors also improve accordingly. This phenomenon is the opposite of how traditional finance operates, where fundamentals usually lead, and then assets move. This is the trend I am looking forward to, especially observing the price movements of ETH over the past month and their positive impact on fundamentals.
Ryan:
Regarding real-world assets, it is interesting to consider how much these assets can grow on Ethereum. We are still in a very early stage; although this growth is worth celebrating, moving from almost 0% to $7 billion is still insignificant compared to the total scale of all real-world assets. Consider markets like government bonds and stocks, where the total scale could reach tens of trillions of dollars, while Ethereum's potential in this area is just beginning to emerge.
The asset management scale on the Ethereum chain has reached an all-time high
Ryan:
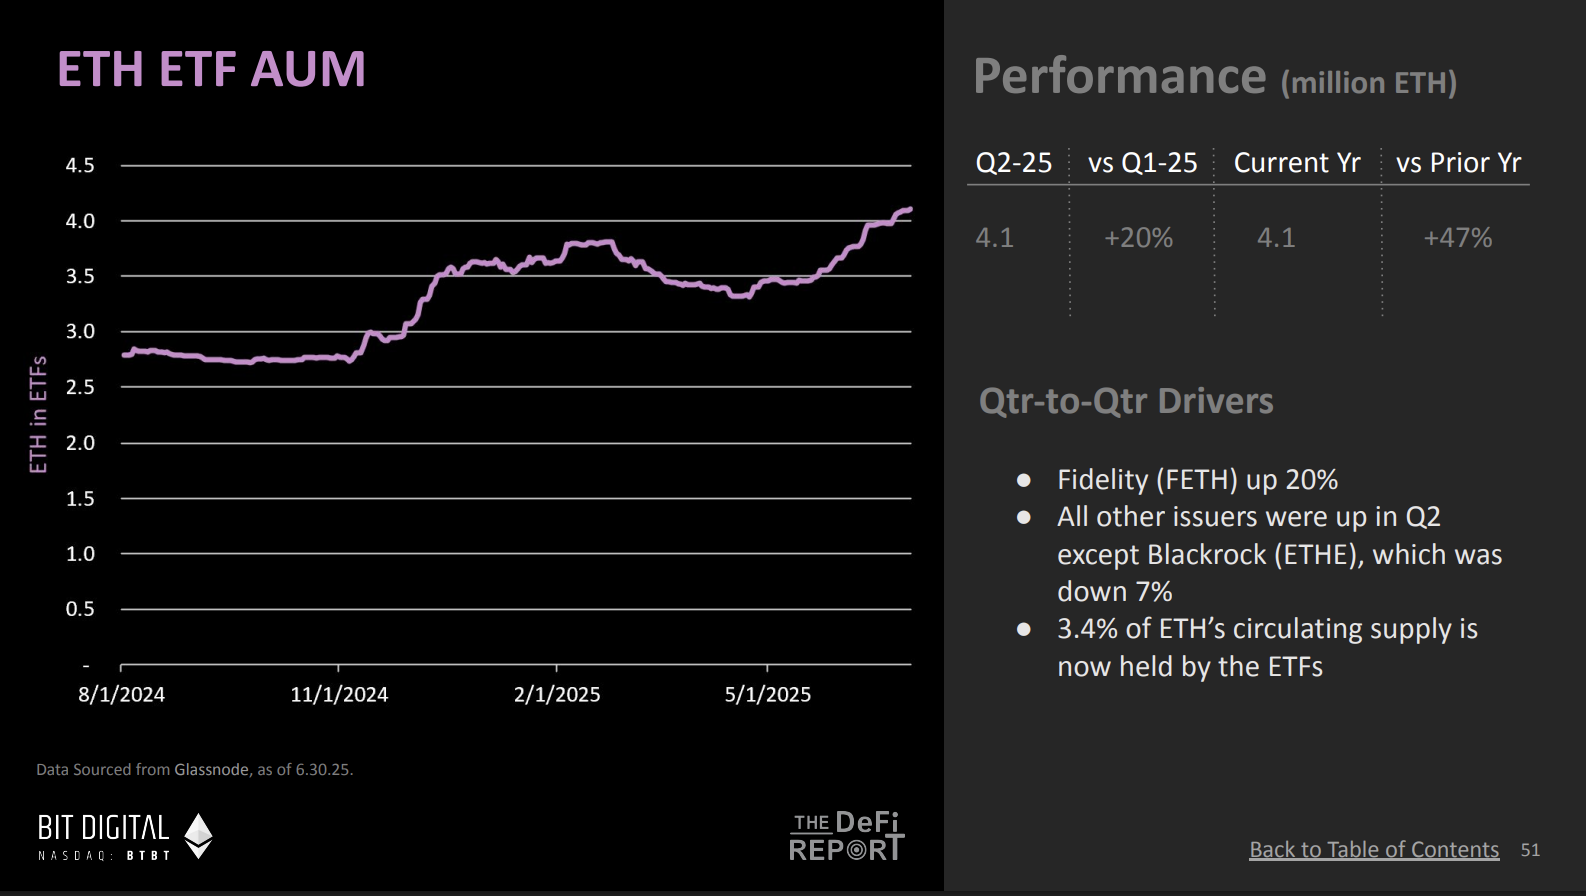
We have analyzed the first three charts reflecting the bull market trend, and now let's look at the fourth chart. It shows the asset management situation on Ethereum. Recently, we have observed very strong inflows into Ethereum, and in fact, at the end of the quarter, the scale of Ethereum's asset management reached an all-time high, right?
(Chart excerpted from The ETH Report - DeFi Report)
Mike:
That's right; this data is as of June 30, and the latest figures show that the scale of Ethereum's asset management has reached 4.11 million ETH, accounting for 3.4% of the total supply. Two weeks later, this ratio further increased to 3.8%, and currently, the total amount of ETH held in ETFs has reached 4.6 million.
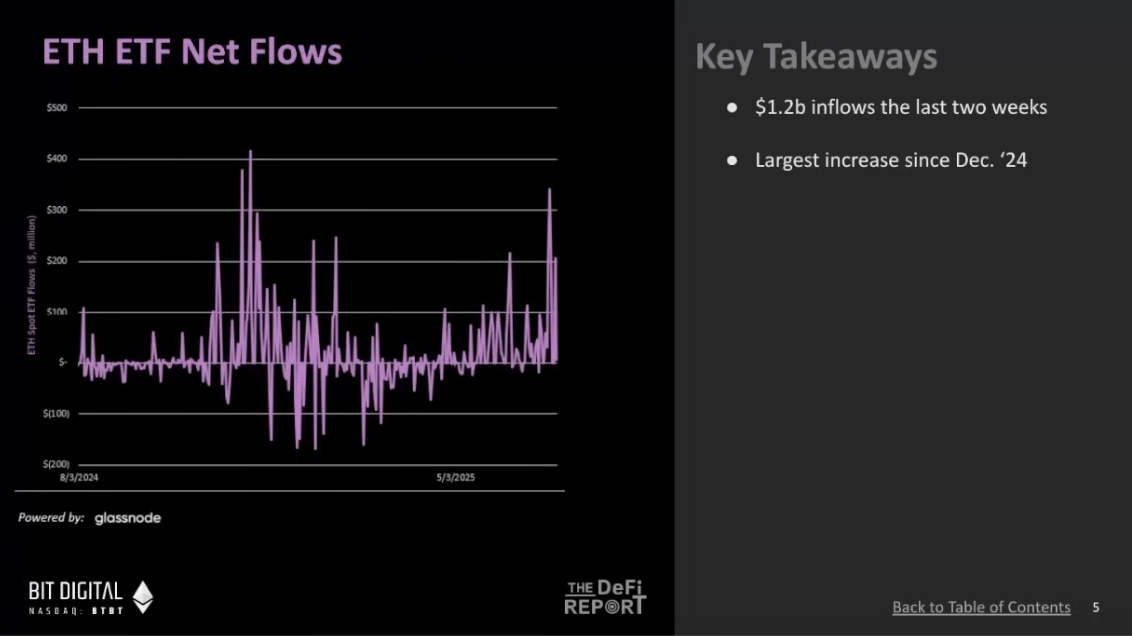
The performance of ETFs has been outstanding. I have some data to illustrate this. Since the establishment of the ETF, net inflows into Ethereum have reached $5.7 billion, which is 20% of the inflow scale of Bitcoin. The net inflow for Bitcoin is $50 billion. Many people are optimistic about the performance of Bitcoin ETFs, believing that inflows in the first year will reach $5 billion to $10 billion, while Ethereum has already surpassed this expectation. Currently, the total asset scale of Ethereum has reached 4.6 million ETH, equivalent to about $13 billion. In recent weeks, the inflow scale has increased by $1.2 billion. From the net inflow trend chart, our inflow volume is already close to last year's fourth-quarter level, and the performance of the ETF is indeed impressive.
(Chart excerpted from The ETH Report - DeFi Report)
Ryan:
It seems that institutional investors' interest in Ethereum is rapidly growing. Tom Lee has stated that Ethereum could be "the next Bitcoin," and he is trying to prove this possibility. If the inflow pattern of Bitcoin ETFs can be replicated in Ethereum, what would that look like?
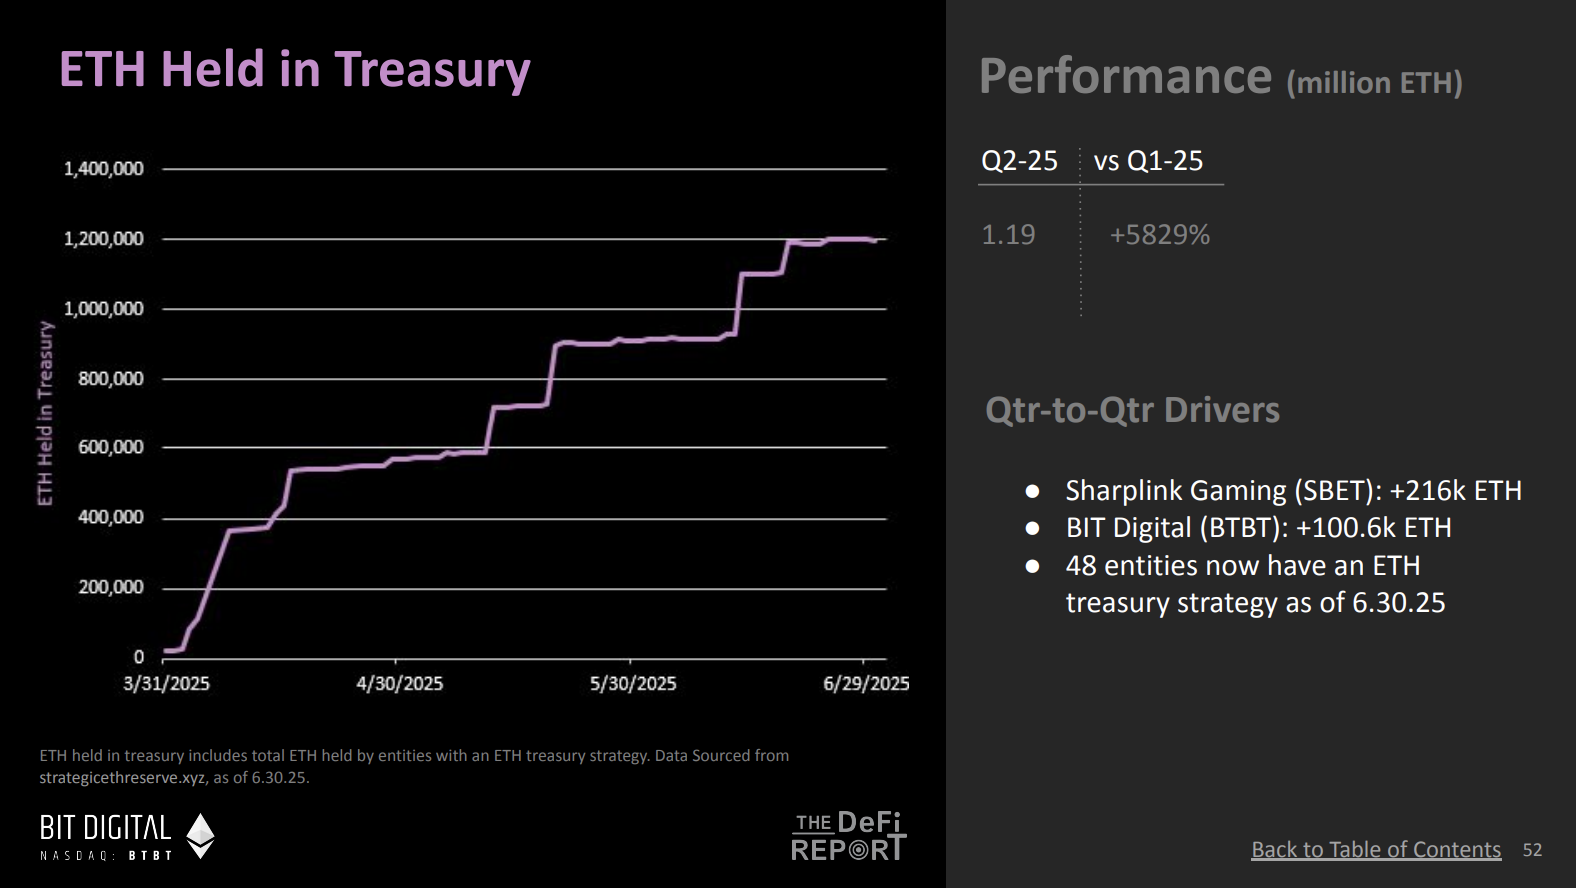
This is a new trend in the second quarter, but in the third quarter, the number of Ethereum held in treasuries continues to maintain momentum. If I understand correctly, this holding has almost increased by 6000%. Most of this is in public treasuries, where investors can purchase these assets through the U.S. capital markets.
(Chart excerpted from The ETH Report - DeFi Report)
Mike:
This trend has clearly gained more attention under Tom Lee's influence. For example, Bit Digital increased its holdings by about 100,000 ETH while selling all their Bitcoin. This is a very noteworthy phenomenon. You can also see Joe Lubin promoting Ethereum on CNBC, essentially advocating for this token.
This is very important. I believe this point has not been widely discussed. Bitcoin has done better in this regard; for instance, Michael Saylor talks about Bitcoin almost every day on television and podcasts while continuously purchasing assets. And now, we see the Ethereum community taking similar actions. This market change cannot be ignored, and I think this is another bullish signal.
Ryan:
I believe this shift indicates that Ethereum is striving to overcome barriers to become a value storage asset similar to Bitcoin. Bitcoin took over a decade to break through this limitation. Ultimately, this shift was largely completed in 2020 when Michael Saylor began purchasing Bitcoin on a large scale and persuading others to do the same. Therefore, perhaps Ethereum is undergoing a similar process.
(Chart excerpted from The ETH Report - DeFi Report)
Mike:
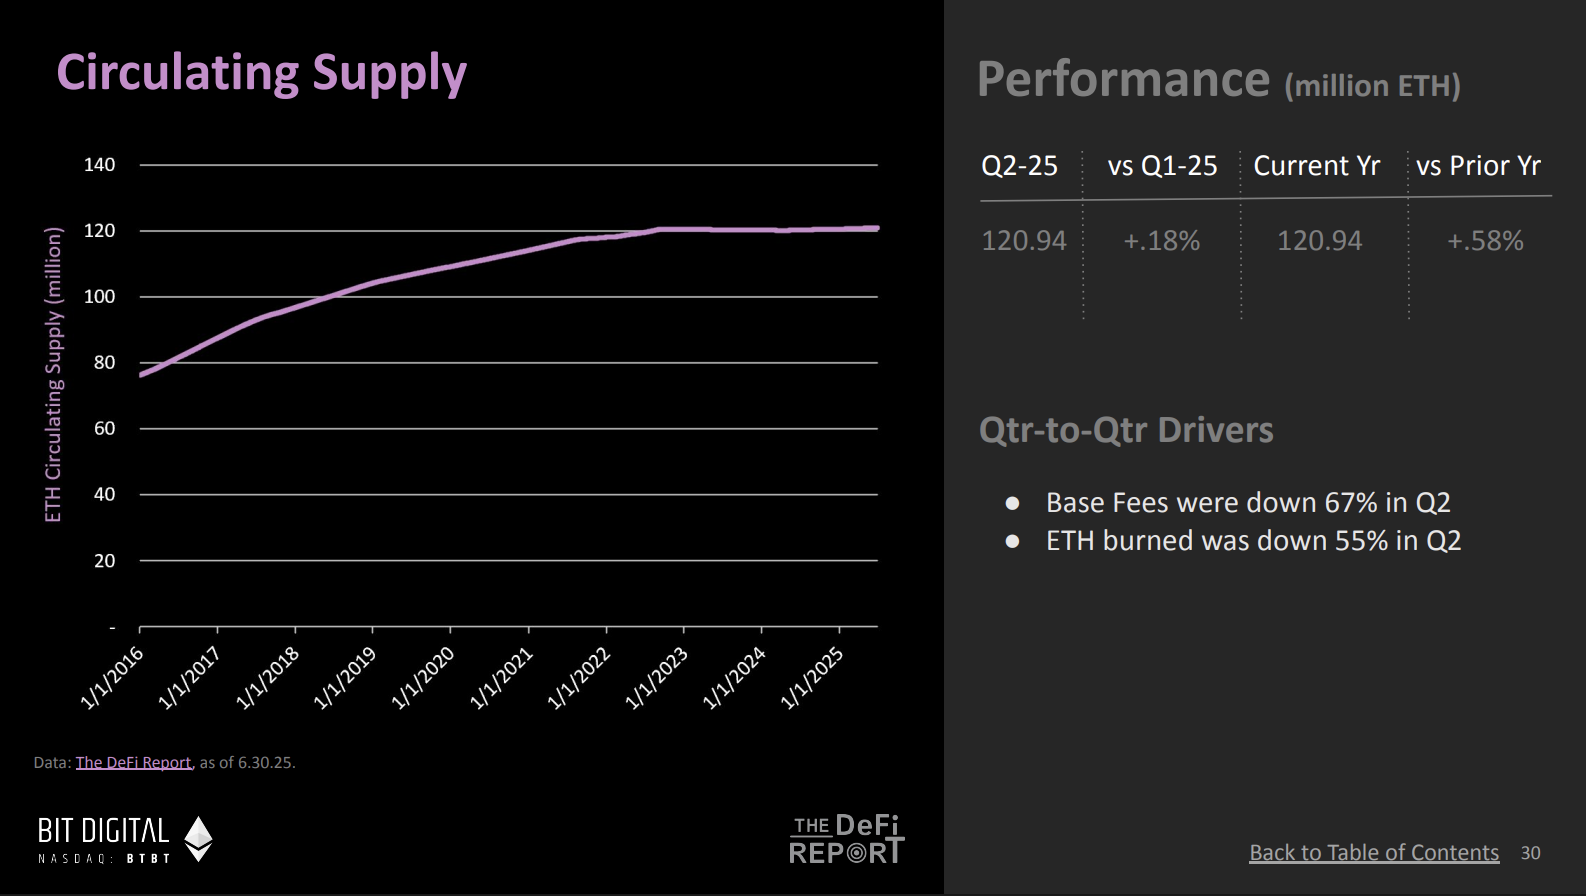
As you mentioned, the potential of Ethereum as a value storage asset is an important investment rationale, and its supply dynamics are closely related to this. For example, in the second quarter of this year, Ethereum's circulating supply grew by only 0.18%, while block fees decreased by 80% during the same period. By burning block fees and base fees, Ethereum's burn mechanism effectively offsets part of the issuance, and these two factors together drive Ethereum's deflationary economics.
From my perspective, this is actually a bullish signal. Despite a significant decline in on-chain economic activity in the second quarter, especially in the context of gas price optimization, Ethereum's supply growth rate remains lower than Bitcoin's inflation level. Even with reduced on-chain activity and ongoing network upgrades, Ethereum's supply dynamics still show strong advantages.
You will find that despite a substantial decline in on-chain activity and ongoing network upgrades, the supply has not exceeded Bitcoin's issuance. This is interesting because now you have what looks like a value storage asset similar to Bitcoin, but we know Ethereum also has yield. Moreover, I believe some applications will be launched before the end of the year that allow for some of the yield to be passed on to ETF holders. So this is interesting; perhaps you have already purchased Bitcoin in the market and invested in Bitcoin ETFs. Now you see this setup and might want to adjust some assets to capture yield if this product becomes available. Therefore, I find this aspect of value storage intriguing because it combines well with the fact of yield, which Bitcoin does not have.
Ryan:
As investors gradually understand this, the trend becomes very attractive. Bitcoin's supply is fixed at a total of 21 million, while Ethereum's annual issuance is fixed but fluctuates to some extent, with a maximum issuance rate of no more than 1.45%. If annualized, this is about 0.45%, lower than Bitcoin's current issuance rate of about 0.85%. In contrast, other value storage assets like gold typically have an annual issuance rate between 1% and 1.5%, depending on the price of gold. This comparison is also very interesting.
Additionally, I want to remind everyone that if you missed the bull market cycle in 2021, Ethereum's monetary policy was not well established at that time. That was before Ethereum's merge, and people had limited understanding of its future monetary policy and issuance mechanism. Looking back, the merge actually occurred after the summer market crash in 2022. Since the merge was completed in September 2022, Ethereum's issuance policy and monetary policy have become more stable and refined. Although Ethereum's monetary policy is not yet as widely recognized as Bitcoin's, it may become easier to understand as this cycle progresses. Furthermore, Ethereum's supply dynamics are also providing advantages for its long-term development, such as reducing supply to optimize the ecosystem.
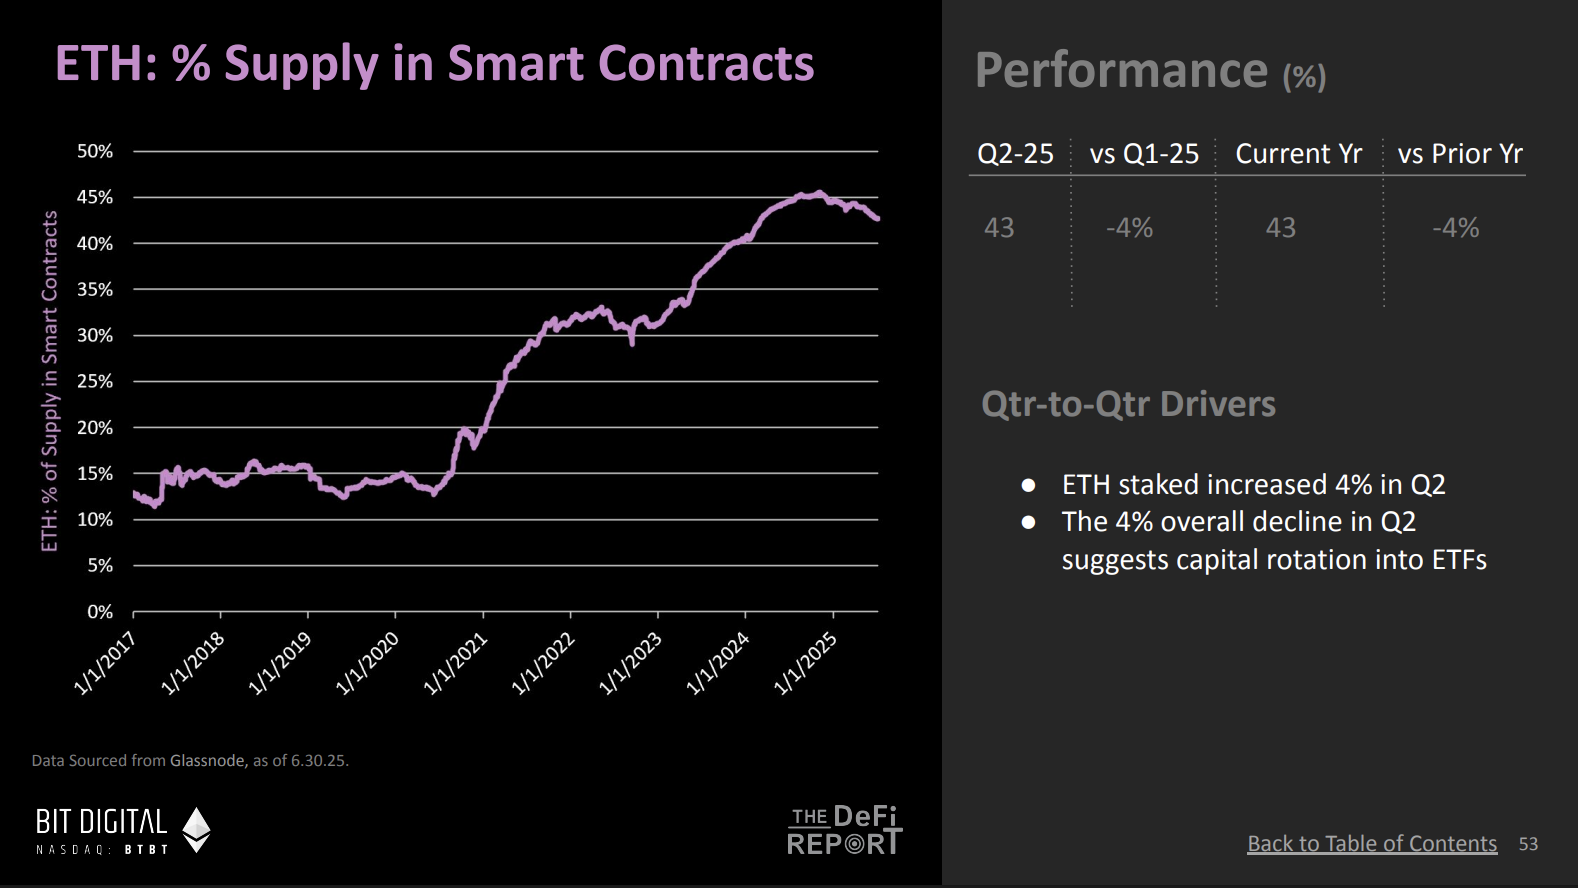
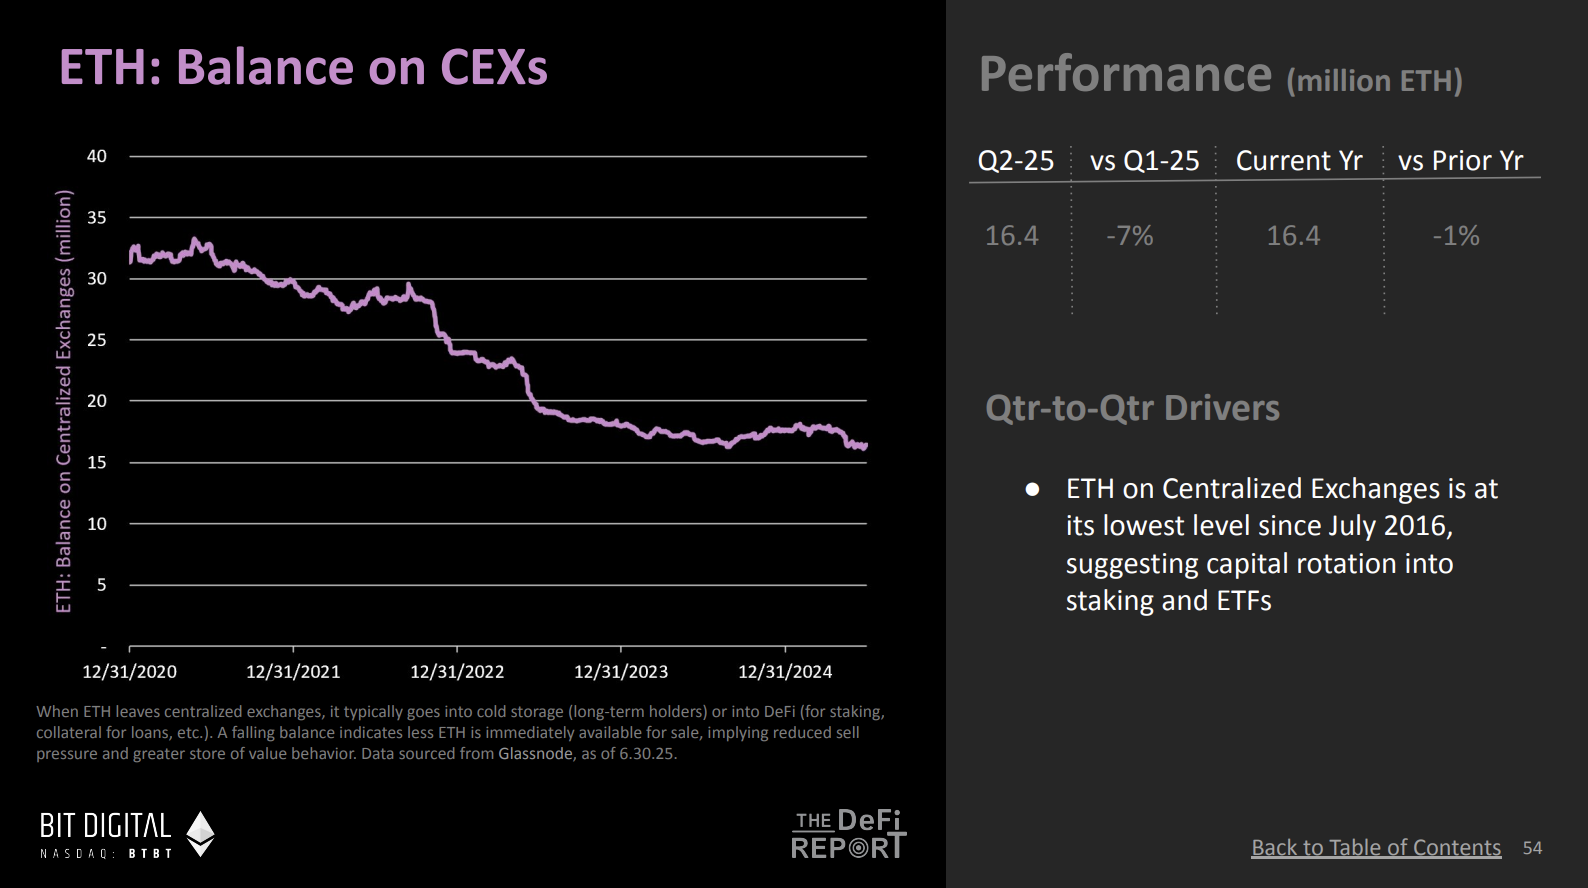
43% of ETH supply is locked in smart contracts, and ETH balances on CEX are at historical lows
Ryan:
**Here is a synchronous indicator regarding Ethereum's supply, revealing an interesting trend. This is the proportion of Ethereum supply locked in on-chain **smart contracts. Although this proportion has decreased compared to the previous two years, we can see an overall upward trend. What does this trend indicate?
(Chart excerpted from The ETH Report - DeFi Report)
Mike:
Yes, this indicates that approximately 43% of ETH supply is currently locked in smart contracts. This means that 43% of the supply on-chain is active. When this line continues to rise over the long term, it usually indicates that users' confidence in putting assets into DeFi, staking contracts, and using protocols is gradually increasing. Therefore, I see this as a bullish signal, indicating that the use cases on-chain are increasing. I expect this proportion to continue to grow in the future.
Ryan:
Another related chart shows that the ETH balance on centralized exchanges is almost at a historical low. This is the lowest level in the past eight years. This indicates that Ethereum's supply is flowing from exchanges to on-chain.
(Chart excerpted from The ETH Report - DeFi Report)
Mike:
This actually echoes the previous chart, reflecting the trend of assets moving from centralized exchanges to on-chain. Users are not only transferring assets on-chain but also putting these assets into staking contracts. To me, this indicates that users are investing capital on-chain, which may mean they are longer-term holders or more inclined to view Ethereum as a value storage asset. If this trend continues, the available assets on centralized exchanges will decrease.
Ryan:
So, regarding the current bullish argument, it can be summarized as follows: First, we see that institutional adoption of Ethereum is increasing, driven by demand growth through stablecoins and real-world assets, and this trend may accelerate further with the Bill's push. Second, institutional demand is becoming evident, reflected in the inflows into Ethereum and the asset allocations of some treasury companies, while this demand is expanding with the promotion from Wall Street figures like Tom Lee and Joseph Lubin. Additionally, Ethereum's supply dynamics are more robust compared to the past, including strengthened monetary policy and extremely low issuance. Finally, the proportion of Ethereum locked in smart contracts is continuously rising, while the trend of outflows from centralized exchanges is also strengthening, all of which further supports the bullish view.
ETH fell below the 200-day moving average, hitting a historical low
Ryan:
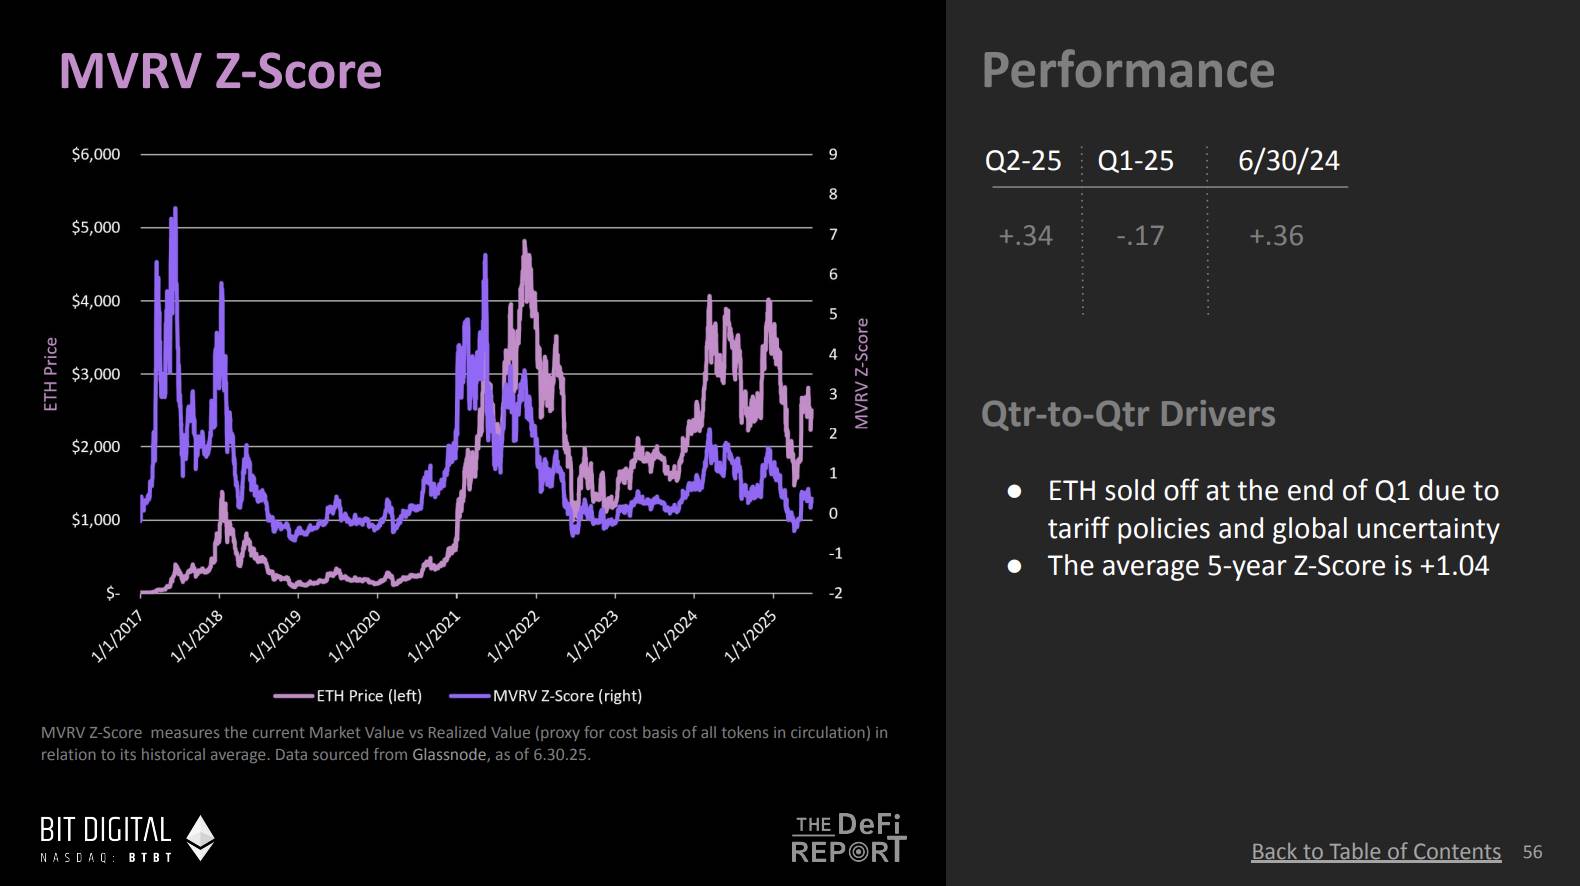
This raises the question that all investors are concerned about: Is now a good time to buy? A few months ago, the price was around $15, and now it is close to $30. Have people missed the best buying opportunity? What is the reasonable market value of this asset? What do you think about this issue? What does the MVRV Z score tell us?
(Chart excerpted from The ETH Report - DeFi Report)
Mike:
The MVRV metric measures the ratio of market value to realized value, and we used data from Glassnode. Glassnode's analysis is primarily based on on-chain wallet data, so it does not include assets in ETFs or on exchanges. It calculates the cost basis of tokens in these wallets and compares it to the historical average cost basis of the network.
At the end of the quarter, the MVRV Z score was about 0.3, indicating the current price's distance from the historical standard deviation, while the five-year average is around 1. Therefore, at the end of the quarter, the asset's price appeared reasonable. In recent weeks, the price has risen, and the MVRV Z score has increased to 0.8, approaching the five-year historical standard. But as the chart shows, this metric can highlight some ideal buying opportunities, while during overheated markets, the market value often far exceeds the historical average cost basis of the network tokens. Therefore, even at current levels, this still represents a decent price range from a historical perspective.
Ryan:
**So now the MVRV Z score is 0.8, while 1.04 is the five-year historical average, right? We have also seen this score far exceed 1 during **bull markets, even reaching 2 or 3. At what point do you think the MVRV metric will start to indicate that the market is overheated? It hasn't reached that yet, but when the score hits 2 or 3, would you consider that a signal that the market is entering an irrational state?
Mike:
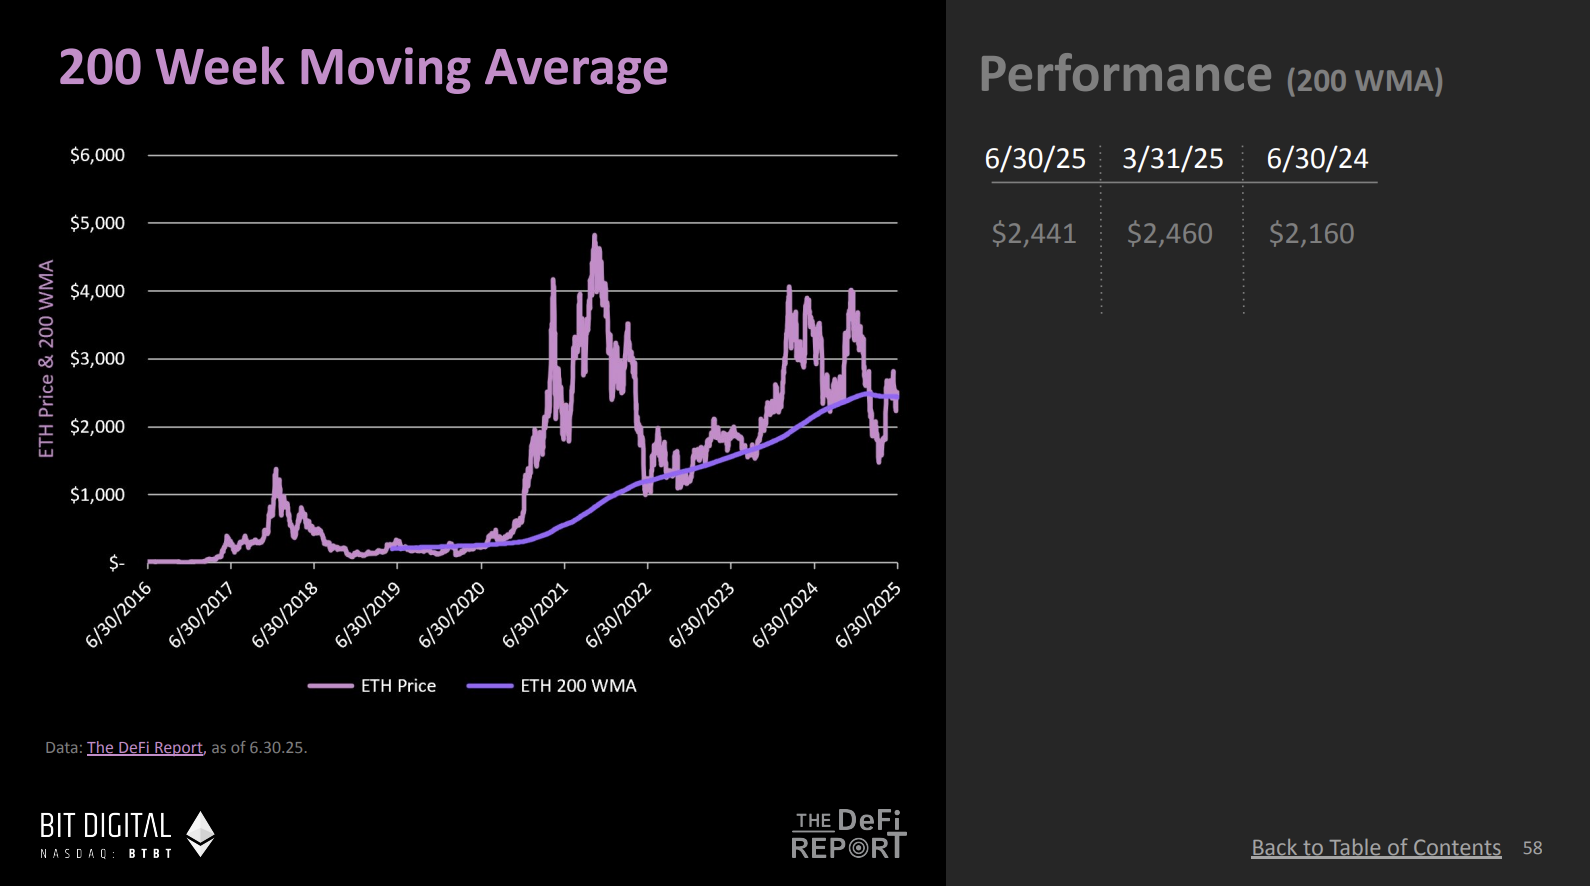
I think this needs to be considered in conjunction with multiple factors, and MVRV is one of them. We also have a chart showing the 200-week moving average, which is another important reference indicator. As of now, the MVRV Z score is 0.8, and with the significant price increase over the past two to three months, short-term indicators may show that the market is slightly overheated, so we might see a price correction. However, from a long-term perspective, the current price range still falls within a reasonable value range.
We also pay attention to another indicator, the 200-week moving average. Typically, when the price approaches the 200-week moving average, the market tends to bottom out. Earlier this year, during a significant sell-off, we even fell below the 200-week moving average, hitting a historic low.
(Chart excerpted from The ETH Report - DeFi Report)
Ryan:
The price fell below the 200-week moving average.
Mike:
Yes, it did. This drop is the largest below the 200-week moving average, and it looks like a generational buying opportunity. After that, the price rebounded from this point and is currently just above the 200-week moving average, with the current price around $20,500. Although the price has started to slightly deviate from this line, as the chart shows, prices during bull markets typically far exceed this purple line, and we have not yet reached that stage.
Comparison of Market Cap and TVL, and Bull Market Data Models
Ryan:
Another indicator worth paying attention to is the comparison of market cap to TVL. I think this indicator may not have received enough attention. Why do you think investors should focus on it?
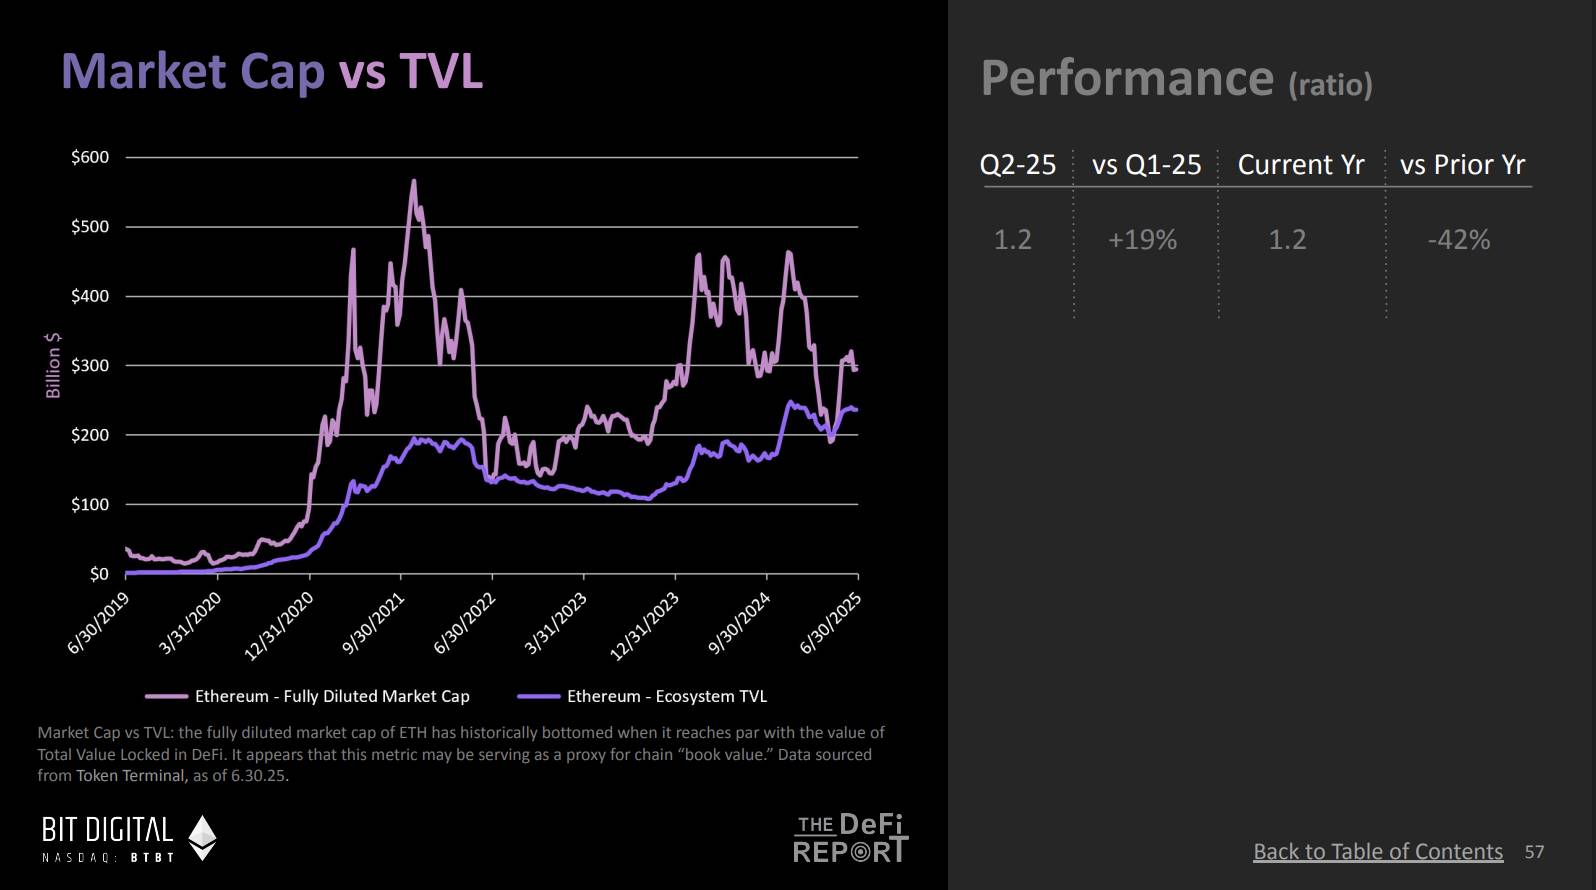
(Chart excerpted from The ETH Report - DeFi Report)
Mike:
This is a very valuable indicator, and thanks to Token Terminal for providing data support. This indicator reflects the total value locked (TVL) in the entire ecosystem, covering not only the TVL of decentralized finance (DeFi) but also the locked value of stablecoins. Therefore, it is a more comprehensive figure for assessing the overall health of the blockchain ecosystem.
We observe that during bear markets, market value often reverts to the level of the ecosystem's TVL. This phenomenon is somewhat similar to the "book value" in traditional finance, which refers to the intrinsic value of an asset. We have been trying to understand these comparative indicators related to DeFi, and the relationship between market cap and TVL can be seen as the "book value" in the blockchain space. Interestingly, whenever the price falls back to the so-called "book value" (TVL), the market tends to experience a strong rebound.
Ryan:
I did some mathematical extrapolation on Twitter regarding the bull market, assuming that Ethereum's TVL could grow to $1 trillion, while Ethereum's current market cap is about $300 billion. Do you think this scenario is possible?
Mike:
Based on current trends, such growth is possible.
Ryan:
Considering the rapid growth of stablecoins, this scenario is entirely feasible. Assuming the locked value of stablecoins reaches $500 billion, plus the locked value of real-world assets at $100 billion, while the value of all crypto-native assets also increases, we can arrive at the $1 trillion target through some simple calculations. If we multiply this number by a higher TVL multiple, say 2.5, then Ethereum's price could reach $20,000. That’s the logic behind this mathematical model.
Of course, we cannot yet determine how much TVL will ultimately be deployed on Ethereum, but this model tells a story worth paying attention to. Particularly the relationship between market cap and TVL; this purple line could become a key indicator in this bull market.
Mike:
It is indeed very interesting. With the massive influx of stablecoins into the market, this lays the groundwork for the bear market. Therefore, continuously tracking the relationship between market cap and TVL will be very important. This is also a good way to think about potential valuations, as the value on-chain could significantly increase with more assets entering the blockchain ecosystem.
Performance and Yield of ETH L2, Comparison of Bear and Bull Markets
Ryan:
Mike, I have another question. Your report includes some charts that tell different stories, and although we haven't discussed them today, I would like to hear your overall thoughts. Do you think these charts can be interpreted in a bullish or bearish way?
In the report, I noticed that Ethereum's fee revenue, including MEV (Maximum Extractable Value) revenue, is generally on a downward trend. Compared to the last bull market cycle, Ethereum's actual earnings have decreased. Part of the reason is that Ethereum expanded the supply of block space through the Petra upgrade. While changes on Layer 1 are minimal, the block space on Layer 2 has significantly increased. However, this has led to Layer 2's earnings not meeting expectations. Some believe that the expansion of Layer 2 has "siphoned" usage, business, MEV, and fees from the Ethereum mainnet, creating a "parasitic effect." From this perspective, it could be a bearish signal, as the decline in assets and real earnings may raise concerns about Ethereum's prospects.
Of course, there is also a more bullish view that these upgrades have actually enhanced the efficiency and productivity of the Ethereum network. We see significant growth in Layer 2 usage. Not only have active addresses and transaction volumes increased, but the number of users and transaction frequency are also on the rise. While the fees paid by users have decreased, this could be a good thing, as lower fees can attract more users, further solidifying the network effect of the EVM (Ethereum Virtual Machine). This network effect is expected to translate into more revenue in the future and broader use of Ethereum as a value storage asset. This is a more optimistic view, suggesting that the Layer 2 strategy is working, compensating for the lack of revenue through widespread adoption of the network, attracting more users, and promoting Ethereum's value storage capabilities.
When prices rise, people often think that the "bull market view is correct"; when the ETH price drops to $300, everyone questions whether the entire concept of Layer 2 has failed. How do you view this issue? When weighing the bullish and bearish perspectives on Layer 2 data and Ethereum's earnings, what is your opinion?
Mike:
This is a very important topic. I believe Ethereum's roadmap is progressing as planned. The growth and value of Layer 2 have become very evident. For example, why has Coinbase now launched Layer 2? Because it benefits their business. The same goes for Robinhood; their choices also validate the value of Layer 2.
In my view, while Ethereum is not a traditional business project, it is indeed a product that requires widespread adoption by users. As long as the product meets market demand, it creates what is known as "product-market fit." This is a key point. Any entrepreneur knows that the first step is to find product-market fit, then adjust pricing strategies and establish competitive advantages. Ethereum is currently at this stage. With the widespread adoption of Layer 2, if Ethereum can provide quality services to these Layer 2 solutions and build strong network effects, I believe the market will gradually self-adjust.
Therefore, my view is that while current earnings have declined, Ethereum is undergoing a transitional period. If it can maintain product-market fit, there will be opportunities to adjust pricing strategies and further enhance value in the future. We may discuss the development path of native Rollups specifically in the future, as this is a topic worth exploring in depth. The key lies in the execution power of the Ethereum Foundation and the community to find a balance that allows sufficient value to flow to Ethereum while validating the interests of ETH holders.
Ryan:
We may still be in the early stages of ETH price rotation, and of course, it is still uncertain. The price has not yet reached a level sufficient to validate this, so it remains an observation phase.
免责声明:本文章仅代表作者个人观点,不代表本平台的立场和观点。本文章仅供信息分享,不构成对任何人的任何投资建议。用户与作者之间的任何争议,与本平台无关。如网页中刊载的文章或图片涉及侵权,请提供相关的权利证明和身份证明发送邮件到support@aicoin.com,本平台相关工作人员将会进行核查。


