The 1-hour BTC/USD chart illustrates a short-term recovery following a recent sell-off, underscored by a succession of higher lows and strong green candles. Bitcoin found solid support at $107,471 and is testing near-term resistance around $109,711. Volume surges have accompanied these moves, reinforcing bullish momentum. Traders are finding entry points between $108,000 and $108,500 during minor dips, targeting exits as resistance nears $109,500 to $110,000. This signals a potential for short-term breakouts if buying pressure holds.
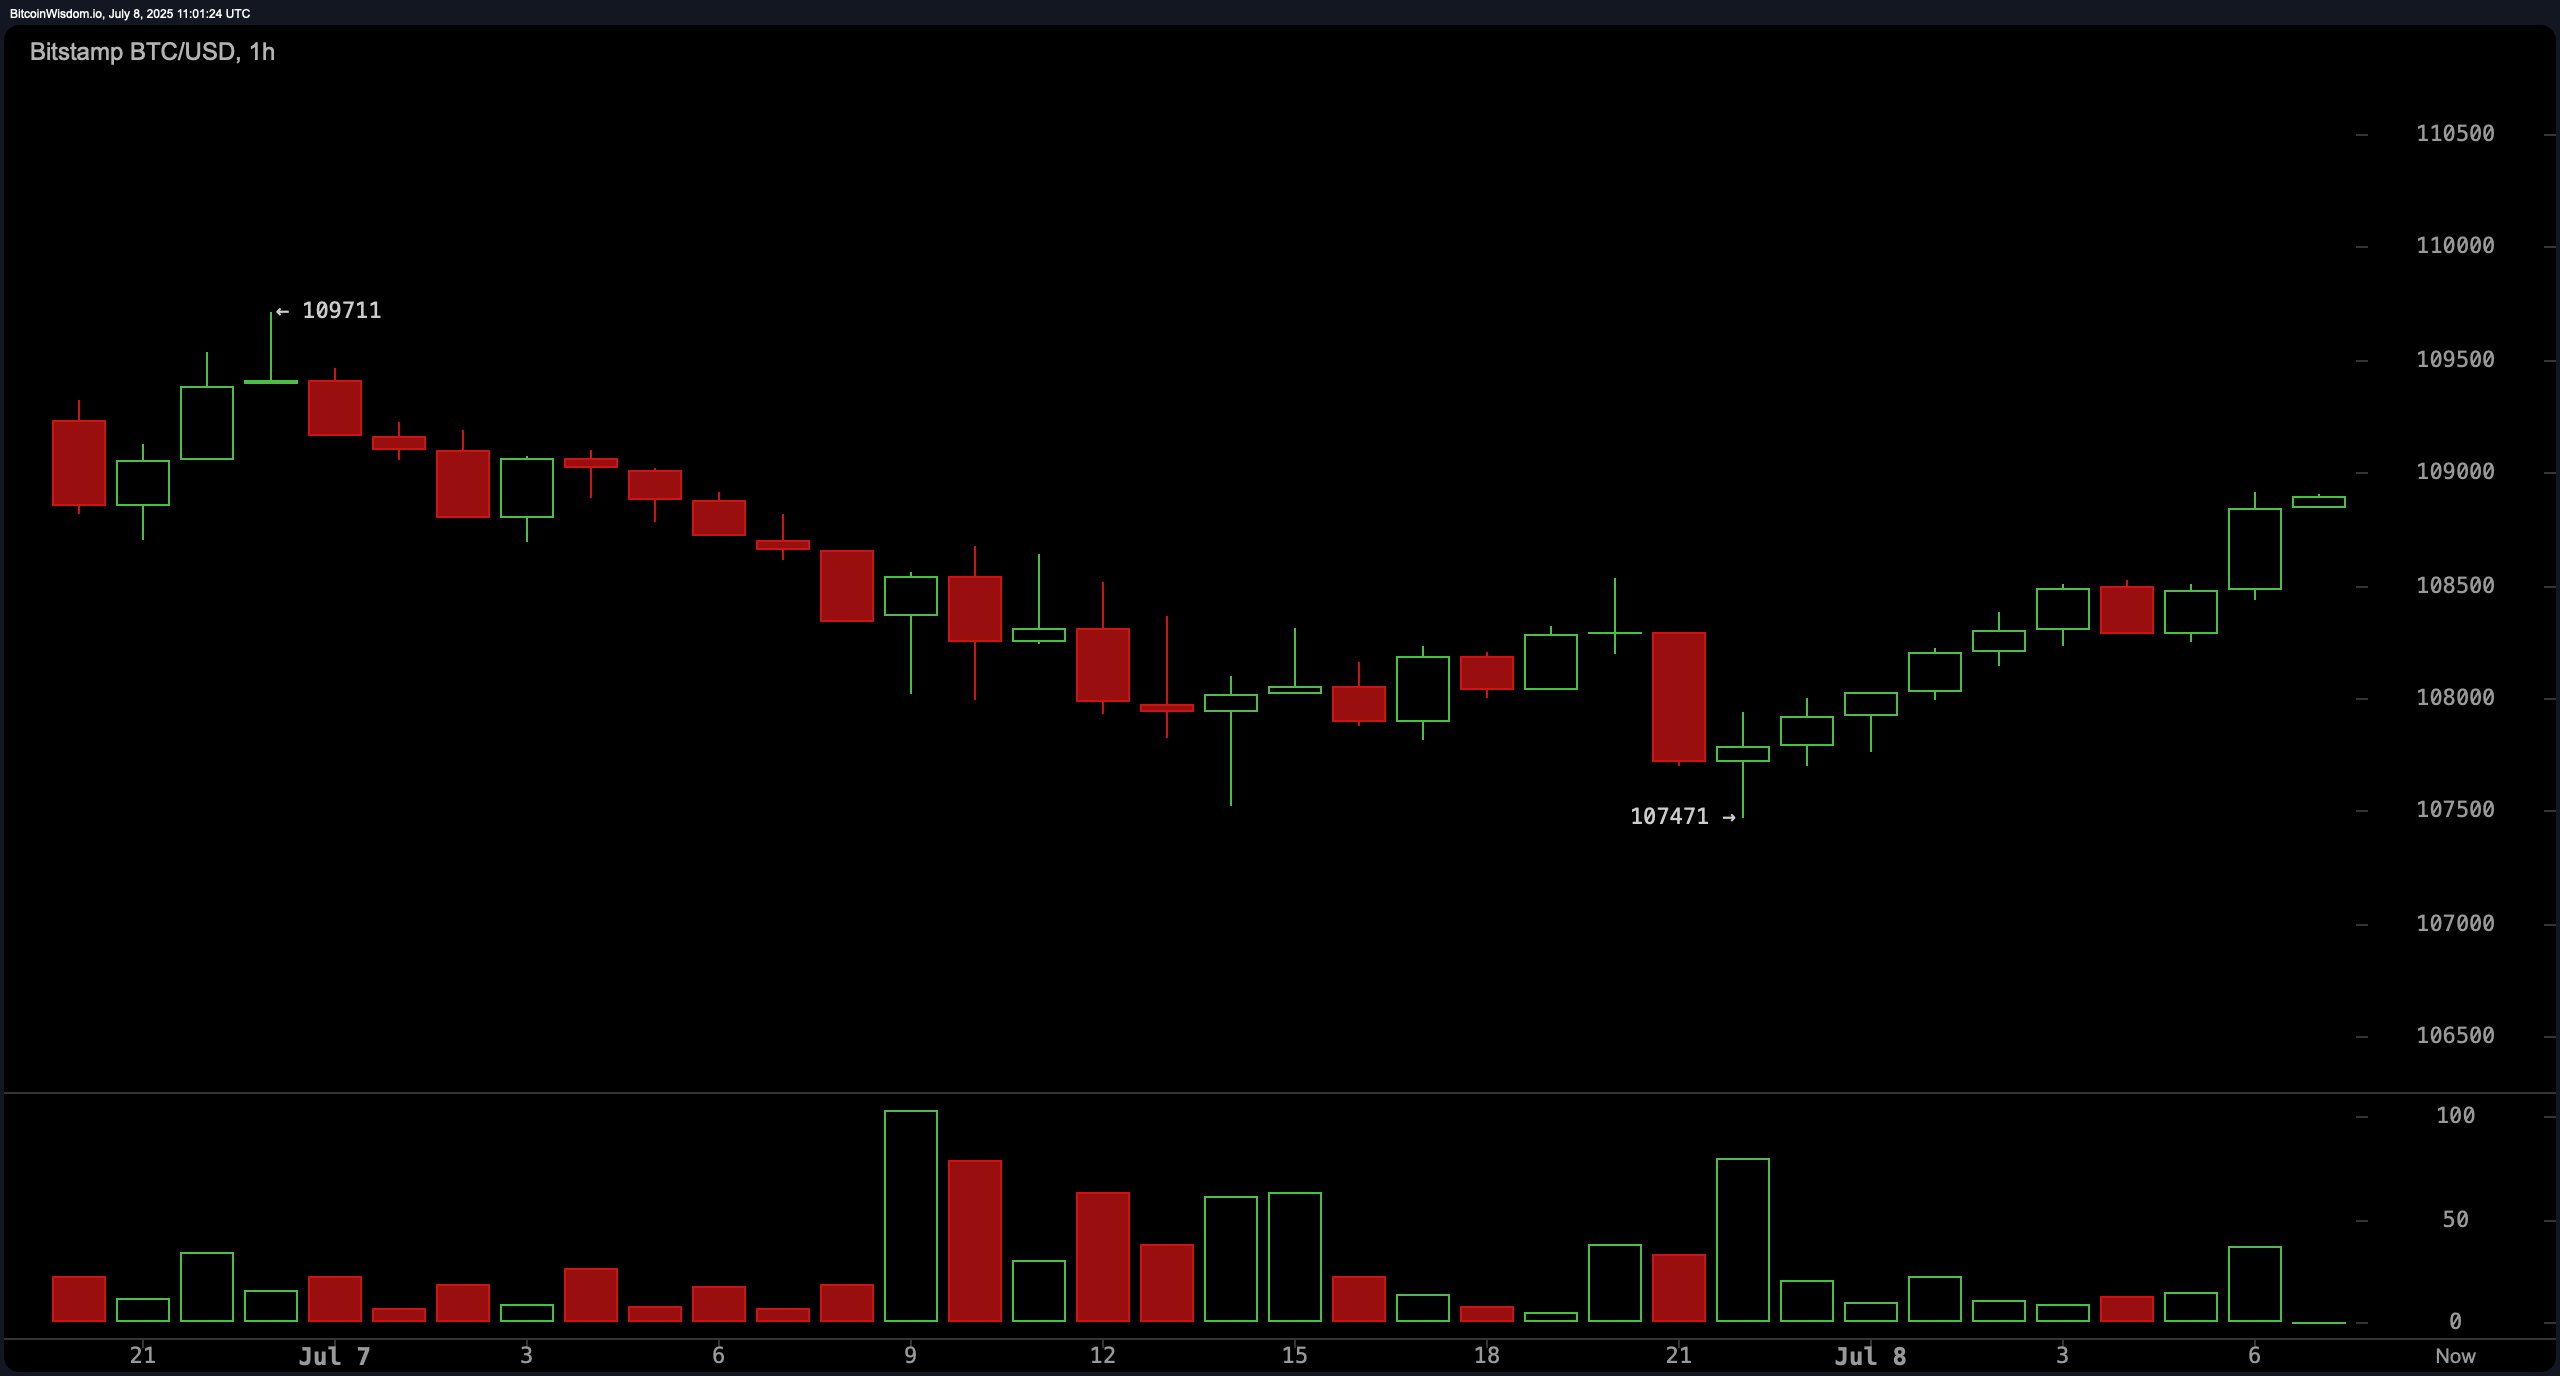
BTC/USD 1-hour chart via Bitstamp on July 8, 2025.
On the 4-hour chart, bitcoin appears to be consolidating with a slight bullish tilt. The price is coiling between support at $107,238 and resistance at $110,557. Candle formations from July 5 to July 7 showed market indecision, but the recent attempt to break out signals an underlying upward bias. A retest of $108,000 with robust volume would validate a mid-range long position, while exit levels are identified between $109,800 and $110,500 should momentum fade.
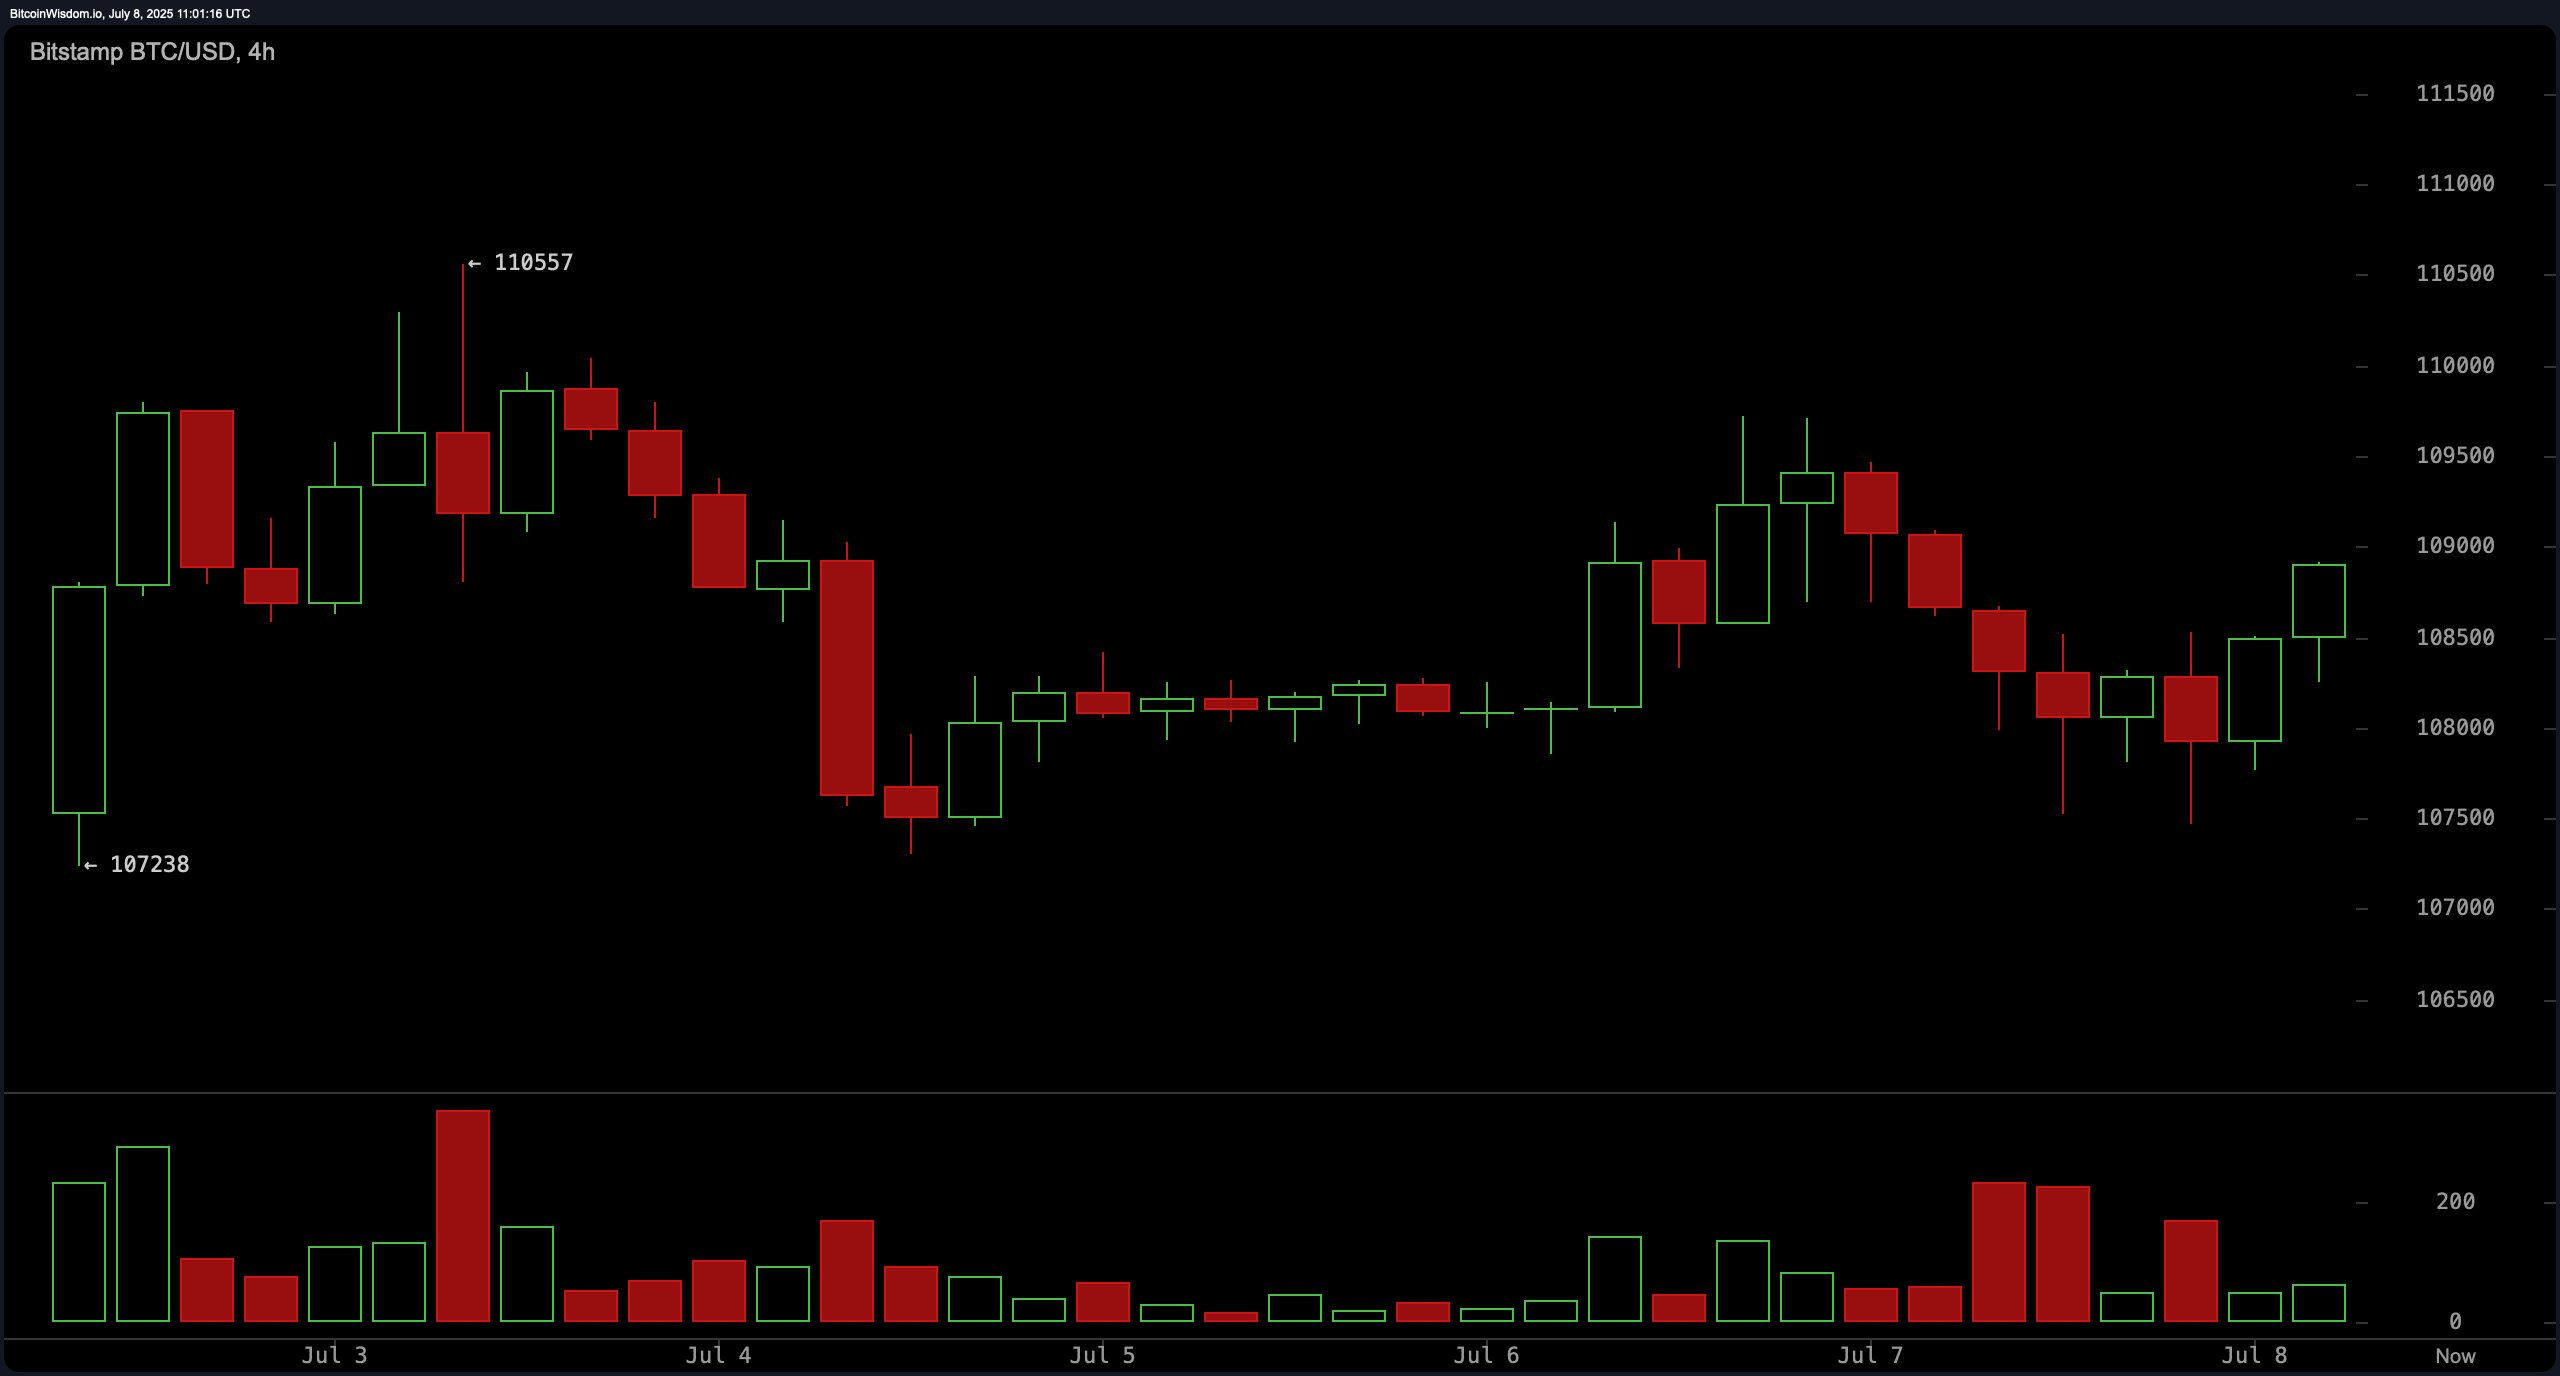
BTC/USD 4-hour chart via Bitstamp on July 8, 2025.
From a macro perspective, the daily chart shows bitcoin recovering from its $98,240 bottom. The trajectory remains upward, albeit choppy, with buyers stepping in near the $104,000 to $105,000 support zone during late June. The key resistance at $110,587 remains unbroken, and traders are closely watching for a sustained move above $108,000 to confirm a bullish continuation. Exiting between $110,000 and $111,000 may offer prudent gains near historical resistance levels.
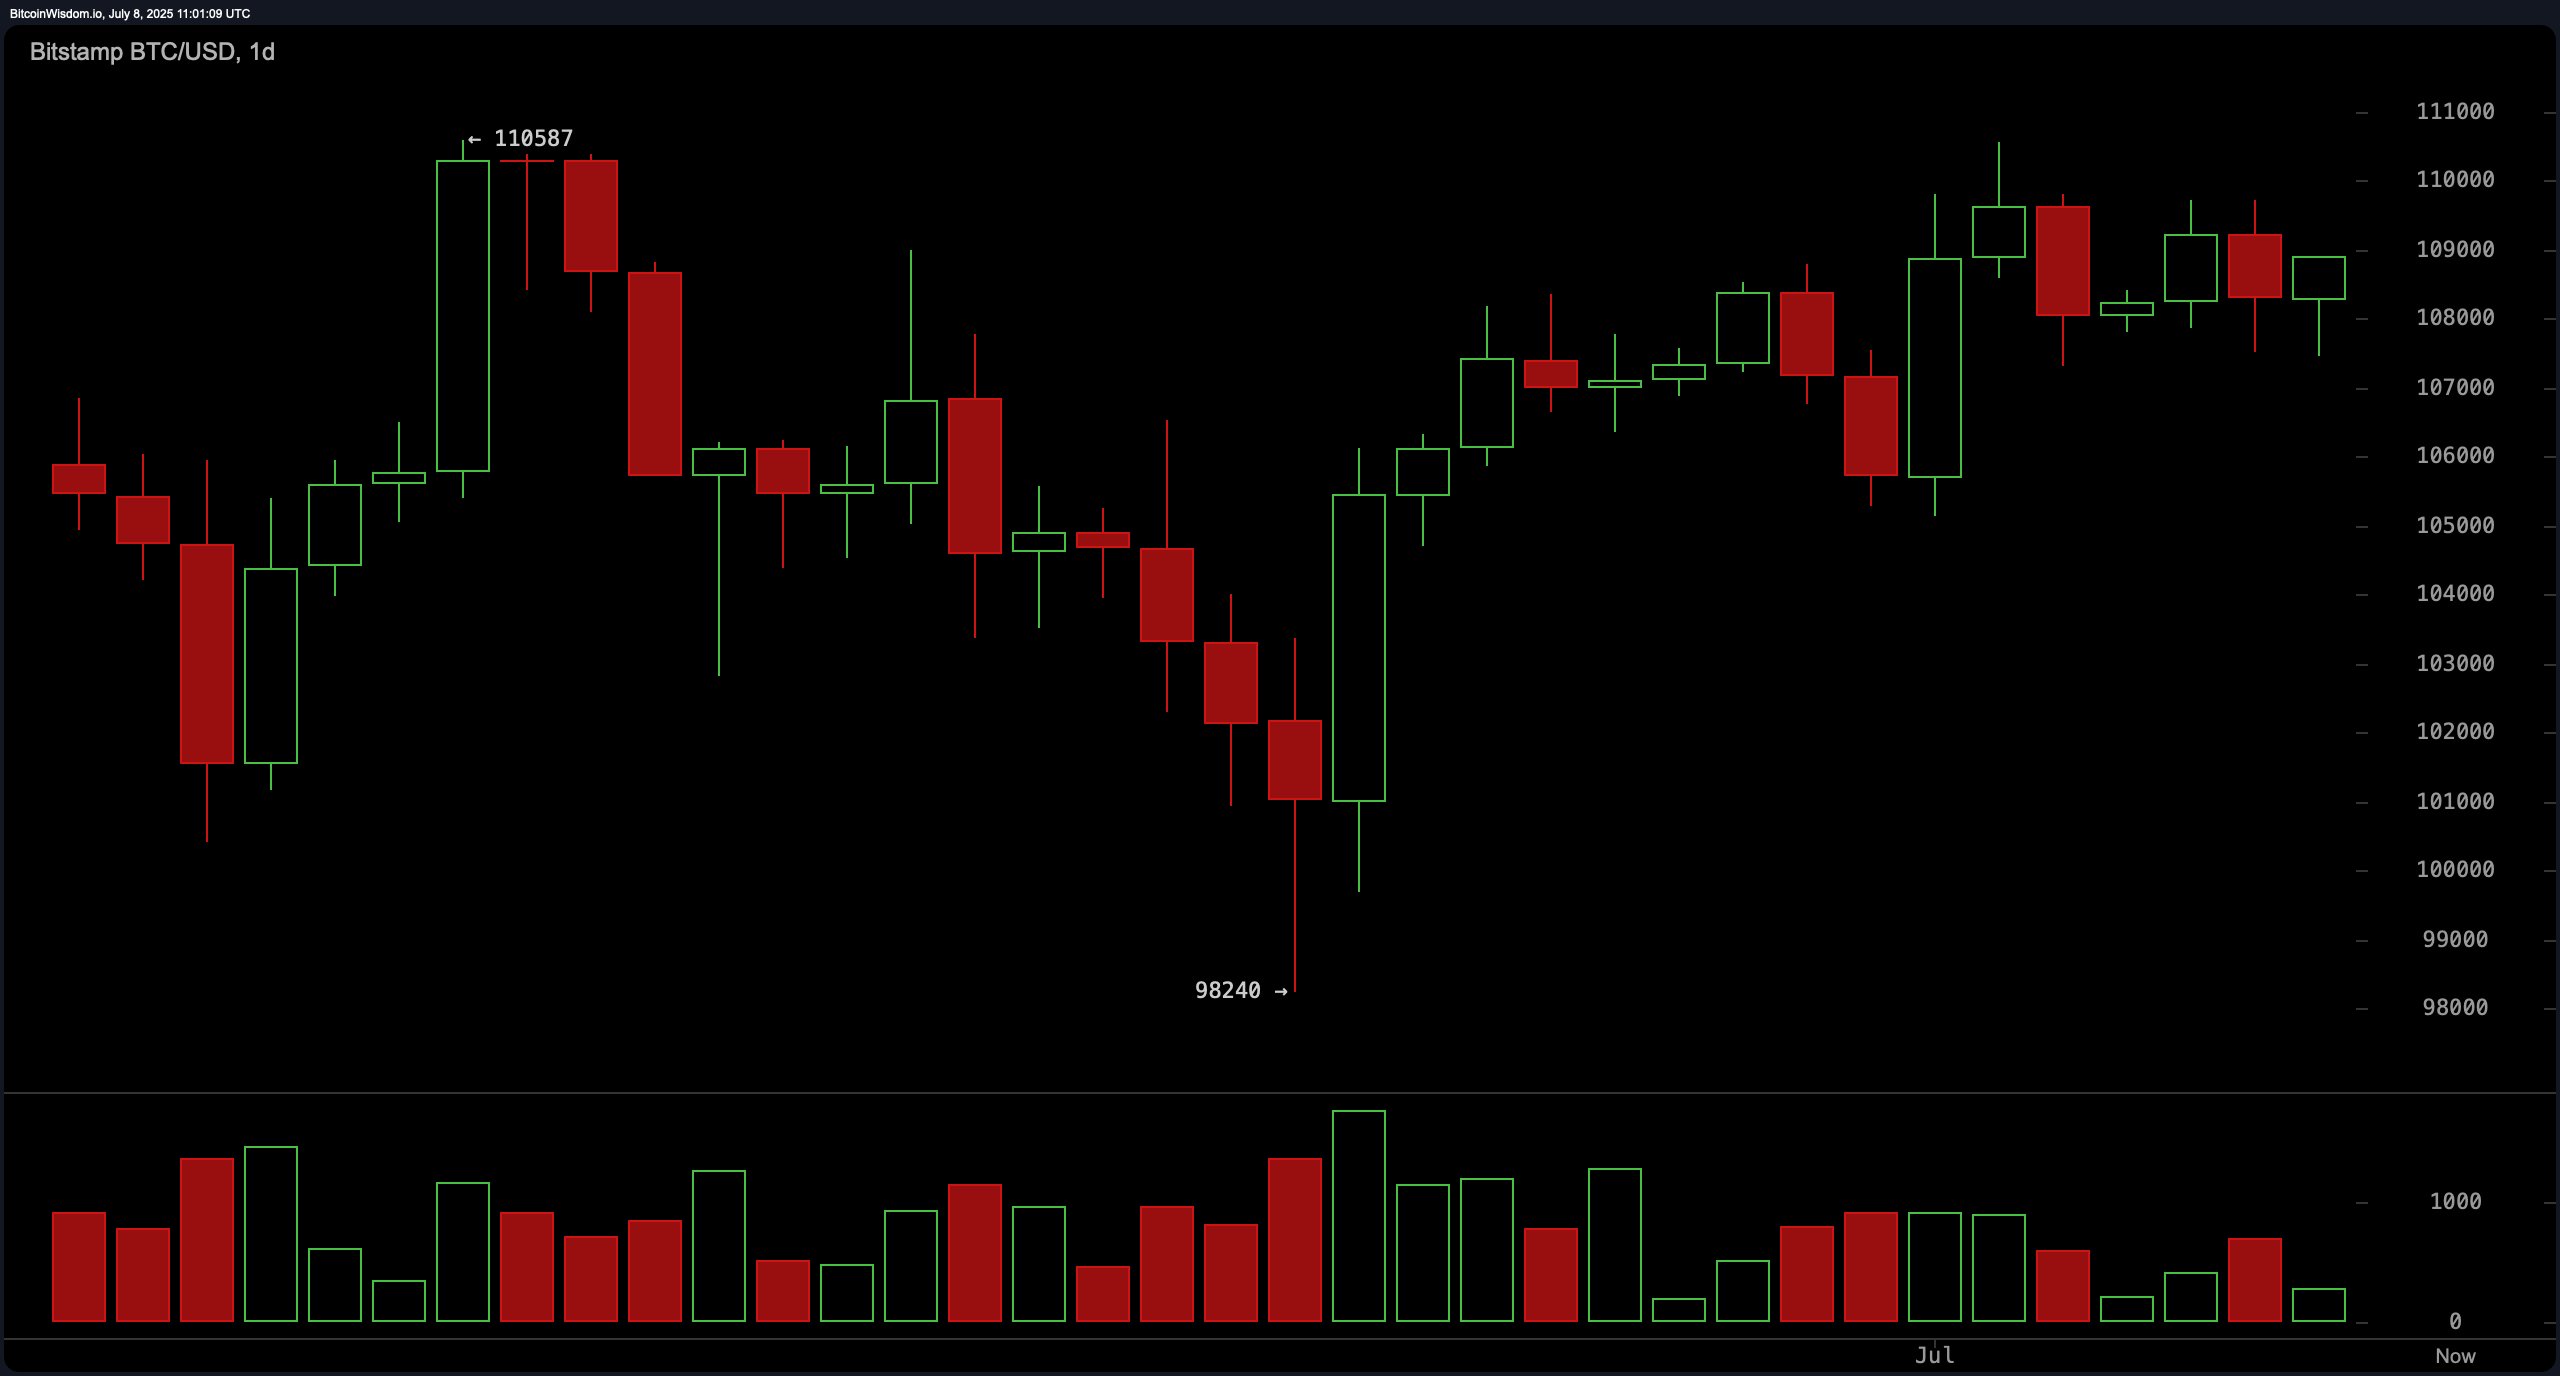
BTC/USD 1-day (24H) chart via Bitstamp on July 8, 2025.
Oscillator readings present a neutral-to-slightly-bullish sentiment. The relative strength index (RSI) stands at 56, Stochastic at 73, commodity channel index (CCI) at 65, and average directional index (ADX) at 9—all indicating neutrality. However, the momentum indicator shows a value of 1,494 (bullish signal), and the moving average convergence divergence (MACD) level is 926 (bullish signal), both suggesting the potential for continued upside.
Moving averages (MAs) further reinforce the bullish stance. All major short- and long-term averages—from the exponential moving average (EMA) and simple moving average (SMA) of 10 to 200 periods—show buy signals. These include the EMA (10) at $108,153, SMA (20) at $106,705, EMA (50) at $105,314, and SMA (200) at $96,521, providing strong technical support across timeframes. Together, these indicators paint a scenario where bullish momentum may extend, provided the price sustains above key support thresholds.
Bull Verdict:
Bitcoin’s alignment of strong buy signals across all major moving averages, coupled with bullish entries on momentum and the moving average convergence divergence (MACD), suggests favorable conditions for further upside. If price holds above $108,000 and breaks through $109,500 with volume confirmation, the path toward retesting $110,500 to $111,000 appears technically justified.
Bear Verdict:
Despite the bullish bias, multiple oscillators remain neutral, and the market has yet to break key resistance at $110,587. A dip below $107,500 would invalidate the bullish structure and open the door for a downside retest of the $105,000 support zone or lower, particularly if volume dries up and momentum weakens.
免责声明:本文章仅代表作者个人观点,不代表本平台的立场和观点。本文章仅供信息分享,不构成对任何人的任何投资建议。用户与作者之间的任何争议,与本平台无关。如网页中刊载的文章或图片涉及侵权,请提供相关的权利证明和身份证明发送邮件到support@aicoin.com,本平台相关工作人员将会进行核查。


