On the daily chart, bitcoin recently bounced off strong support near $98,240, forming a bullish engulfing pattern that highlights a reversal attempt. The volume spike accompanying this bounce suggests institutional participation, potentially marking a trend shift. However, resistance around $110,587 continues to cap upside momentum. A daily close above $108,500, coupled with sustained volume, could confirm a bullish continuation. For now, traders eye a tight range with long entries targeting $110,000 to $111,000, and stop losses around $104,500.
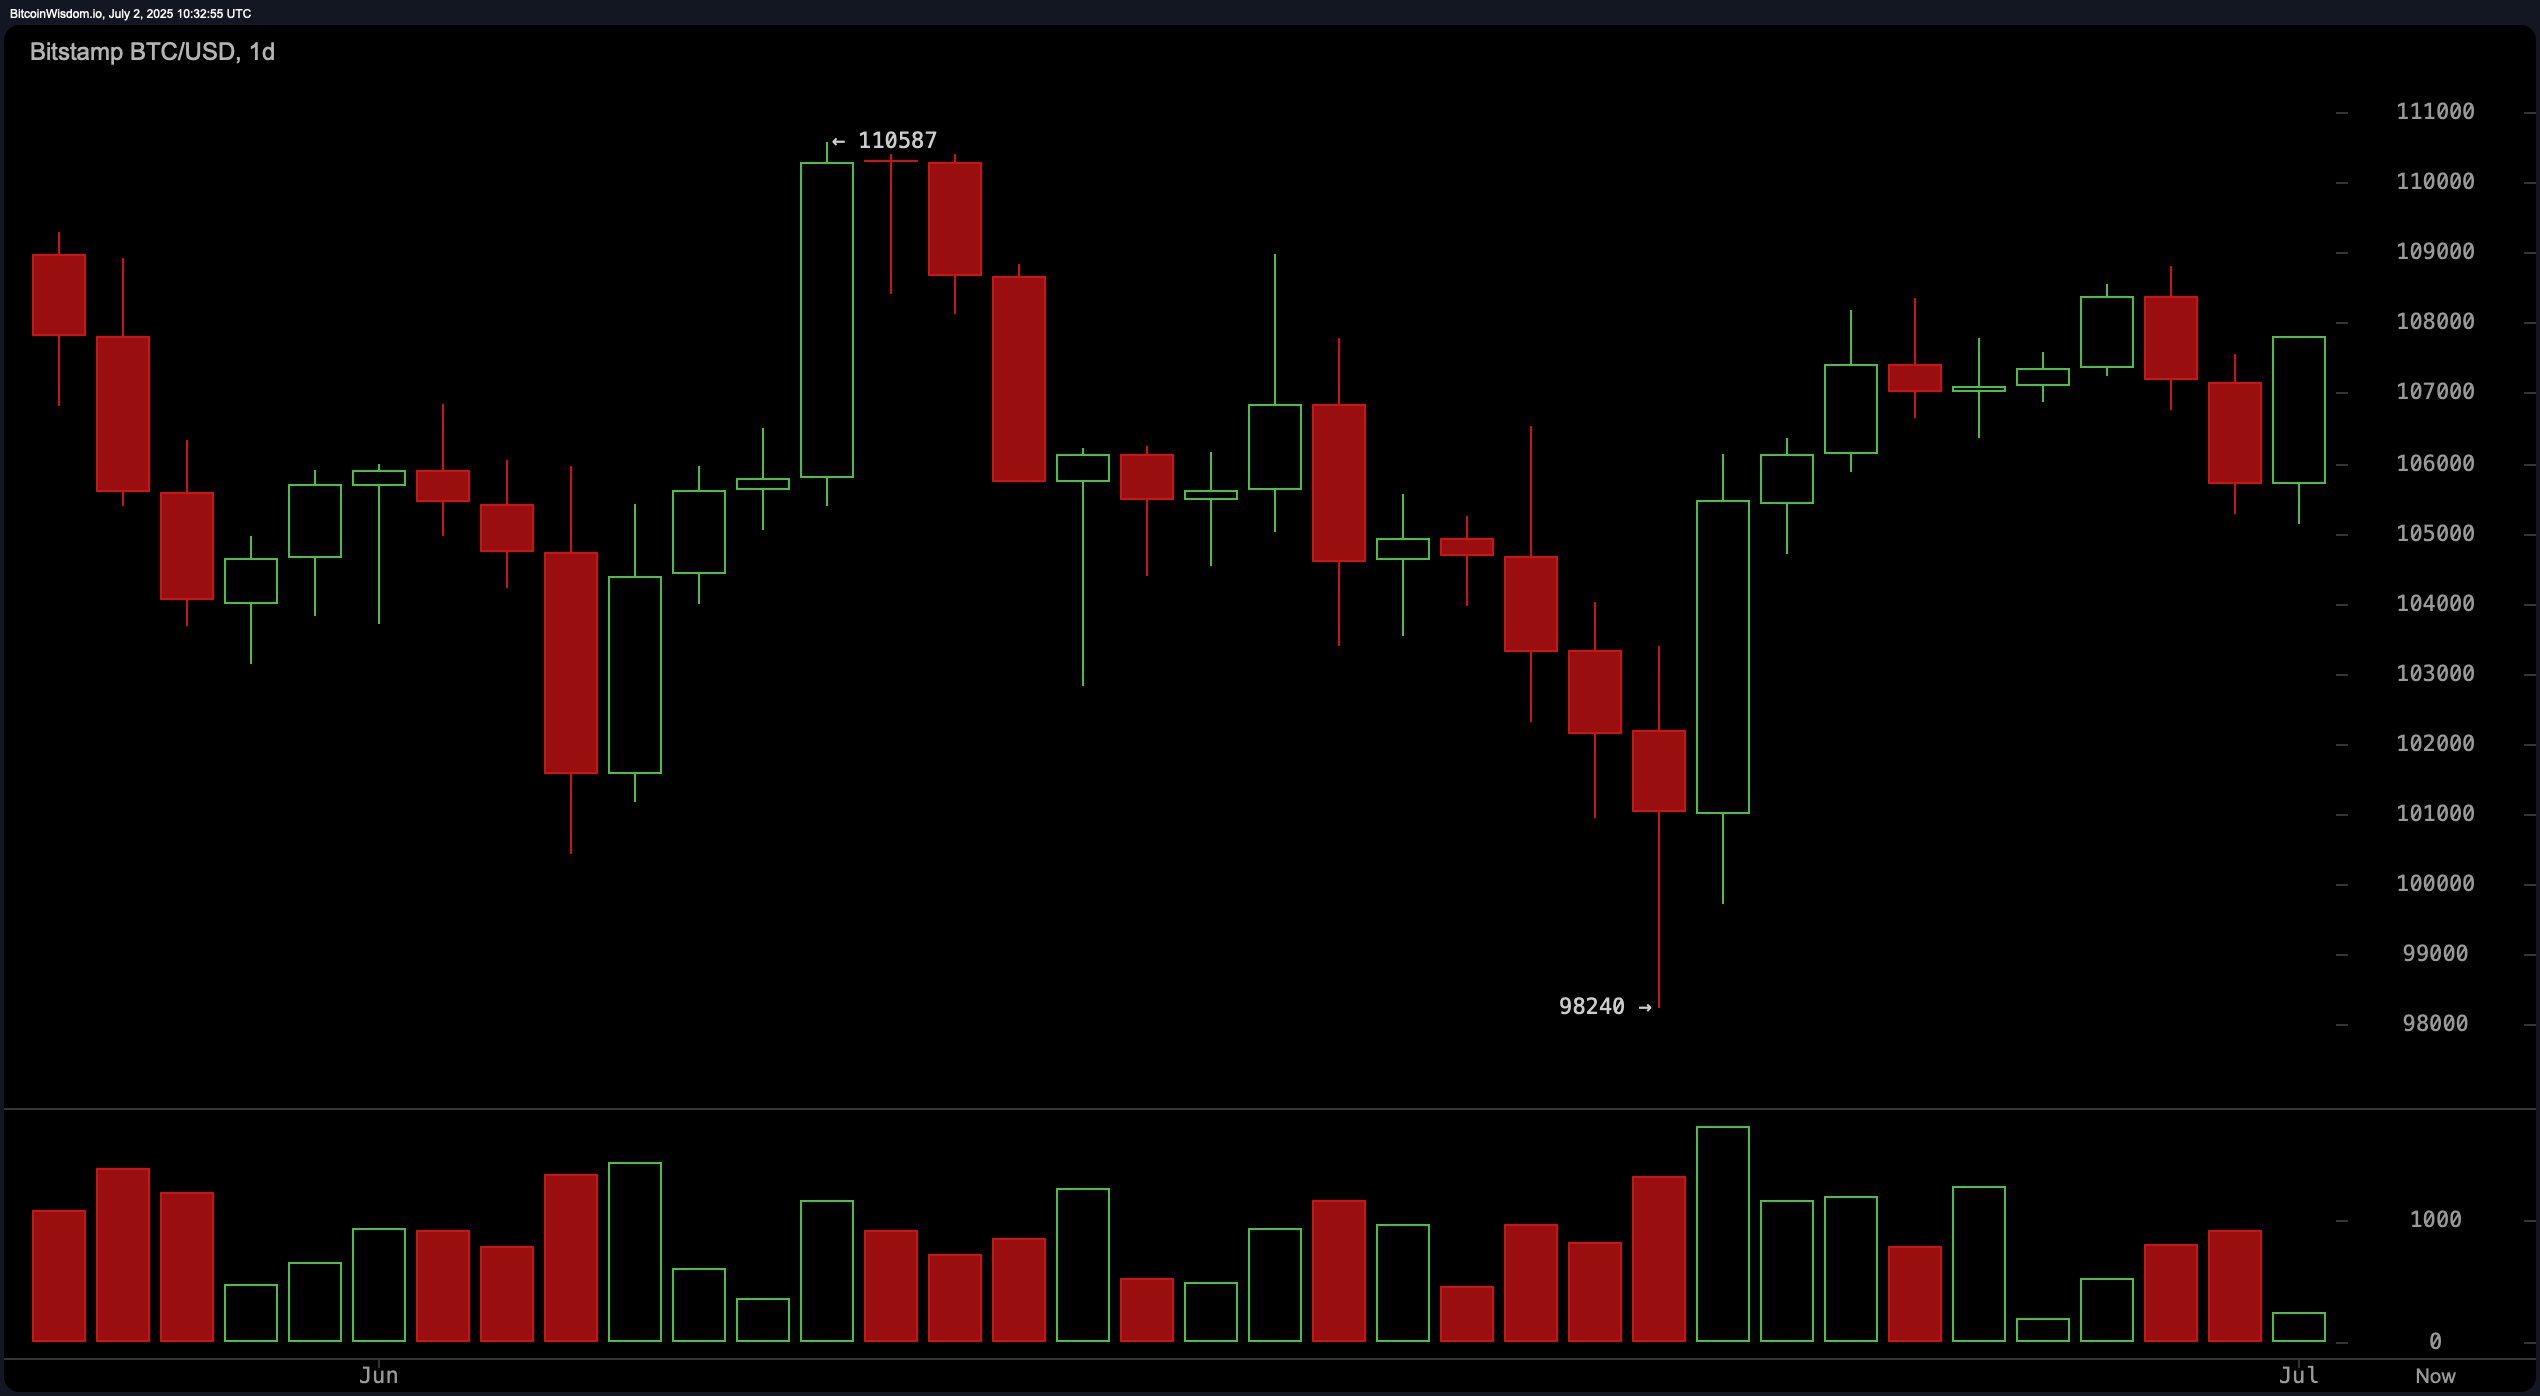
BTC/USD 1-day chart via Bitstamp on July 2, 2025.
The 4-hour chart indicates a transition from bearish to bullish, driven by a double bottom near $105,130. Price action has since surged toward $108,800, which stands as a key breakout point. Momentum is supported by larger bullish candles and increasing volume, yet a failure to clear $108,800 could prompt a retest of $105,000 levels. Strategic positioning involves long entries above $108,800 with upside targets near $110,000 or short setups if resistance is rejected twice, with stops depending on entry bias.
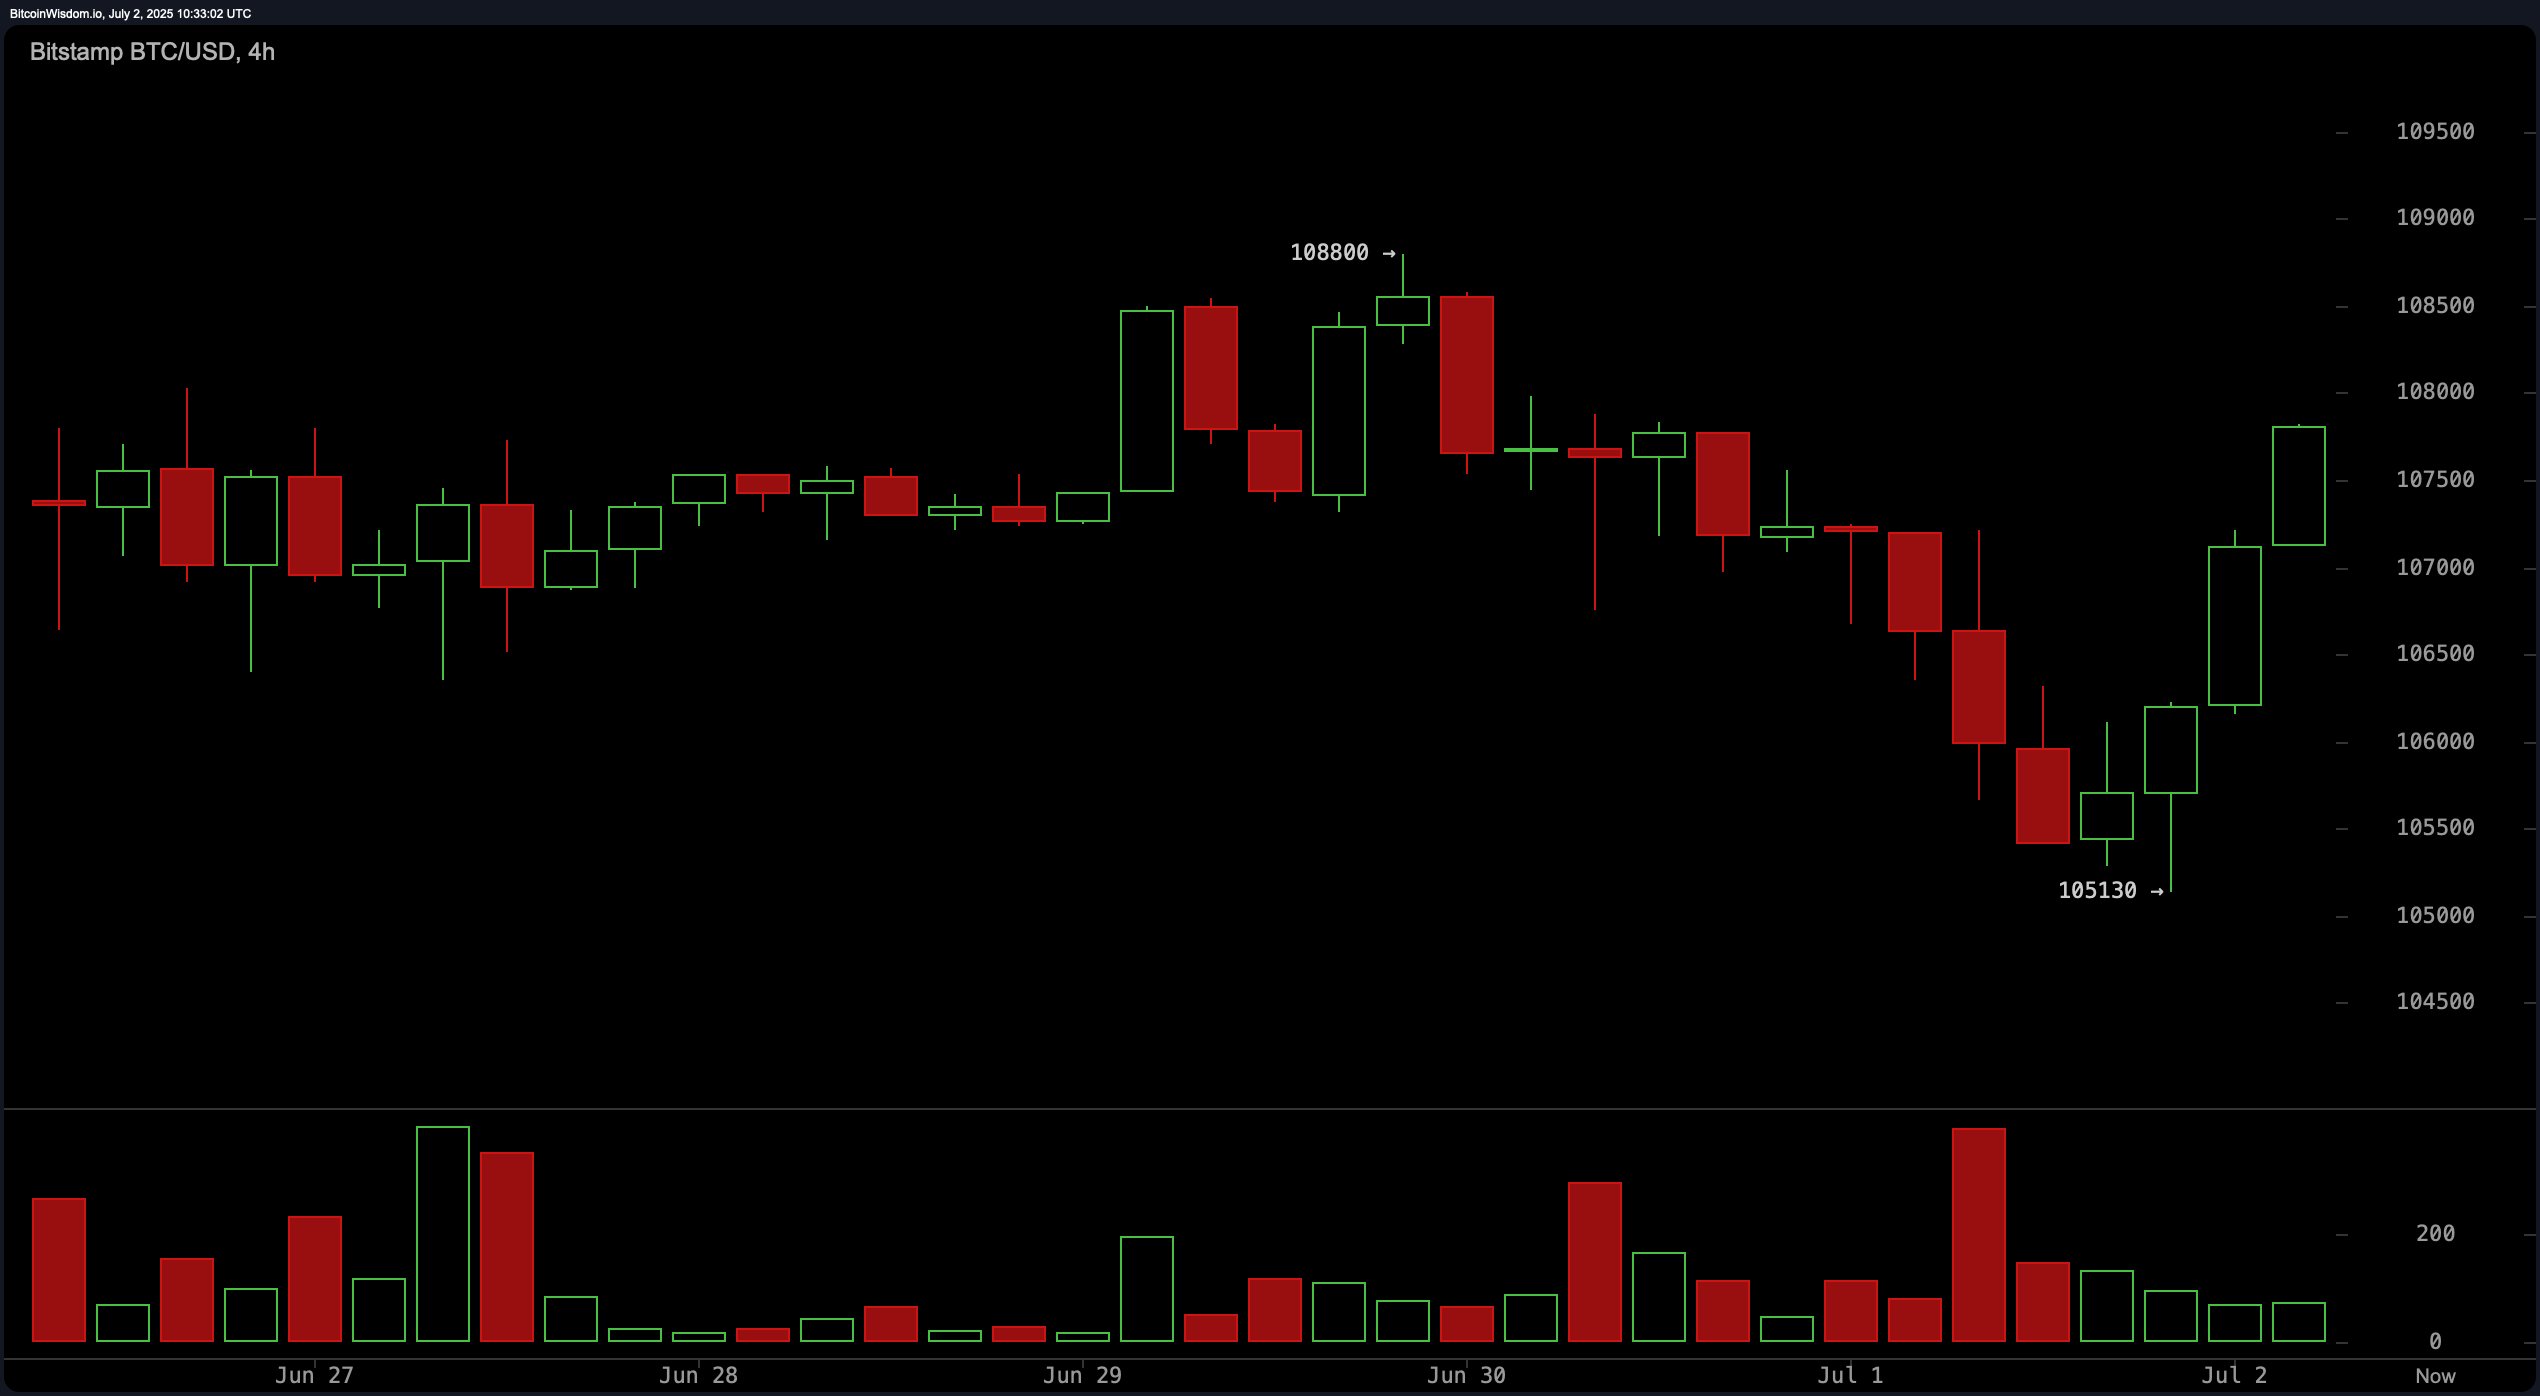
BTC/USD 4-hour chart via Bitstamp on July 2, 2025.
From the 1-hour chart perspective, bitcoin demonstrated a clear stair-step rally from $105,130 to $107,819, suggesting robust short-term bullish sentiment. Volume aligns with this upward push, although signals of temporary overbought conditions are emerging. Traders are closely watching for a pullback to the $106,800–$107,000 range to validate new support. A bull flag pattern appears to be forming, with near-term targets around $108,500 if consolidation holds, and stop-loss placements near $106,500.
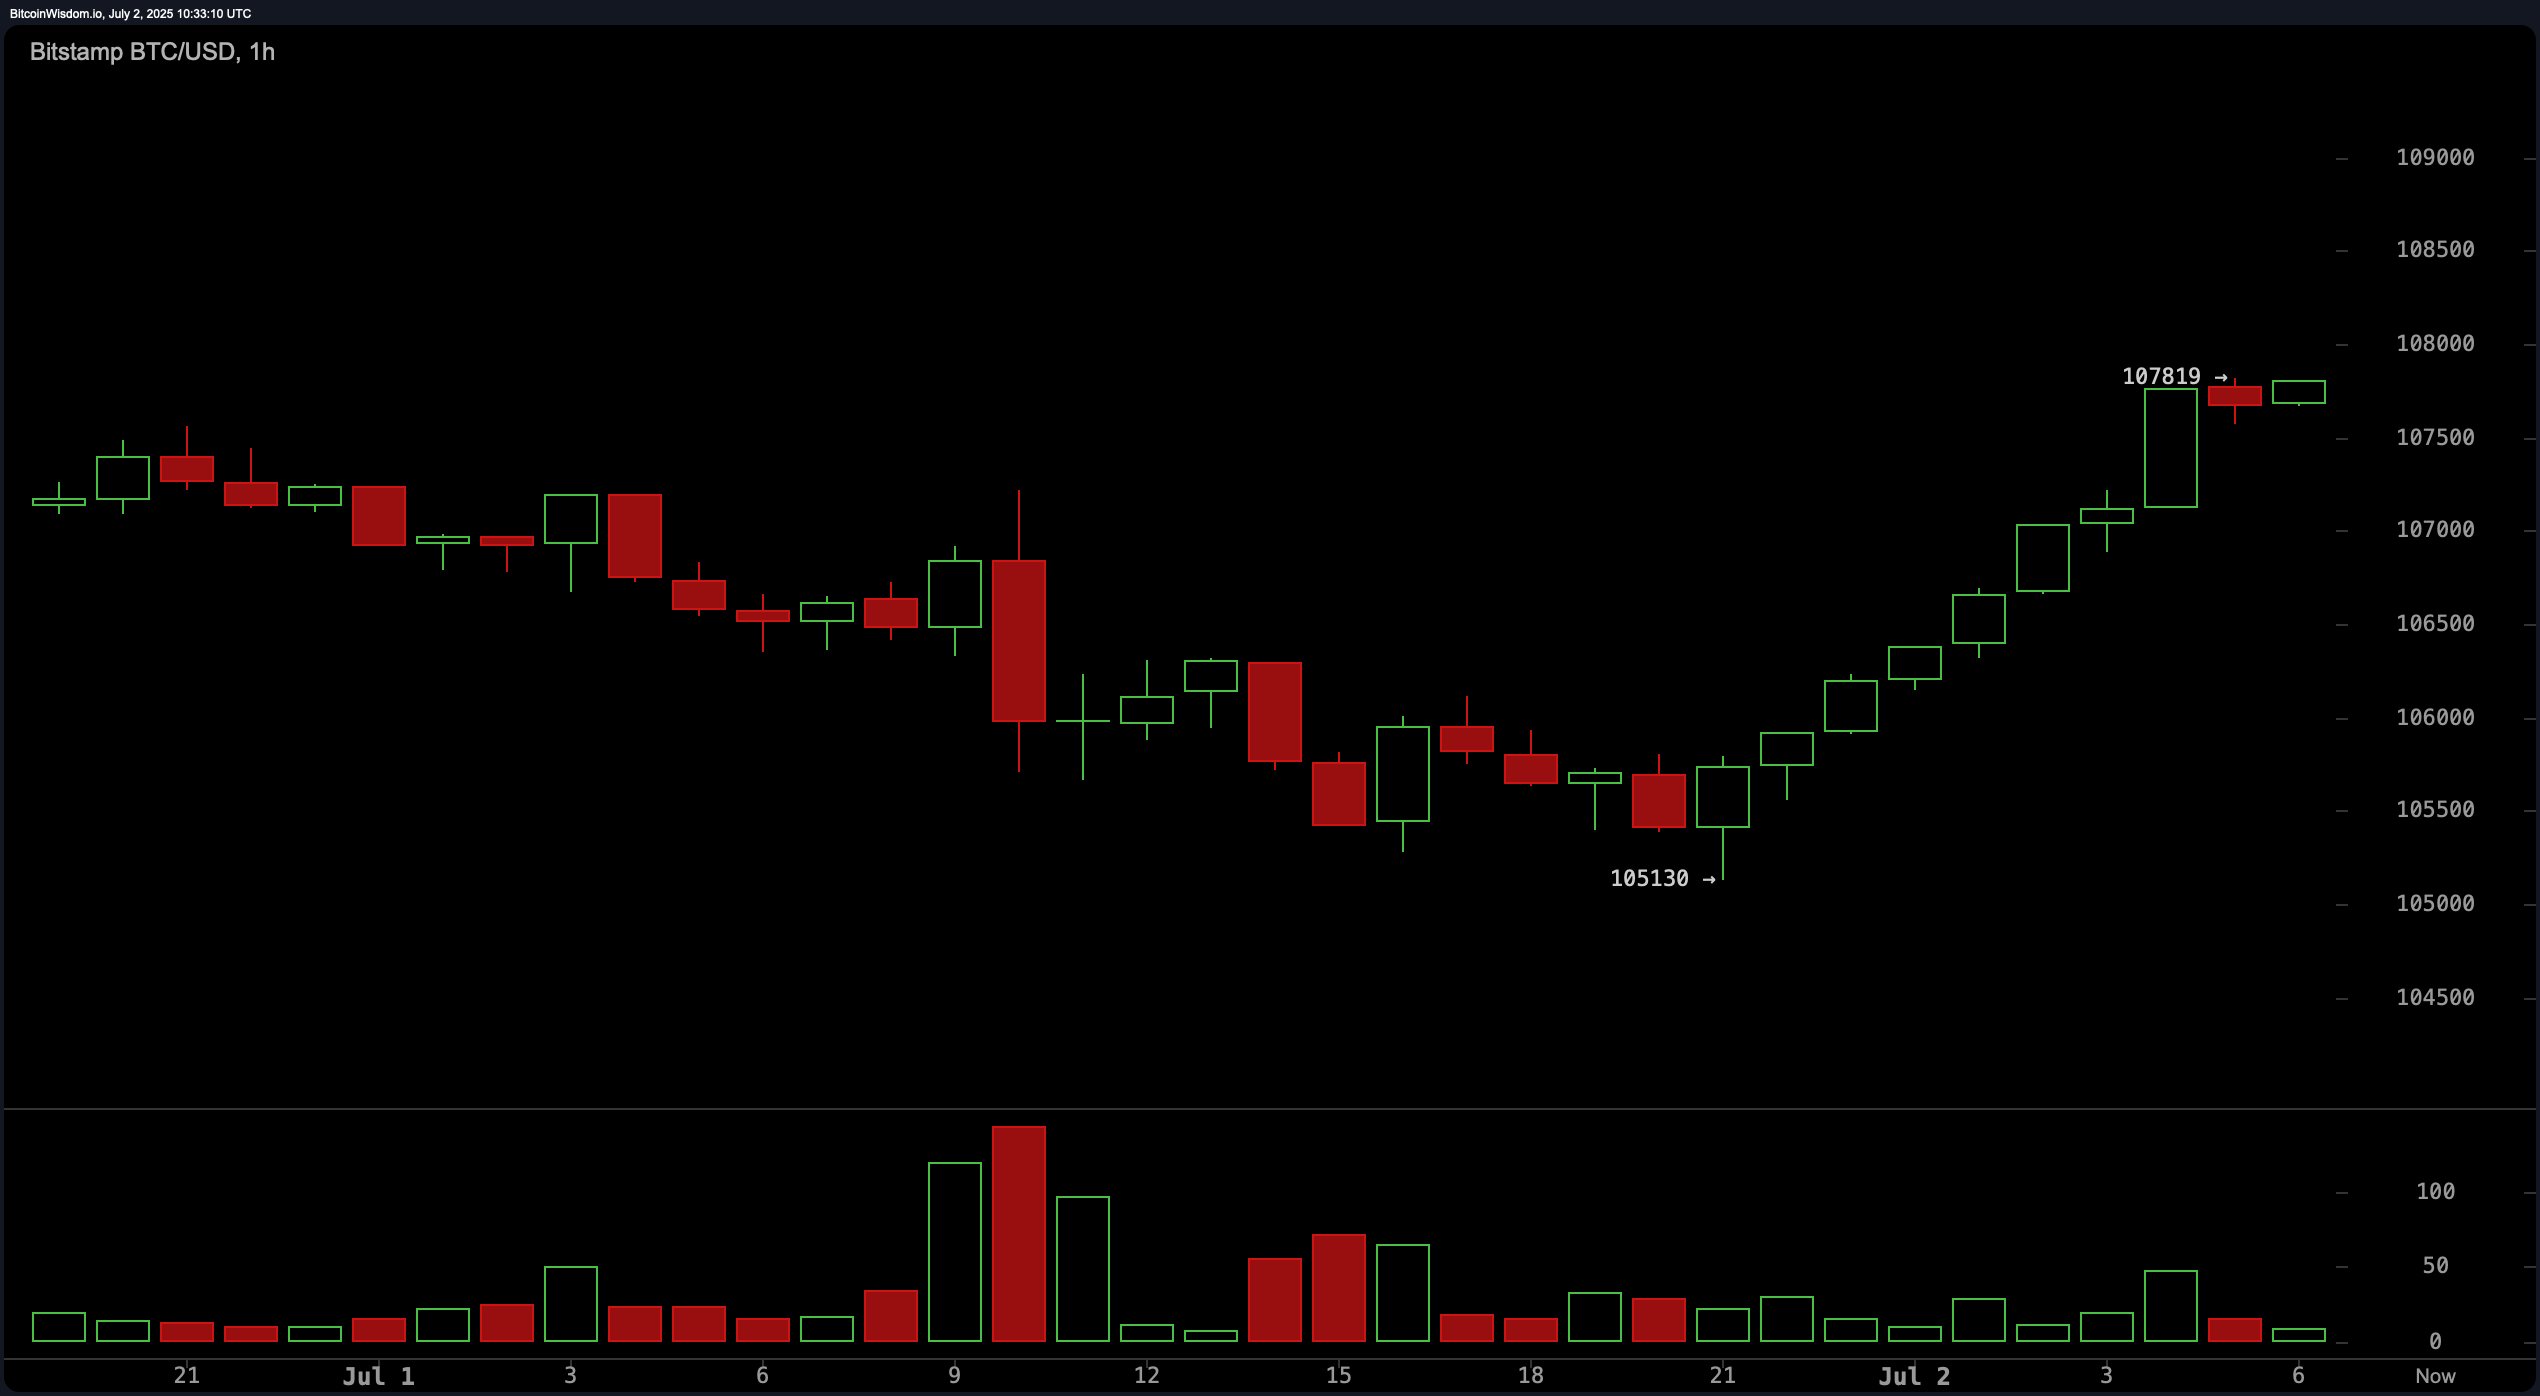
BTC/USD 1-hour chart via Bitstamp on July 2, 2025.
Oscillator indicators present a largely neutral sentiment, with the relative strength index (RSI) at 56, Stochastic at 82, commodity channel index (CCI) at 62, average directional index (ADX) at 13, and the Awesome oscillator reading at 1,529 — all signaling limited directional bias. However, the momentum indicator at 6,787 and moving average convergence divergence (MACD) level of 567 both suggest bullish signals, indicating underlying strength building in the trend. This split between neutrality and bullish bias offers a nuanced technical backdrop.
Moving averages (MAs) provide a broadly bullish outlook across all major timeframes. Every key exponential moving average (EMA) and simple moving average (SMA) — from the 10-period to the 200-period — indicates a positive signal. These include EMA (10) at 106,692, EMA (50) at 104,351, and SMA (200) at 96,314. This consensus reinforces the bullish foundation across the short, medium, and long term, underscoring a resilient support base despite nearby resistance challenges.
Bull Verdict:
Momentum indicators and the clean alignment of moving averages across all timeframes suggest a solid underlying bullish structure for bitcoin. If the price secures a daily close above $108,500 with volume confirmation, a move toward $110,000 or higher appears likely in the near term.
Bear Verdict:
Despite recent upward momentum, bitcoin faces strong resistance near $108,800 and $110,587. Failure to break through these levels, coupled with overbought short-term signals, could trigger a retracement back toward the $105,000 zone or lower, especially if volume fades on attempted breakouts.
免责声明:本文章仅代表作者个人观点,不代表本平台的立场和观点。本文章仅供信息分享,不构成对任何人的任何投资建议。用户与作者之间的任何争议,与本平台无关。如网页中刊载的文章或图片涉及侵权,请提供相关的权利证明和身份证明发送邮件到support@aicoin.com,本平台相关工作人员将会进行核查。


