This morning, the editor saw a news flash:
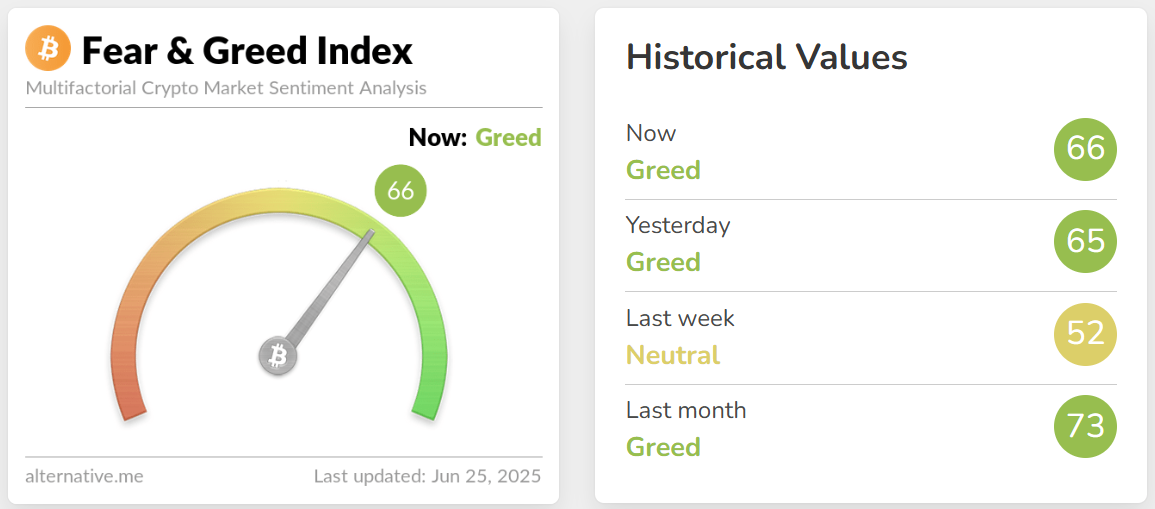
According to data from Alternative.me, today's cryptocurrency Fear and Greed Index has risen to 66 (up from 65 yesterday), indicating that the market is still in a "greed state."

Every time I see this kind of content, I can't help but ponder a few thoughts—how is the market's "greed" quantified?
This so-called "Greed Index" is actually a composite sentiment indicator. It references multiple dimensions such as volatility, trading volume, Google trends, social media heat, and Bitcoin dominance, ultimately arriving at a value between 0 and 100. The higher the value, the more excited and greedy the market; conversely, the lower the value, the more panic there is. I wonder if anyone else has thought like me:
Is it possible to "utilize" this indicator? Can it even be turned into a quantitative strategy?
Real Issues: Cannot Access Data in Real-Time, Difficult to Model
I often use AiCoin to check market trends, and the news flash promptly pushes updates on the Greed Index, such as today’s 66 and yesterday’s 65. Here’s a link to a news flash for everyone to quickly understand current events: https://www.aicoin.com/zh-Hans/news-flash
Returning to the Greed Index, if one truly wants to use it for modeling strategies, two problems arise:
- Unable to access data streams in real-time, which limits the strategy's timeliness and backtesting capability;
- The index itself is a "black box model," and we cannot precisely know the weight of each component, making it difficult to adjust parameters and optimize.
Therefore, I tried to think from a different angle: instead of using the Greed Index, why not directly use price action indicators that can reflect sentiment?
This leads us to the real topic of discussion today: BRAR Indicator.

BRAR: Visible Market Sentiment
BRAR is a very old-fashioned but noteworthy indicator that has been circulated in A-share technical analysis for a long time, but its underlying logic is equally applicable in the cryptocurrency market. It consists of two parts:
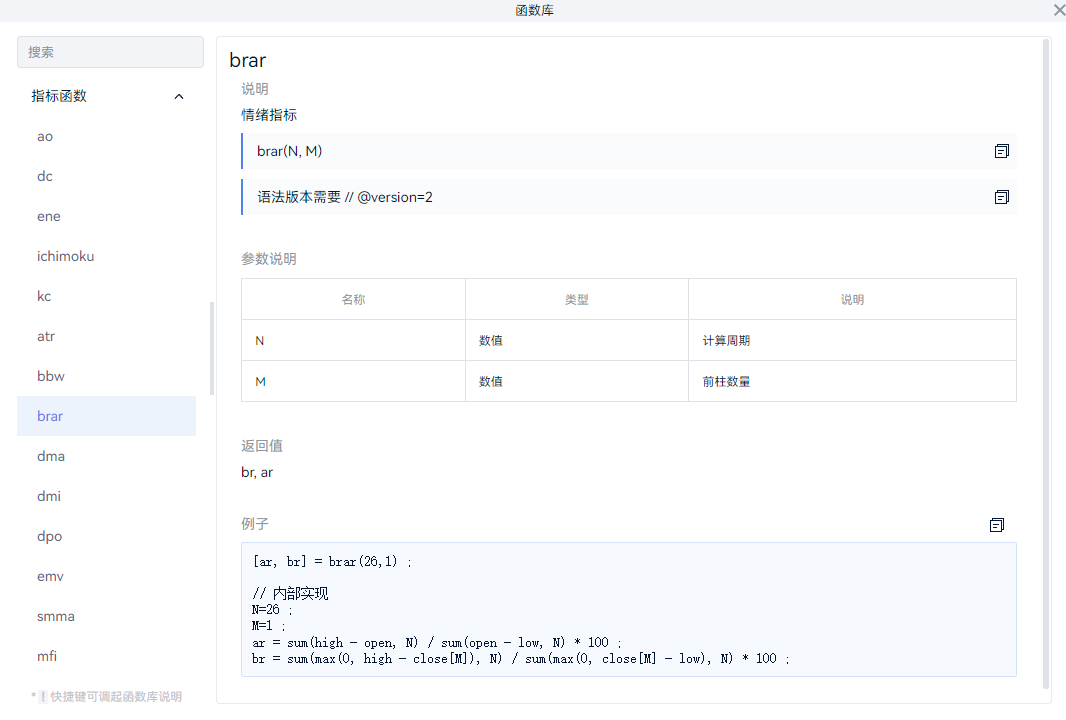
- AR (Popularity Indicator): Measures whether market sentiment is active. It calculates the ratio of the high opening amplitude to the low opening amplitude over a period, indirectly reflecting the willingness of bulls to participate.
- BR (Buying and Selling Strength): Measures the strength of buying vs. selling in the market, calculating the relative ratio between high-close and close-low.
In simple terms, this indicator uses price action to "reverse engineer" the emotional state in the market.
How to Choose Parameters? Pay Attention to Period and M
The default parameters for BRAR are usually (26, 1), meaning it observes a period of 26 candlesticks, with BR using the previous closing price as a reference. However, this setting may not be suitable for the cryptocurrency market. I’ll give you the conclusion directly! If you really want to apply it in practice, you still need to adjust based on the cryptocurrency and other conditions.

How to Choose Period N?
- Daily level: It is recommended to keep 26 or slightly adjust to 20 or 30;
- Hourly or shorter periods: It is recommended to use 14-18, which is more in line with the rhythm of the cryptocurrency market;
- Very short-term strategies: You can try 7-9, but signals are easily disturbed.
Setting M to Avoid Overlap of BR and AR
Since the cryptocurrency market is continuously traded, it often occurs that "opening price ≈ previous closing price," causing BR and AR calculation results to converge, losing reference significance. Recommendations:
- Hourly strategies: Set M to 2 or 3;
- Daily or higher periods: M = 1 can still be used.
This can more effectively distinguish popularity (AR) from buying strength (BR), making it easier to identify changes in sentiment.
Practical Logic: Build an "Emotional Trend" Strategy Using BRAR
With the custom indicator feature of AiCoin, I also tried to apply BRAR in a long and short strategy within trending markets. This logic mainly revolves around the two core indicators, AR and BR, judging the strength of market sentiment through their relative relationship, and assisting in opening and closing decisions accordingly.

In the long position:
- First, I will observe the position of AR.
- If AR is above 100, it indicates that market popularity is strong, and sentiment is optimistic, providing a certain upward basis. If at this time BR crosses above AR, it represents that buying strength begins to lead popularity, often indicating that active funds are entering the market, and this is when I can consider trying to go long.
- As for closing, I will observe the trend changes of BR—if a trend reversal occurs (for example, after a continuous rise, it starts to flatten or decline), it indicates that bullish momentum may begin to weaken, and I will consider exiting in batches or taking profits.
In the short position, the judgment logic will be slightly different.
- I will first observe the structure of BR; if it starts to turn down after experiencing a rise (for example, BR[1] > BR, and it was previously in an upward trend), that is a signal of weakening sentiment, indicating that buying pressure is beginning to retreat. At this time, I can consider trying to short.
- Then, if AR is simultaneously below 100, or BR continues to cross below AR, it can further confirm that the market is in a cooling or even weakening emotional phase, which is a more suitable environment for short positions. Once BR stabilizes and AR recovers to a relatively high level, I will consider exiting the short position.
Overall, the core of this strategy lies in combining price structure with emotional changes: AR focuses more on reflecting the market's "heat," while BR represents the real buying momentum. The combination of the two helps us identify the emotional driving force behind trends, allowing us to grasp more reasonable entry and exit timing in complex market conditions. Of course, if we can overlay some trend filtering tools, the signal recognition of the strategy may be more precise! This is something for everyone to try!
Conclusion
The Greed Index from Alternative provides us with an intuitive overview of sentiment, while BRAR allows you to see sentiment on the chart and apply it in strategies. It is not a universal indicator, but its advantages lie in:
- Transparent logic;
- Stable data structure;
- Real-time participation in strategy optimization and execution.
Greed and panic will always be part of the market's driving force. We cannot eliminate emotions, but we can understand them, measure them, and even—utilize them.
免责声明:本文章仅代表作者个人观点,不代表本平台的立场和观点。本文章仅供信息分享,不构成对任何人的任何投资建议。用户与作者之间的任何争议,与本平台无关。如网页中刊载的文章或图片涉及侵权,请提供相关的权利证明和身份证明发送邮件到support@aicoin.com,本平台相关工作人员将会进行核查。


