The open interest in Bitcoin futures has reached a historical peak of $72 billion, demonstrating strong confidence from institutional investors in BTC.
Written by: Lawrence, Mars Finance
Institutional Leverage and Liquidation Risks: The Build-Up Before BTC Breakthrough
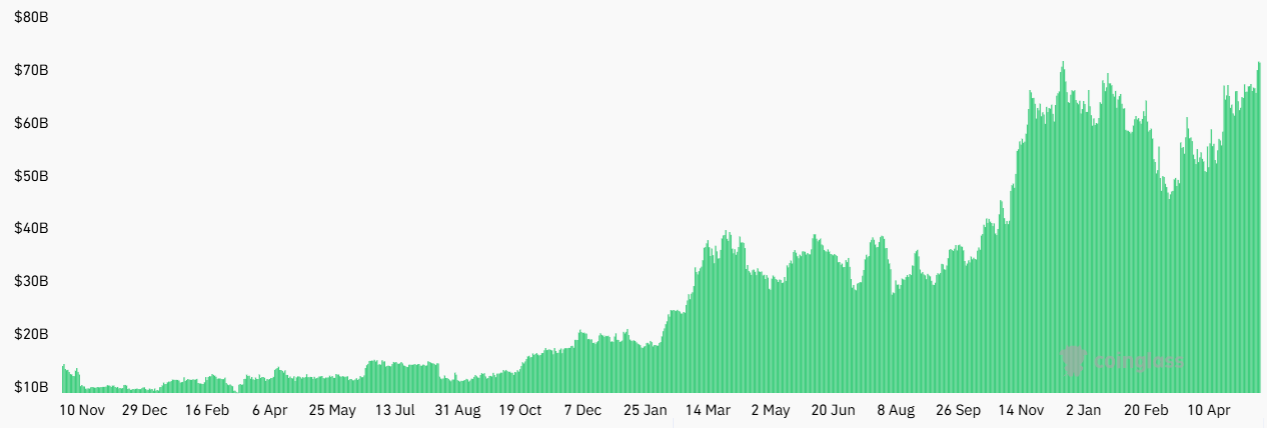 Total open interest in Bitcoin futures (in USD). Source: CoinGlass
As of May 20, 2025, the total open interest in Bitcoin futures has reached a historical peak of $72 billion, an 8% increase from $66.6 billion a week earlier. This data not only sets a new record in the cryptocurrency derivatives market but also reveals strong confidence from institutional investors in BTC. In terms of position distribution, the Chicago Mercantile Exchange (CME) dominates with a contract volume of $16.9 billion, followed closely by Binance with $12 billion, indicating a joint effort from traditional finance and crypto-native platforms. This phenomenon echoes the market landscape when MicroStrategy made significant Bitcoin purchases in 2021, but the current depth and breadth of institutional participation are incomparable—MicroStrategy alone holds 576,000 Bitcoins, valued at over $60 billion.
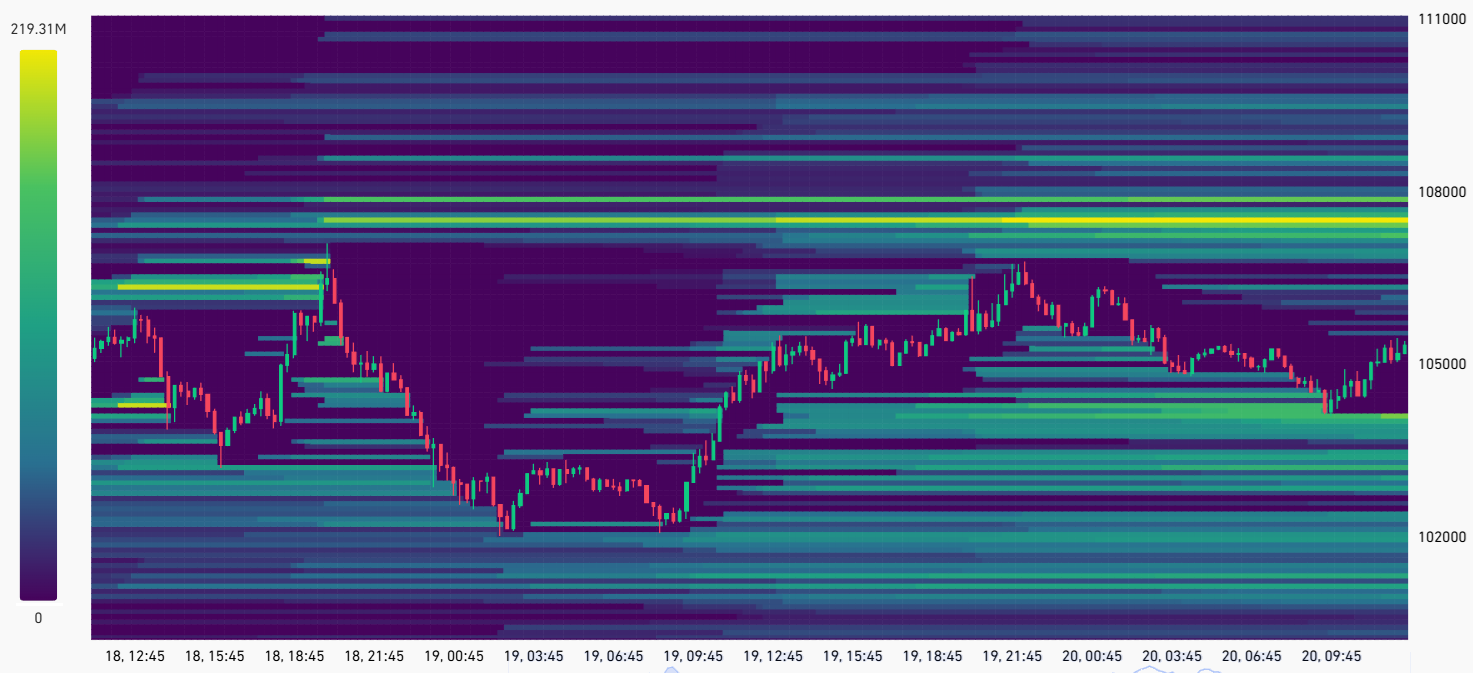 Bitcoin futures leverage heatmap, unit: million USD. Source: CoinGlass
The market's focus is on the $1.2 billion short liquidation risk in the $107,000 to $108,000 range. CoinGlass data shows that this price band has accumulated the largest leveraged short positions in crypto history, and once the price breaks this threshold, it will trigger a chain reaction of forced liquidations. Notably, the structure of this liquidation heatmap is highly similar to the market characteristics when Bitcoin surged to $69,000 in 2021, where the liquidity siphoning effect from short liquidations drove the price up by 35% within two months. The current macroeconomic environment further increases the likelihood of a breakout: the 20-year U.S. Treasury yield continues to hover around 5%, reflecting market concerns about the sustainability of U.S. government debt, while the Federal Reserve may be forced to intervene in the Treasury market to maintain stability, which would further weaken the dollar's credit system and prompt funds to shift towards inflation-resistant assets like Bitcoin.
The Reserve Game Between Gold and Bitcoin
In the wave of global asset reallocation, Bitcoin is gradually encroaching on gold's safe-haven status. As of May 2025, while the market value of gold remains high at $22 trillion, its 24% increase this year shows signs of fatigue, whereas Bitcoin's market cap of $2.1 trillion has become comparable to silver, making it an indispensable component of institutional asset portfolios. More symbolically, some U.S. lawmakers have begun discussing proposals to convert 5% of gold reserves into Bitcoin—if implemented, this would bring in $10.5 billion in funds, enough to push Bitcoin's price above $120,000. The evolution of this reserve structure signals an important recognition of Bitcoin as "digital gold" at the sovereign level.
From a market structure perspective, the institutionalization process of Bitcoin has entered a new phase. Each CME futures contract represents 5 Bitcoins (approximately $514,000), naturally filtering out retail investors, making the changes in this platform's open interest more reflective of the true movements of professional institutions. Currently, CME's open interest has decreased by 13% from the price peak in January, while Bitcoin's price has only fallen by 5.8%, indicating that institutions are quietly building positions during the price correction, accumulating energy for the next round of increases. This strategy resonates with Michael Saylor's "cost-agnostic accumulation" corporate Bitcoin strategy, collectively building a value consensus against short-term volatility.
Ethereum's Technical Breakthrough and Market Test
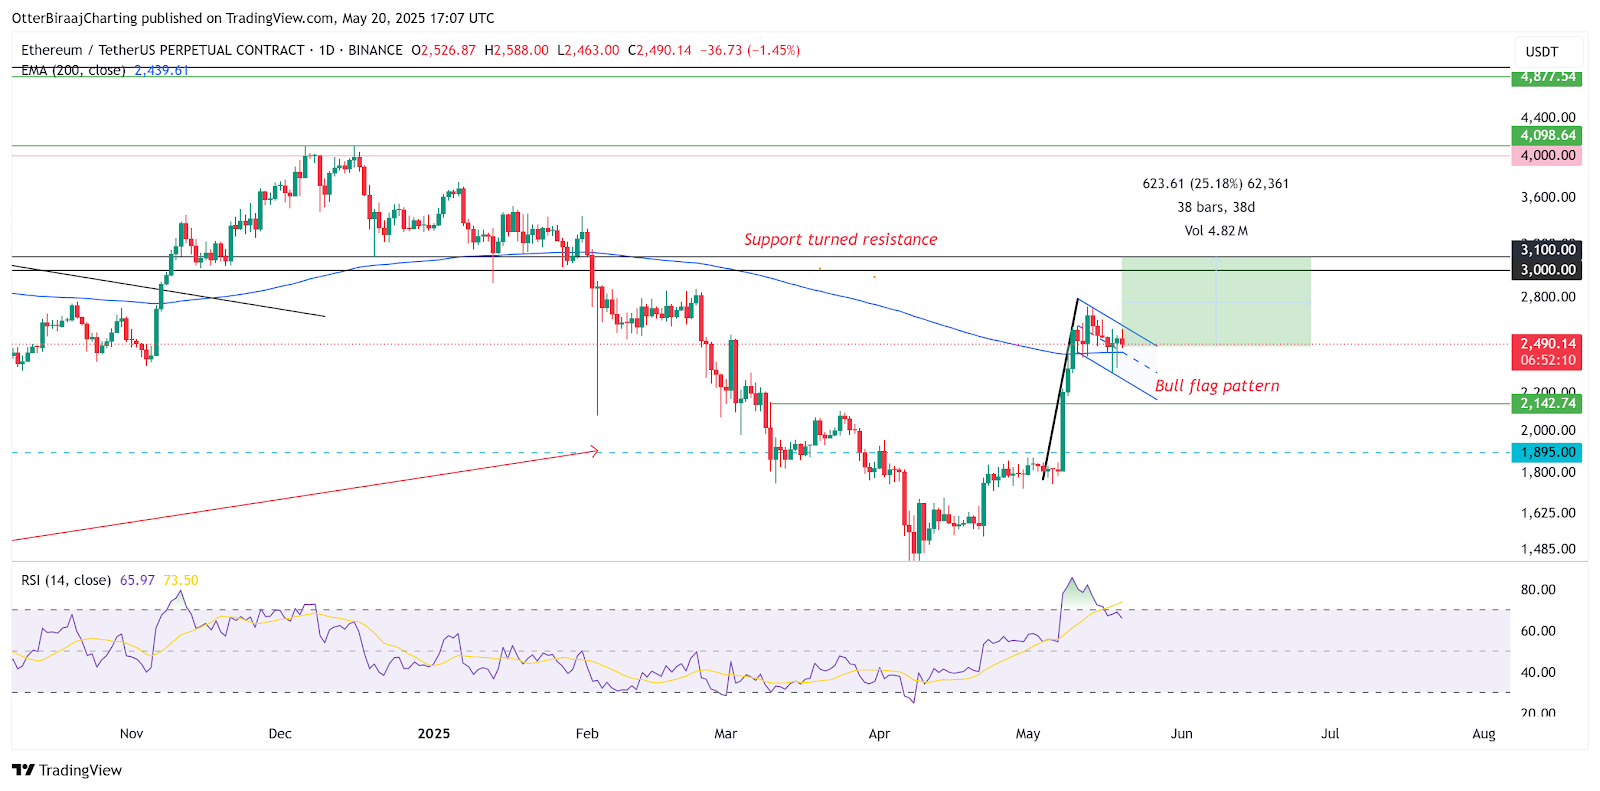 Ethereum 1-day chart. Source: TradingView
As Bitcoin approaches historical highs, Ethereum's technical formation is also showing signs of a breakout. On the daily chart, ETH has formed a bullish flag pattern in the $2,400 to $2,750 range, which is nearing completion, with the target pointing to the $3,000-$3,100 resistance zone.
If successfully broken, the theoretical increase based on the flagpole height could reach $3,600, marking another significant market movement following the 93% surge in 2023. The resonance of technical indicators strengthens bullish expectations: a golden cross formed by the 50-day and 200-day moving averages has appeared on the 12-hour chart, although its reliability is weaker than on the daily level, it still signals a strengthening of the mid-term trend.
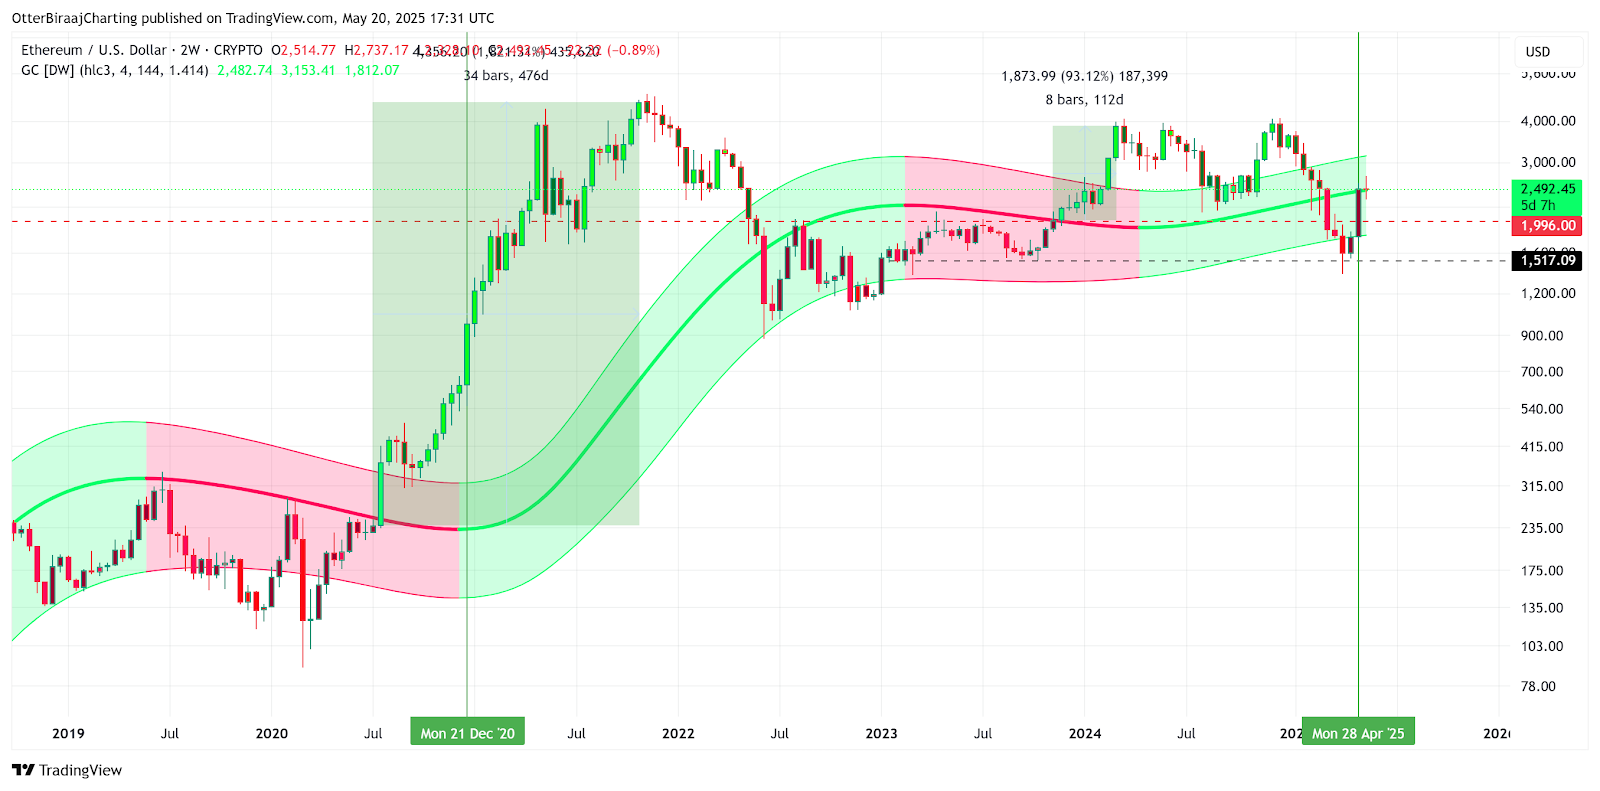 Ethereum Gaussian channel analysis. Source: Cointelegraph/TradingView
Gaussian channel analysis provides a deeper historical reference for Ethereum. On May 20, after ETH price touched the middle line of the channel, the market closely watched whether it could replicate the legendary 1,820% increase from 2020—when a similar breakout triggered a comprehensive explosion of altcoins.
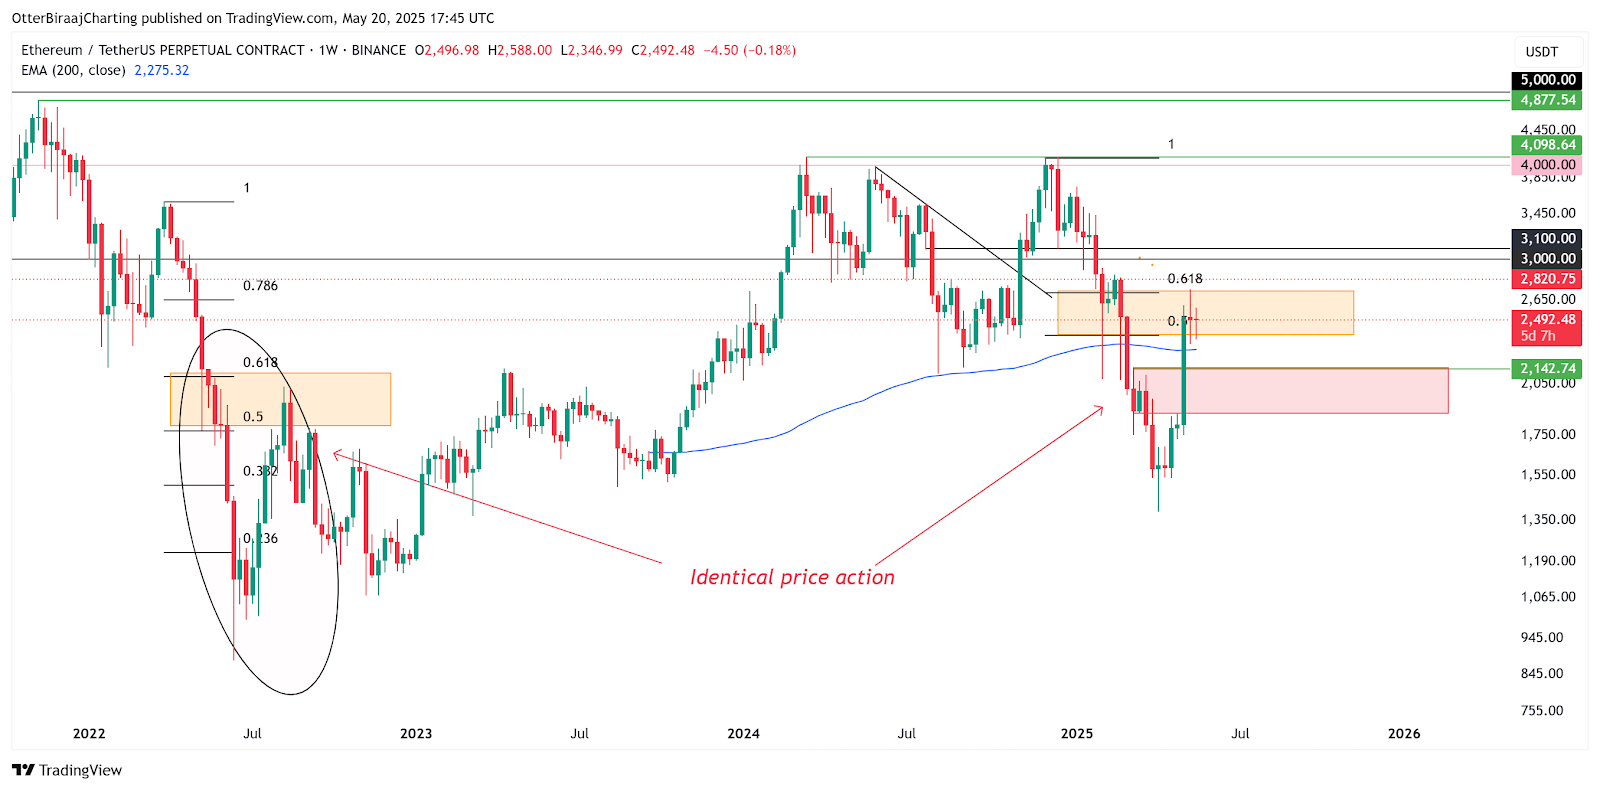 Ethereum weekly price analysis. Source: TradingView
However, the cautious attitude of trader XO is noteworthy: there is significant resistance below $2,800, and if it cannot effectively break through in the coming weeks, ETH may fall into a range-bound oscillation between $2,150 and $2,750. This divergence is reflected in the Fibonacci retracement levels, where repeated testing of the 0.5 to 0.618 range exposes the hesitation of bulls and suggests that the market needs a stronger catalyst to break the balance.
The Tug-of-War Between Macro Variables and Market Sentiment
The fundamental force driving the cryptocurrency market always comes from the cracks in the traditional financial system. The scale of U.S. government debt has surpassed $36.2 trillion, and the irreconcilable differences between the Democratic and Republican parties on fiscal policy are creating a political economy dilemma that is transmitted to the crypto market through the U.S. Treasury yield curve. When the 10-year U.S. Treasury yield climbed to a 14-month high of 4.79%, the valuation models for risk assets faced severe challenges, but Bitcoin demonstrated unique resilience—its 42% annual increase has outperformed U.S. stocks, proving a structural separation in correlation between digital assets and traditional markets.
Changes in the regulatory environment are also worth noting. Grayscale Research points out that the differing attitudes of U.S. election candidates towards cryptocurrencies may influence the mid-to-long-term market direction. The Trump team's policy of allowing Bitcoin payments contrasts with the Biden administration's focus on compliance regulation, injecting new uncertainty into the market through this political game. However, a deeper trend has already become clear: regardless of who occupies the White House, the reality of the U.S. government debt/GDP ratio exceeding 150% is difficult to reverse, and the continued erosion of fiat currency credit will ultimately push more institutional investors into the embrace of Bitcoin.
免责声明:本文章仅代表作者个人观点,不代表本平台的立场和观点。本文章仅供信息分享,不构成对任何人的任何投资建议。用户与作者之间的任何争议,与本平台无关。如网页中刊载的文章或图片涉及侵权,请提供相关的权利证明和身份证明发送邮件到support@aicoin.com,本平台相关工作人员将会进行核查。


