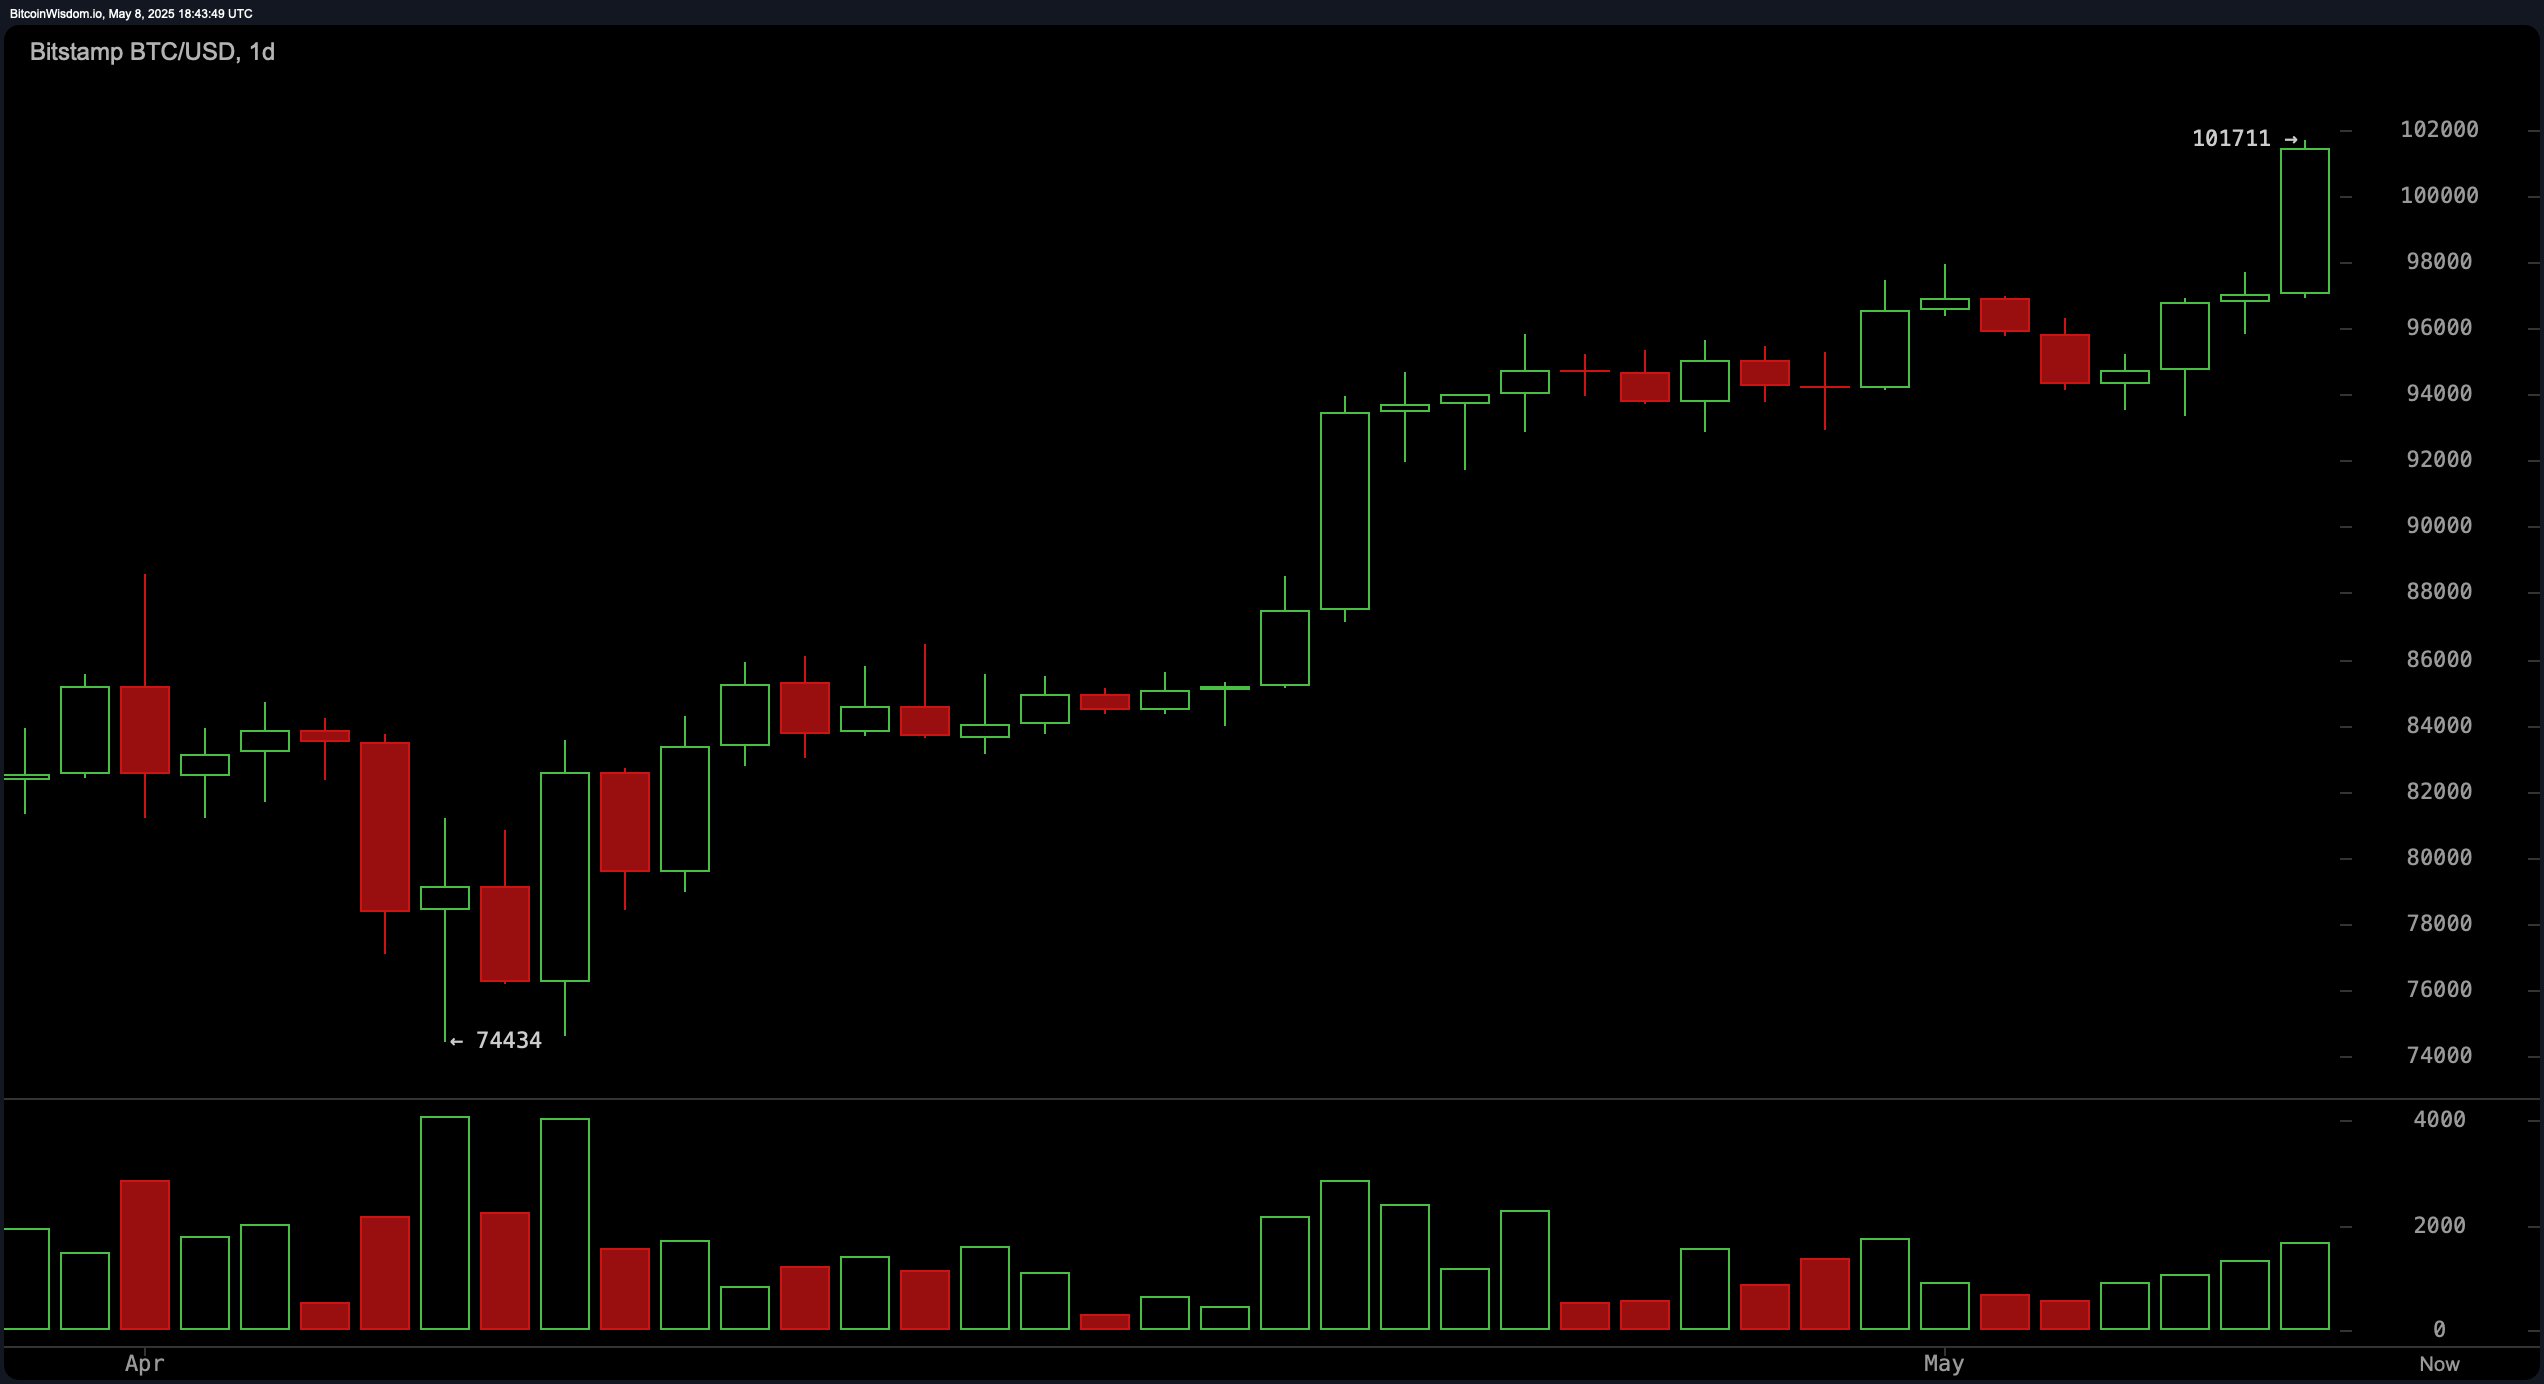
On the daily chart, bitcoin shows dominant bullish momentum with a confirmed breakout above the prior consolidation zone. The move is supported by increasing volume, validating the recent upside push. The current support band rests between $93,000 and $95,000, while resistance is projected above $102,000. Traders eye potential entries on pullbacks to the $96,000–$98,000 range, particularly with protective stop-loss orders beneath $94,000.

BTC/USD 1D chart via Bitstamp on May 8, 2025.
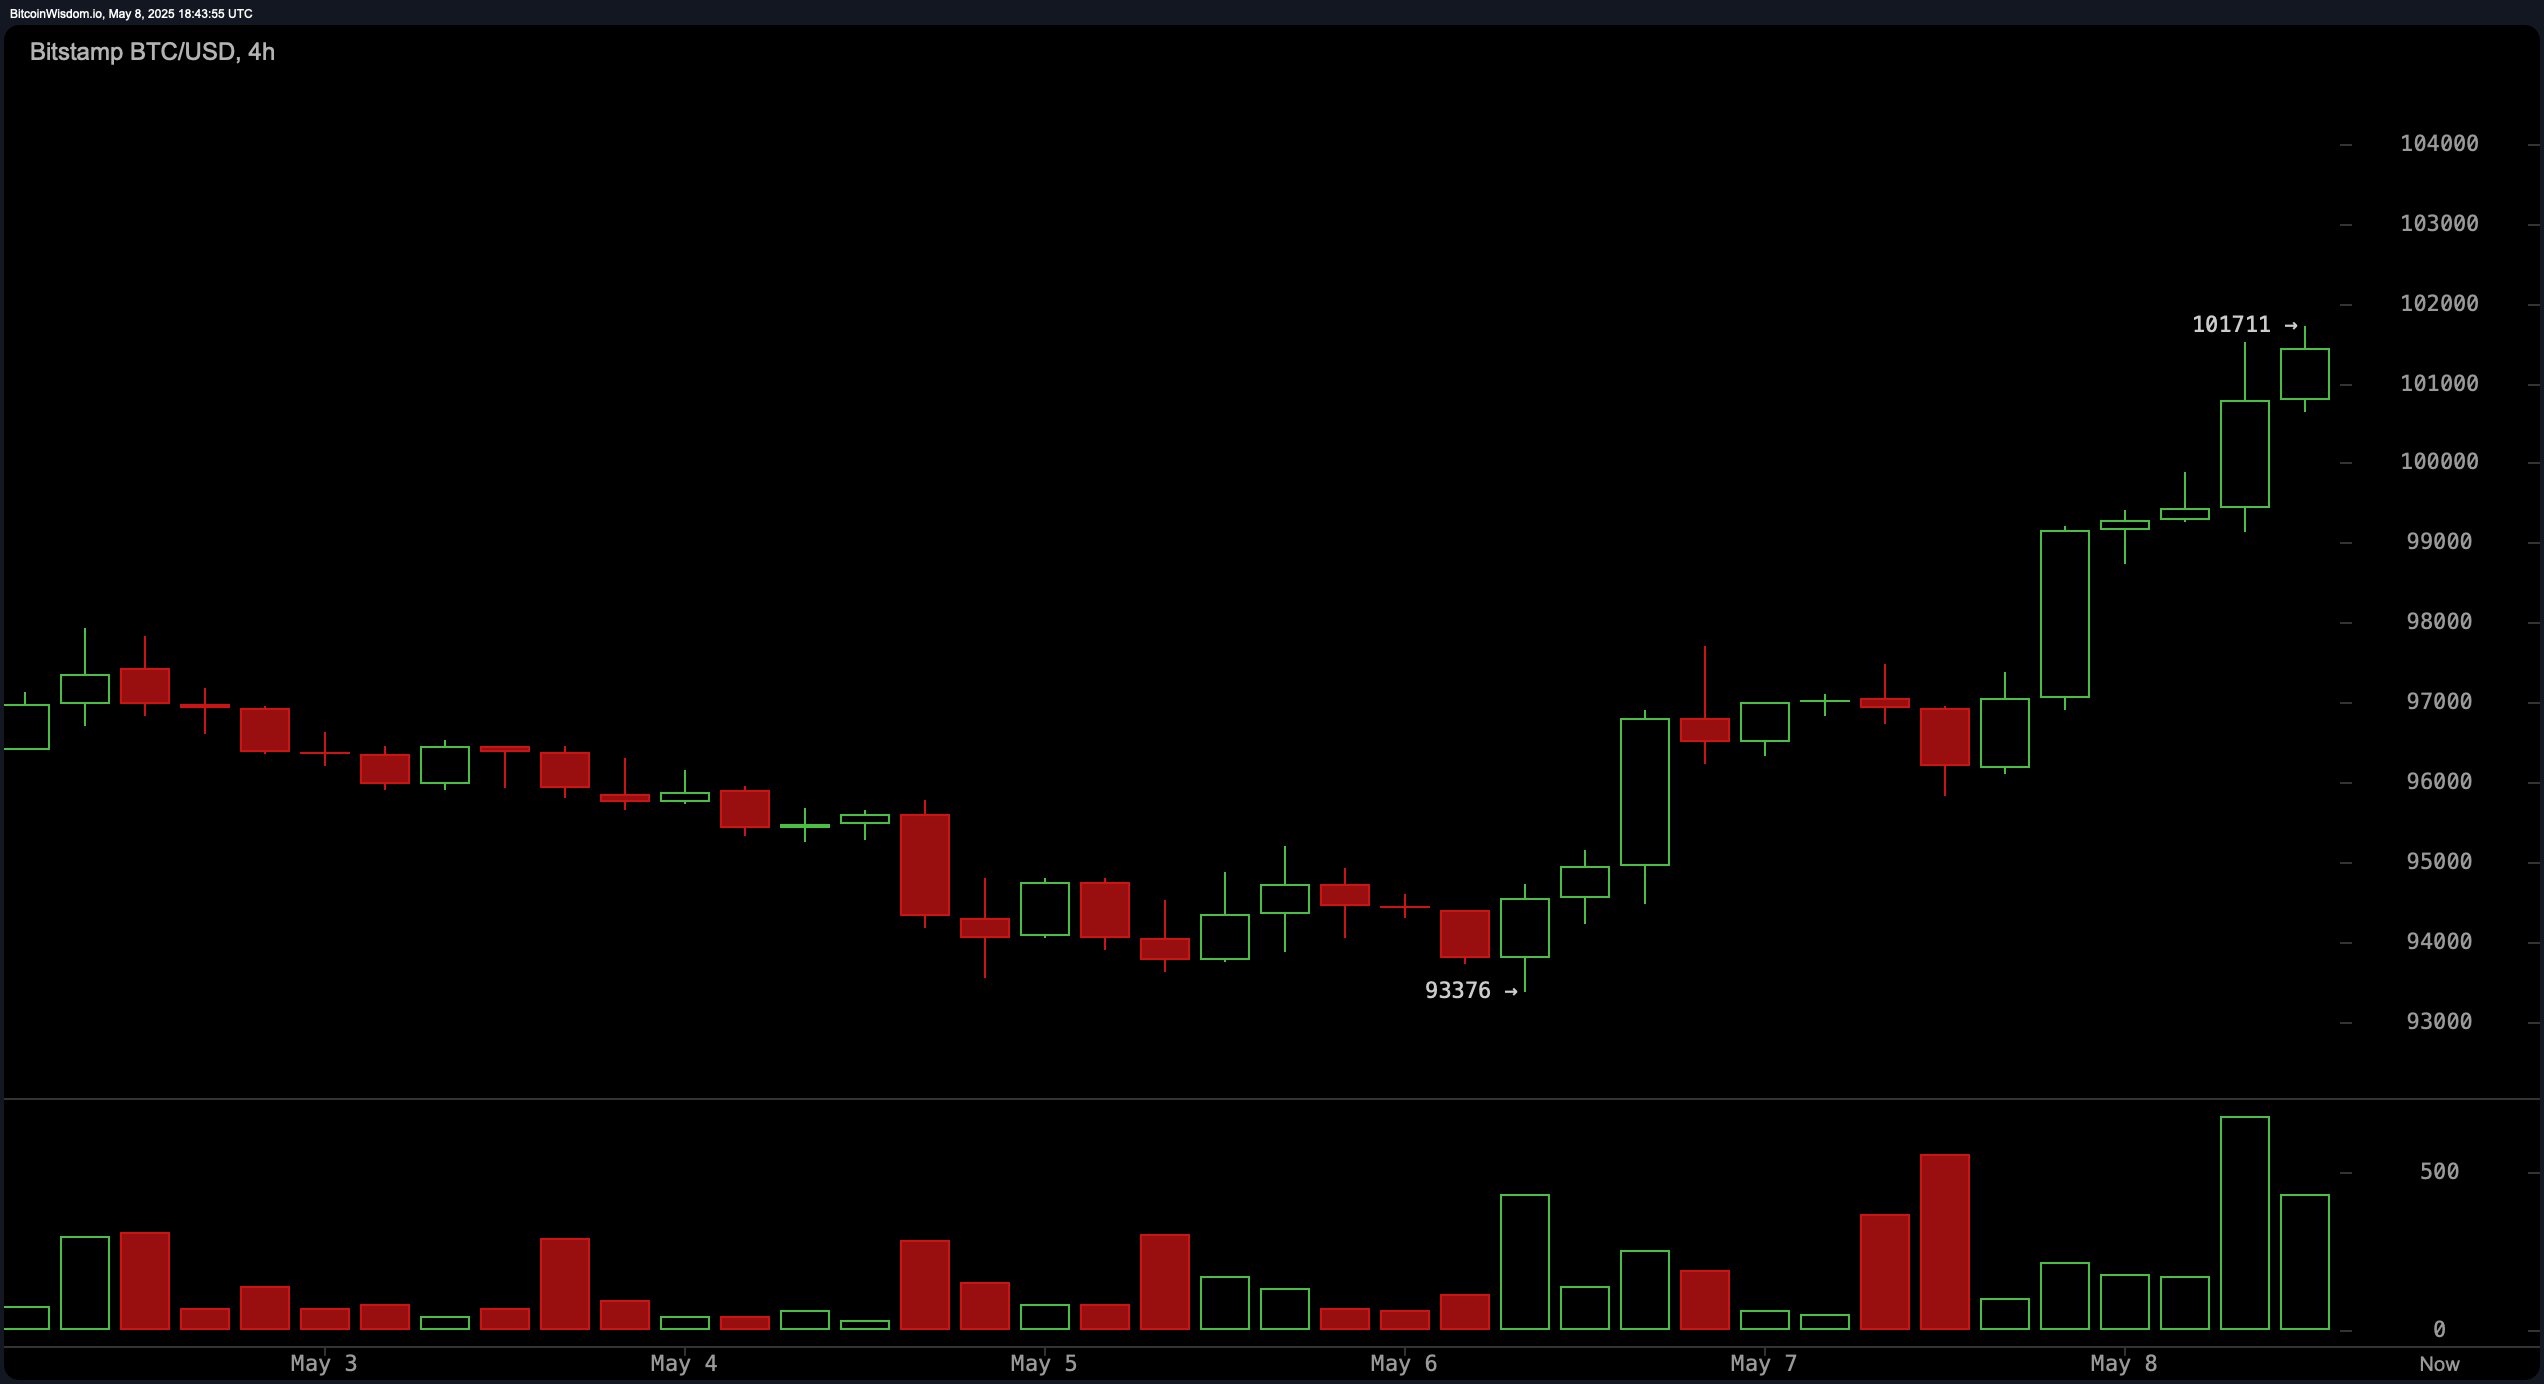
The four-hour bitcoin chart reflects a sharp V-shaped recovery from $93,376, characterized by robust buying activity and ascending candle structures. A recent spike in volume underscores renewed investor interest, yet resistance at $101,711 currently caps further advances. The critical support zone lies between $97,000 and $98,500, and a favorable entry could form near $99,000–$99,500, especially if a bullish reversal candle appears. However, repeated rejections at the upper resistance level may prompt cautious exits or short-term profit-taking.

BTC/USD 4H chart via Bitstamp on May 8, 2025.
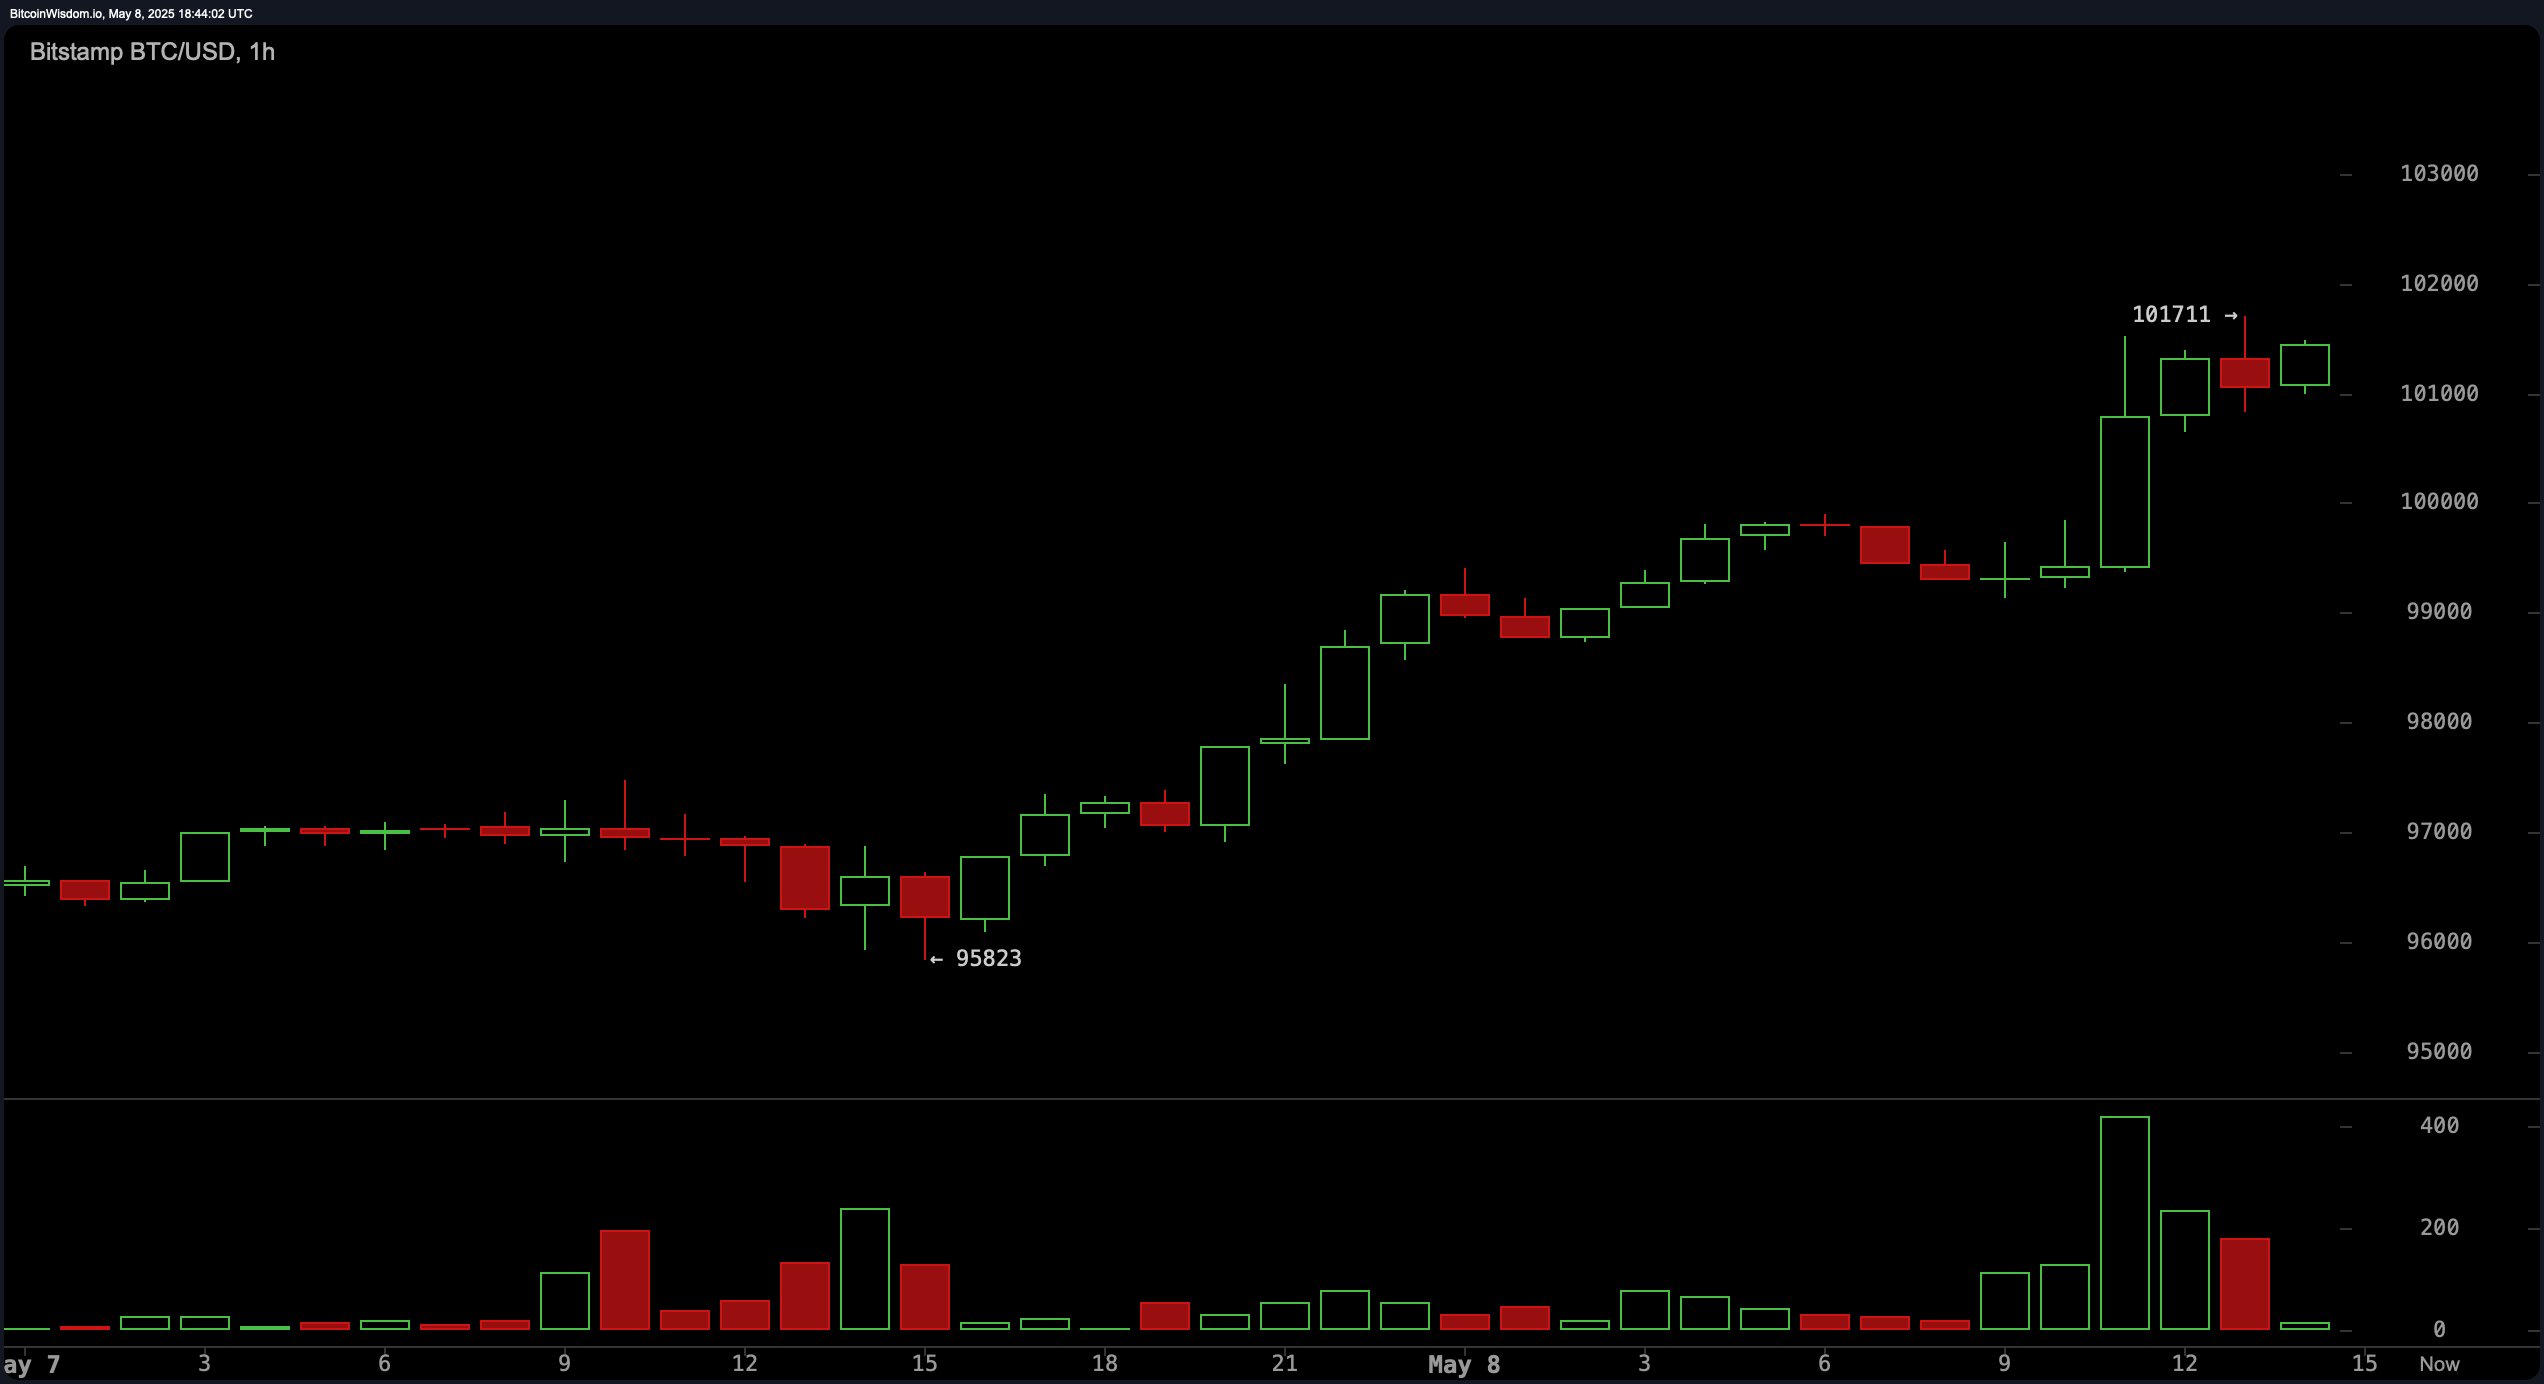
On the one-hour chart, bitcoin is undergoing a modest consolidation after a steep surge. Although volume surged during the breakout, it has since declined, suggesting momentum is cooling in the near term. Immediate support is found at $100,500, with deeper levels near $99,800. Intraday traders may look to scalp on bounces off these levels, placing tight stops under $99,500.

BTC/USD 1H chart via Bitstamp on May 8, 2025.
Oscillators provide a mixed, though slightly favorable, bias toward continued upward action. The relative strength index (RSI) at 73, Stochastic at 88, commodity channel index (CCI) at 158, and average directional index (ADX) at 31 all present neutral signals, indicating a market potentially pausing before its next move. However, the Awesome oscillator at 7,241, momentum indicator at 6,383, and moving average convergence divergence (MACD) level at 3,121 all issue positive signals, suggesting momentum is still leaning bullish.
The moving averages across all timeframes reflect unanimous bullish alignment. The exponential moving averages (EMA) and simple moving averages (SMA) at the 10-, 20-, 30-, 50-, 100-, and 200-period intervals all signal bull-leaning sentiment. With the EMA (10) at $96,391 and SMA (10) at $96,218 rising in tandem with price, the structure supports a continuation of the current trend. These averages confirm strong technical underpinnings, reinforcing the view that any retracements are likely to be short-lived within a bullish macro context.
Why Is the Price Rising?
Some say it’s big-money players jumping in, while others credit Trump’s trade agreements finally leaning positive. Sui Chung, CEO at CF Benchmarks, shared with Bitcoin.com News that it was institutional investors who helped lift the price back up.
“Bitcoin’s recent rally has been driven not only by upward price momentum but also by a broader shift in institutional sentiment—evident in both volatility metrics and derivatives market behavior,” the CF Benchmarks CEO said. “CF Benchmarks’ Bitcoin Volatility Index (BVX) has trended lower in recent sessions, falling over 20% in the past month, indicating that while prices are rising, the market’s implied risk premium is compressing.”
The CF Benchmarks executive added:
Historically, crypto rallies have coincided with heightened volatility; the inverse dynamic we’re seeing now points to a market where price discovery is increasingly shaped by stable, informed capital flows. Further reinforcing this sentiment, the CME options surface displays a pronounced positive skew across tenors, suggesting that market participants are paying a premium for upside exposure. The combination of volatility compression and asymmetric positioning signals growing confidence in the durability of this rally.
Bull Verdict:
If bitcoin maintains support above the $99,000–$100,000 range and volume confirms follow-through on higher timeframes, the path toward retesting and potentially surpassing its all-time high remains viable. With all major moving averages signaling continued upward momentum and several key oscillators issuing buy signals, the broader trend remains bullish and resilient, favoring upside continuation.
Bear Verdict:
Should bitcoin fail to hold the $99,000–$100,000 support zone, particularly amid declining volume and failed retests of the $101,700 resistance level, a deeper retracement toward $95,000 or lower could materialize. With several oscillators in neutral territory and short-term momentum cooling, caution is warranted if key support breaks and buying interest begins to fade.
免责声明:本文章仅代表作者个人观点,不代表本平台的立场和观点。本文章仅供信息分享,不构成对任何人的任何投资建议。用户与作者之间的任何争议,与本平台无关。如网页中刊载的文章或图片涉及侵权,请提供相关的权利证明和身份证明发送邮件到support@aicoin.com,本平台相关工作人员将会进行核查。


