Charts
DataOn-chain
VIP
Market Cap
API
Rankings
CoinOSNew
CoinClaw🦞
Language
  • 简体中文
  • 繁体中文
  • English
Leader in global market data applications, committed to providing valuable information more efficiently.

Features

  • Real-time Data
  • Special Features
  • AI Grid

Services

  • News
  • Open Data(API)
  • Institutional Services

Downloads

  • Desktop
  • Android
  • iOS

Contact Us

  • Chat Room
  • Business Email
  • Official Email
  • Official Verification

Join Community

  • Telegram
  • Twitter
  • Discord

© Copyright 2013-2026. All rights reserved.

简体繁體English
|Legacy

Crazy Weekend: 10 Images Analyzing the Solana Moment in the Crypto Market

CN
PANews
Follow
1 year ago
AI summarizes in 5 seconds.

Author: Ignas, Crypto KOL

Compiled by: Felix, PANews

Last weekend may have been the craziest weekend in the crypto space. The following 10 charts provide a visual understanding:

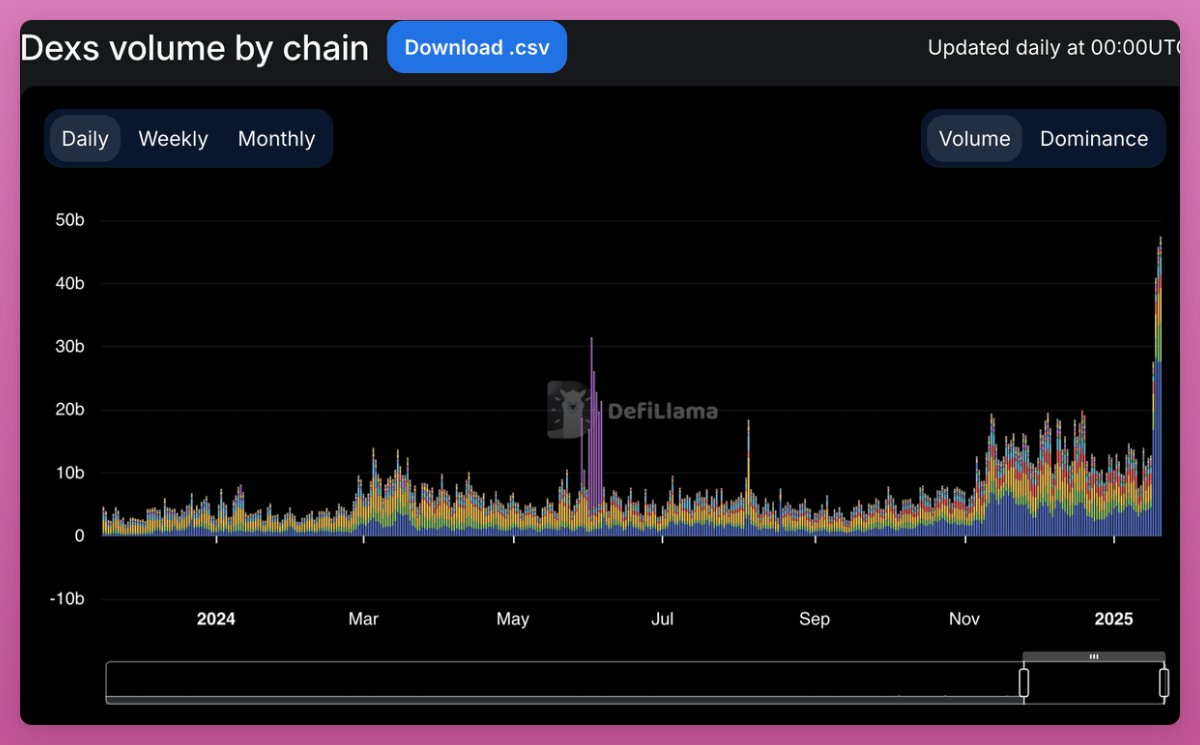
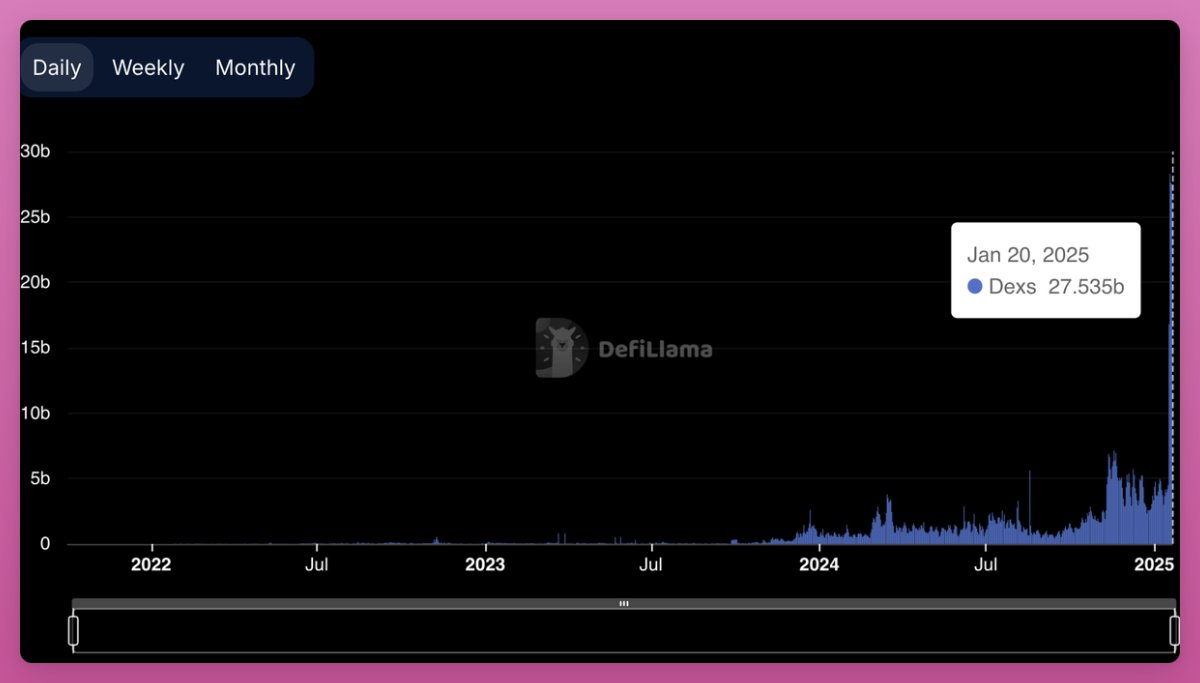
Record DEX Trading Volume:

The DEX trading volume on the Solana network reached $27 billion, far exceeding ETH's $5 billion.

Crazy Weekend: 10 Charts Analyzing the Crypto Market's Solana Moment

The DEX trading volume on Solana surged from an average of about $5 billion to $27 billion, a growth of 5.4 times.

Crazy Weekend: 10 Charts Analyzing the Crypto Market's Solana Moment

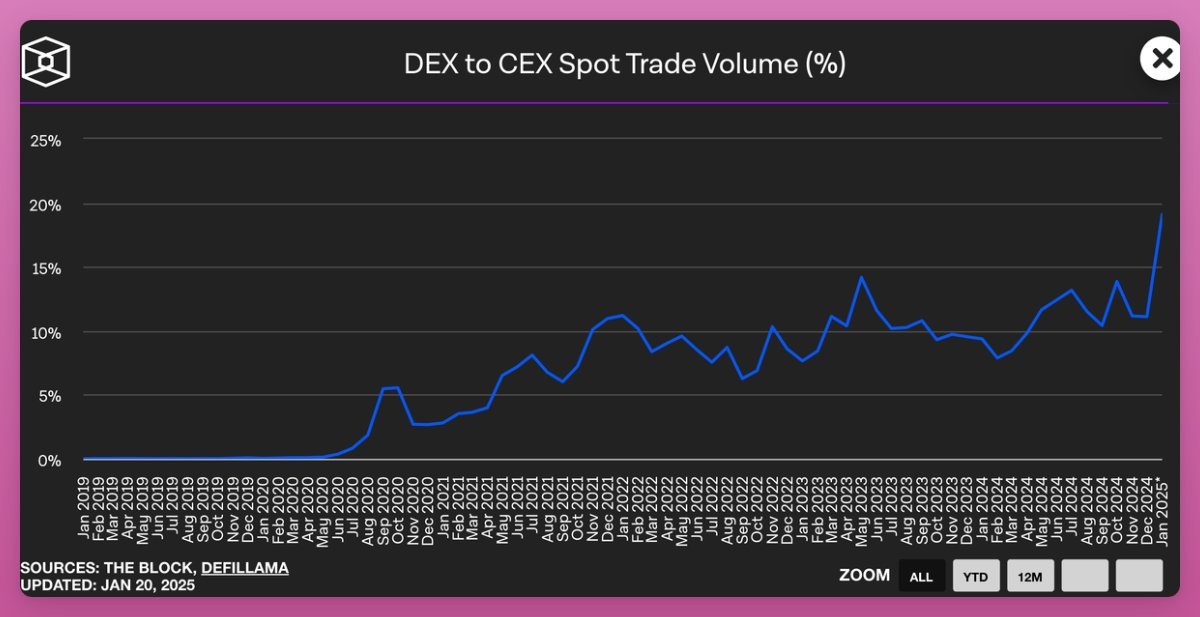
As a result, the DEX's share of the total spot trading volume relative to CEX reached a historic high of 19%.

Price discovery is happening on DEX, not on CEX.

Crazy Weekend: 10 Charts Analyzing the Crypto Market's Solana Moment

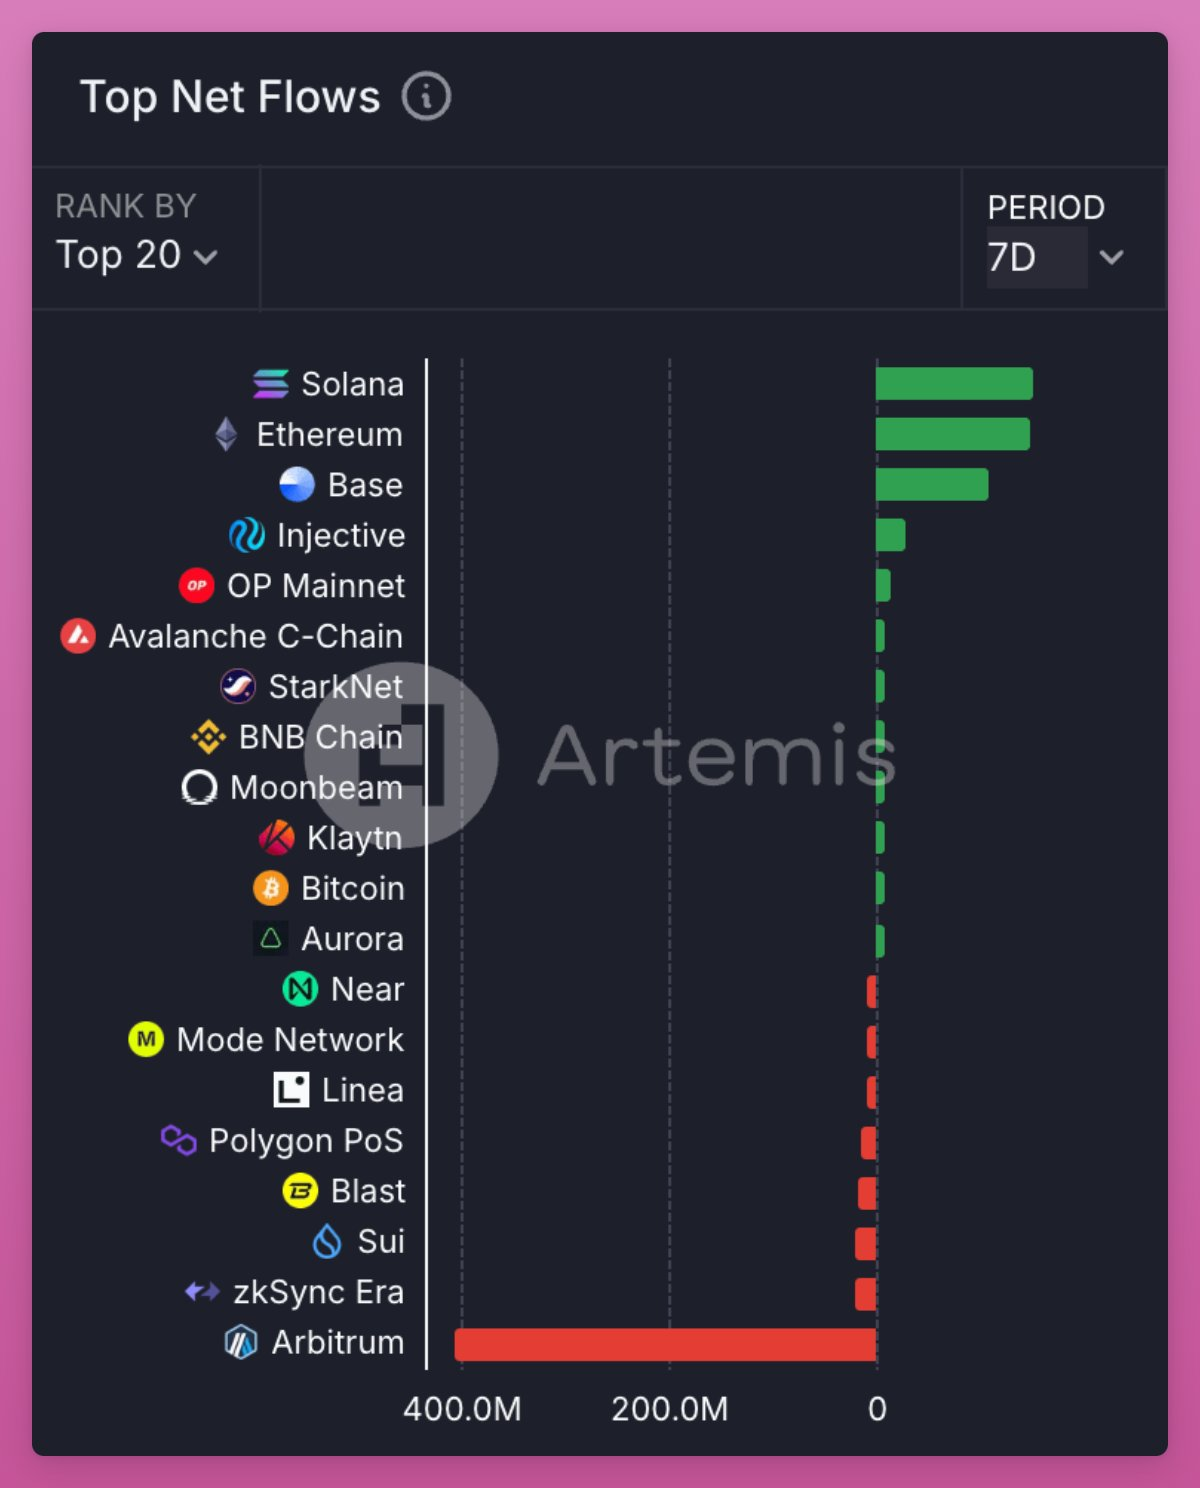
Funds flowed from Arbitrum to Solana, ETH, and Base.

The Solana network saw a net inflow of $153 million, while Arbitrum lost $405 million in a week.

Crazy Weekend: 10 Charts Analyzing the Crypto Market's Solana Moment

The following chart provides another visualization of Solana's flow.

DeBridge analysis shows that approximately $300 million flows into Solana weekly, mainly from Ethereum, Base, and Arbitrum.

Solana's outflow reached about $140 million.

Crazy Weekend: 10 Charts Analyzing the Crypto Market's Solana Moment

Phantom reported over 8 million requests per minute.

Phantom users had a trading volume of $1.25 billion, with 10 million transactions.

Assuming Phantom's current fee rate is 0.85%, the Swap fees amount to $10.6 million.

On the day TRUMP coin was launched, SOL to ETH recorded the largest single-day increase since 2021, with a 25% rise further dampening the morale of the Ethereum community and increasing pressure for internal reforms within the Ethereum Foundation. Crazy Weekend: 10 Charts Analyzing the Crypto Market's Solana Moment

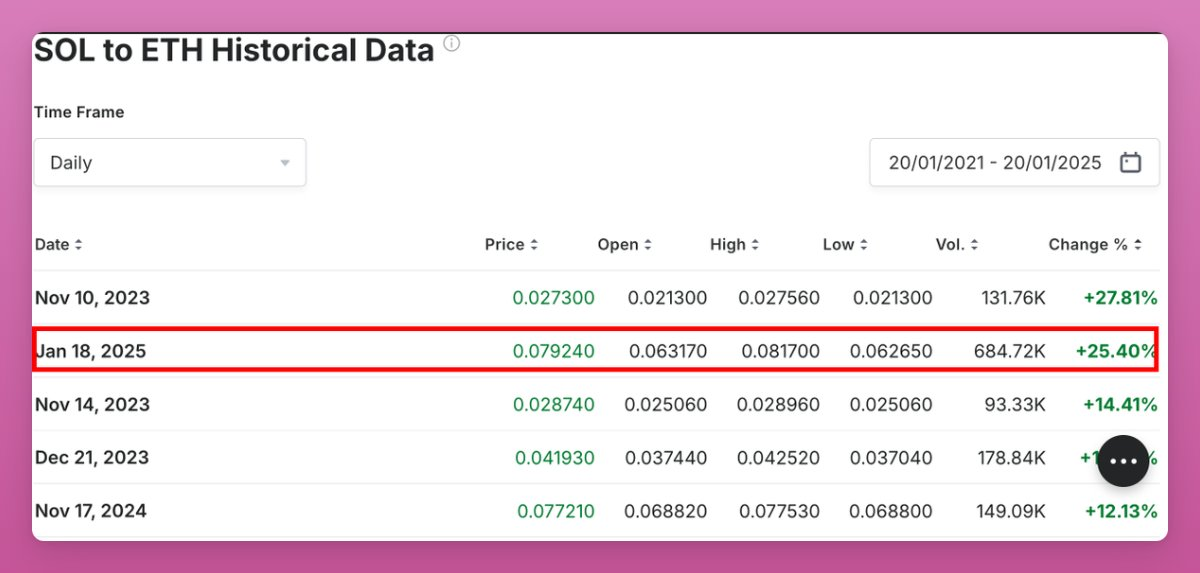
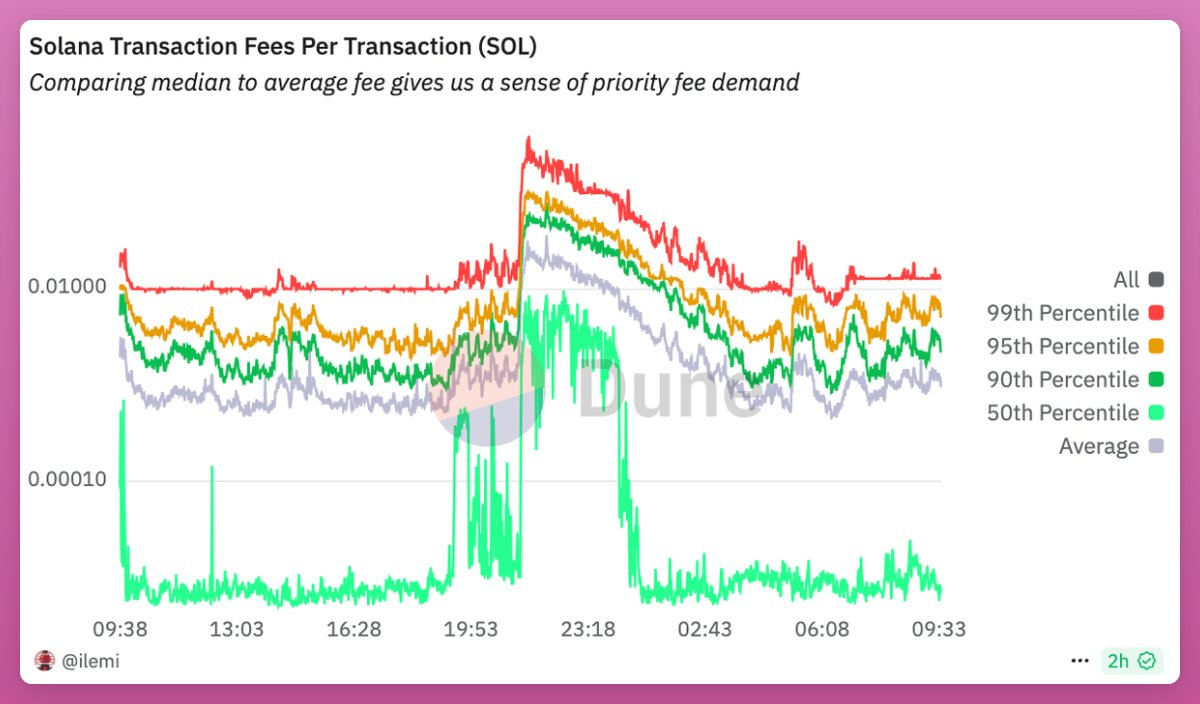
However, not everything is positive for Solana:

  • Average fees increased 20 times
  • Many people were unable to complete transactions

Crazy Weekend: 10 Charts Analyzing the Crypto Market's Solana Moment

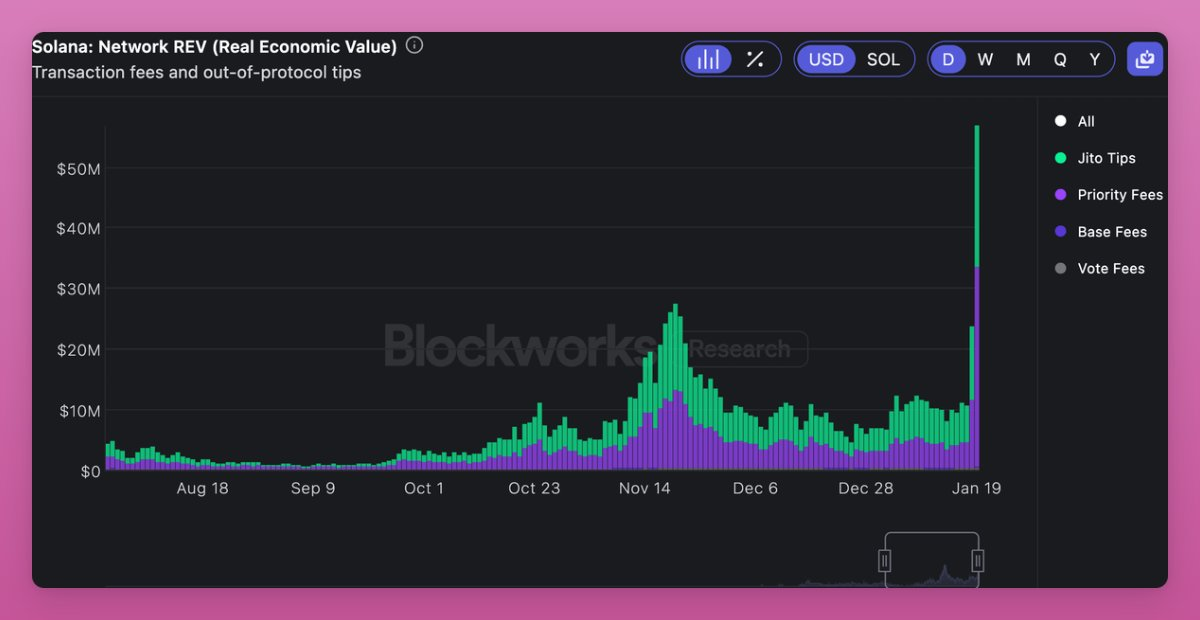
High fees are very beneficial for SOL stakers.

A total of $57 million in fees was paid, with most being $33 million in priority fees and $23.5 million in Jito Tips (Jito validation tips).

Crazy Weekend: 10 Charts Analyzing the Crypto Market's Solana Moment

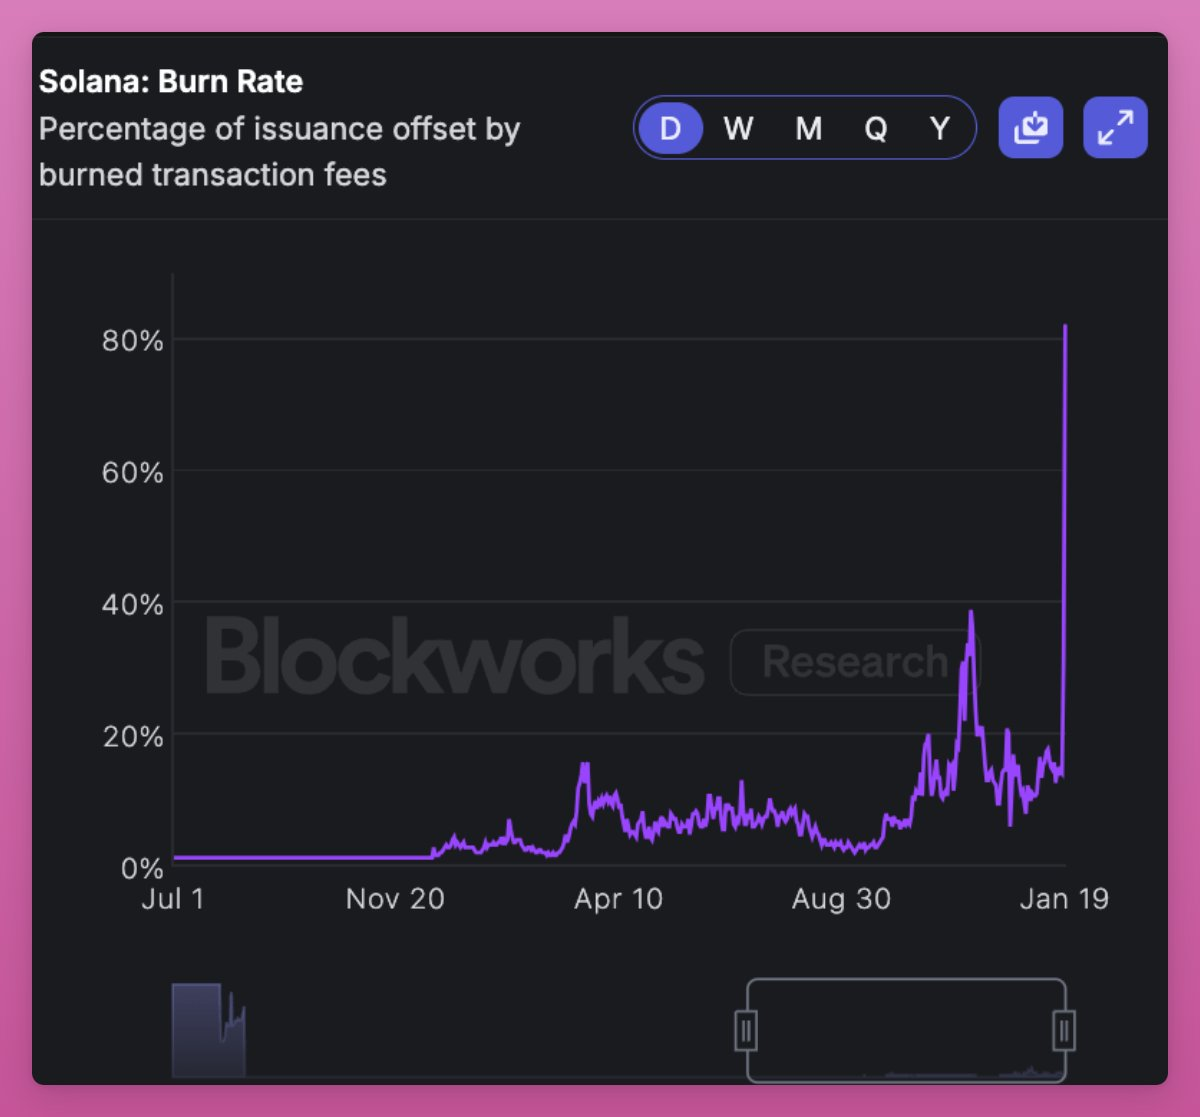
Importantly, SOL burned a record approximately $16.7 million.

Do not use "ultra-sound money" as an excuse, as the amount burned over the weekend accounted for 81% of SOL's issuance, far exceeding the daily rate.

The following chart shows Solana's burn rate:

Crazy Weekend: 10 Charts Analyzing the Crypto Market's Solana Moment

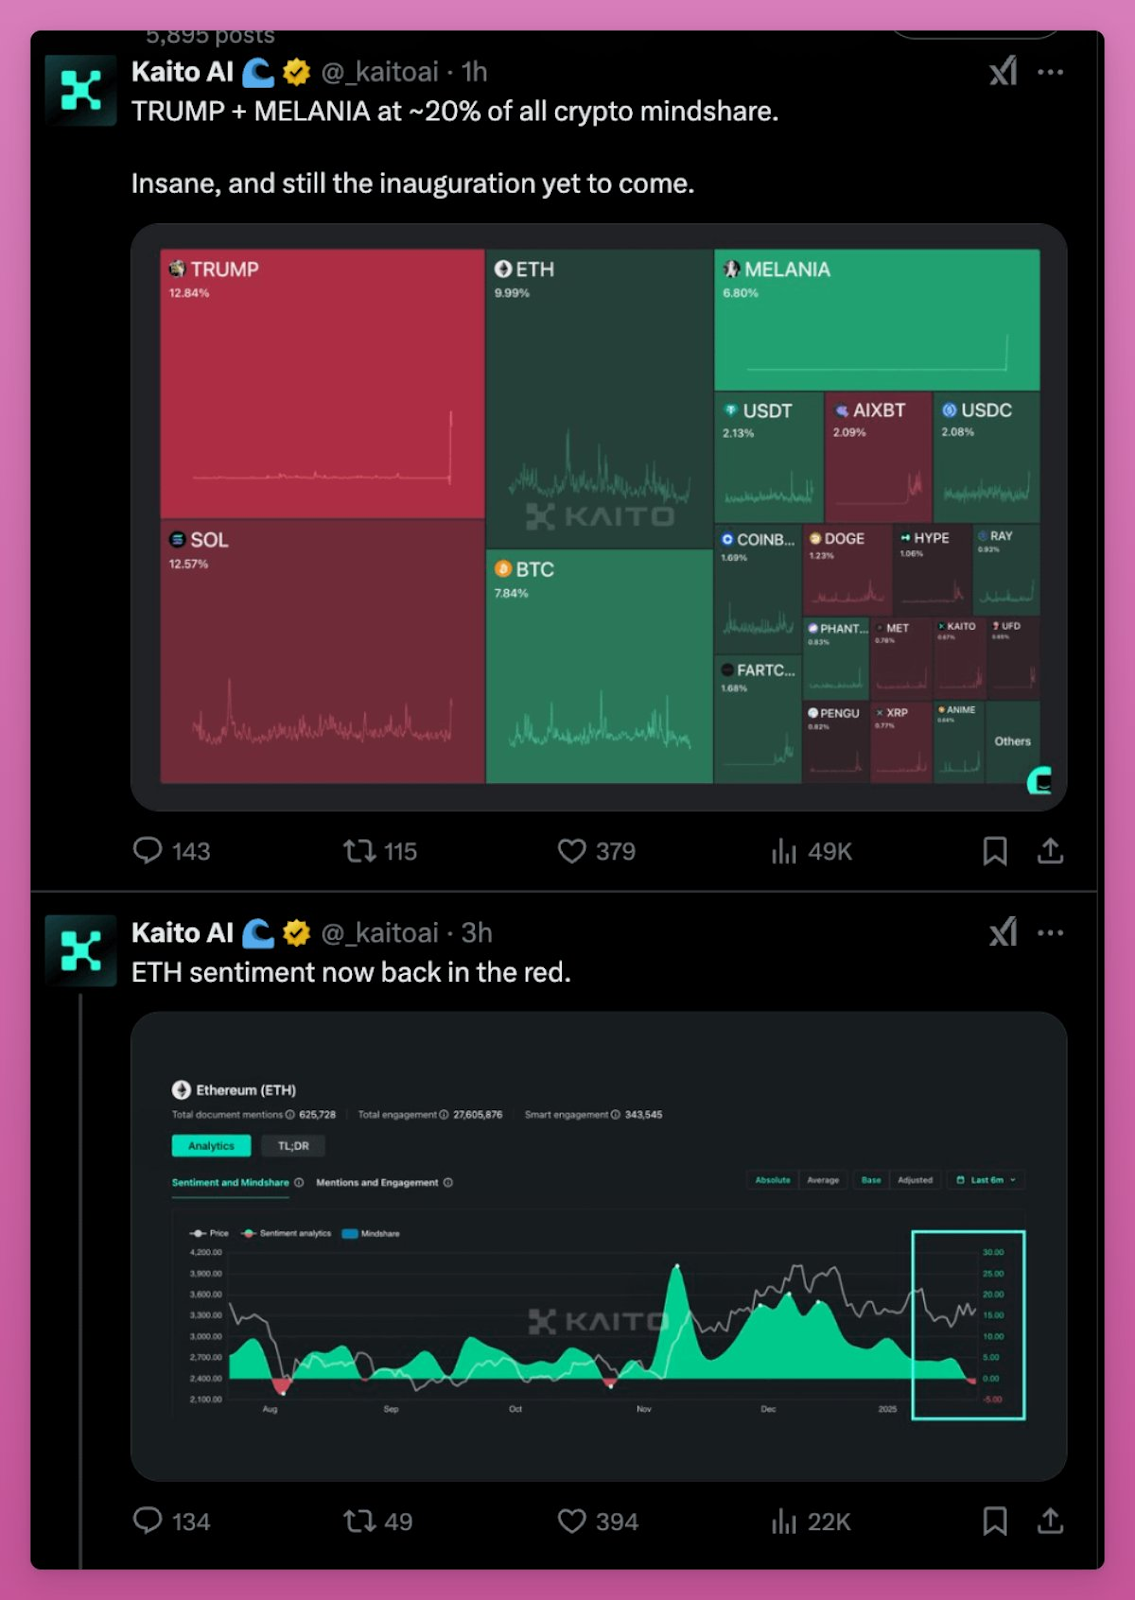
Overall, it was a crazy weekend for Solana, with TRUMP, MELANIA, and SOL dominating the market. Meanwhile, market sentiment regarding ETH turned negative again.

Crazy Weekend: 10 Charts Analyzing the Crypto Market's Solana Moment

Related Reading: The Trump Family is at it Again! "First Lady Coin" MELANIA briefly surpasses a market cap of $10 billion, with multiple token details sparking market controversy

免责声明:本文章仅代表作者个人观点,不代表本平台的立场和观点。本文章仅供信息分享,不构成对任何人的任何投资建议。用户与作者之间的任何争议,与本平台无关。如网页中刊载的文章或图片涉及侵权,请提供相关的权利证明和身份证明发送邮件到support@aicoin.com,本平台相关工作人员将会进行核查。

BitMart钱包:开启智能交易新时代
广告
|
|
APP
Windows
Mac
Share To

X

Telegram

Facebook

Reddit

CopyLink

|
|
APP
Windows
Mac
Share To

X

Telegram

Facebook

Reddit

CopyLink

Selected Articles by PANews

2 hours ago
BTC Risk Model: An Article That Clarifies Long/Short-Term Trading Thoughts
5 hours ago
Trading Moment: The U.S. stock market has not yet shown a bottom-fishing signal. After a rare "six consecutive declines," can Bitcoin repeat the rebound trend of 2019?
7 hours ago
How to determine in 3 seconds whether a candlestick chart is worth buying.
View More

Table of Contents

|
|
APP
Windows
Mac
Share To

X

Telegram

Facebook

Reddit

CopyLink

Related Articles

avatar
avatar深潮TechFlow
12 minutes ago
IOSG Weekly Brief | $PUMP Valuation Breakdown: On-chain Data Disproves "Fake Volume" Theory, Where Does the Real Discount Come From?
avatar
avatar链捕手
48 minutes ago
PUMP Valuation Breakdown: On-chain Data Disproves the "Fake Volume" Theory, Where Does the Real Discount Come From?
avatar
avatar深潮TechFlow
2 hours ago
TechFlow Intelligence Bureau: Ethereum Foundation completes largest single staking in history, Morgan Stanley Bitcoin ETF approved by NYSE.
avatar
avatarPANews
2 hours ago
BTC Risk Model: An Article That Clarifies Long/Short-Term Trading Thoughts
avatar
avatar律动BlockBeats
2 hours ago
60 Selected Skills, Workflows, and Open Source Projects, The Most Comprehensive Claude Advanced List
APP
Windows
Mac

X

Telegram

Facebook

Reddit

CopyLink