Compiled by: yongxin, Overseas Unicorn
Dario Amodei, co-founder and CEO of Anthropic, shared his views in October this year on how AI will significantly change human society, particularly expressing high expectations for developments in biology and neuroscience. He predicts that powerful AI-supported research in biology and neuroscience will accelerate dramatically, with advancements that would typically take 50-100 years potentially compressed into just 5-10 years. We are in a “compressed 21st century”: “With the emergence of powerful AI, we may achieve biological and medical breakthroughs that would have otherwise required the entire 21st century within just a few years.”
AI in life sciences is not just a data analysis tool; AI has the potential to comprehensively accelerate the research process, acting as a “virtual biologist”: designing experiments, guiding research, and even controlling laboratory robots to perform experimental operations. Many significant breakthroughs in biology have historically come from a small number of genius researchers, and the addition of AI is akin to adding more creative researchers to the team, potentially increasing the rate of key breakthroughs by tenfold or more.
At this juncture, to grasp the future development of Biotech, it is necessary to review the successful models of the industry’s past. This article is based on Pear VC's research on the Top 50 Biotech companies over the past 15 years (limited to North America and Europe). The research meticulously analyzes the product distribution, founder backgrounds, capital sources, core drivers, and financial returns of these Biotech companies:
• Among the Top 50, there are far more drug development companies (46) than diagnostic companies (3) and medical device companies (1). Most key drugs from drug development companies originate from academic institutions (20 out of 46); the ratio of platform-driven companies to asset-driven companies is roughly equal, with 24 and 22 respectively.
• 22 of the Top 50 are VC-incubated, with Third Rock, ARCH, Atlas, and Flagship being common VCs behind them. These VCs are closely involved in the operations of Biotech companies through Venture Studio or similar models.
• Half of the Top 50 Biotech companies in North America and Europe were founded in the San Francisco Bay Area or the Greater Boston area, with only three established outside the United States.
• Comparing the Top 50 in the tech industry and the Biotech industry, we find that although the average MOIC in the tech industry is higher than that in the Biotech industry, the overall MOIC in both Top 50 lists is very close. Moreover, the time to first exit for the Top 50 in the Biotech industry is significantly shorter than that in the tech industry, at 4.7 years and 8.2 years respectively.
• In the future, we predict that drug development companies will continue to dominate; more platform companies will emerge.
• The pharmaceutical industry spends over $200 billion annually on global R&D, but investment in software is far from sufficient, with many Biotech labs still using outdated and fragmented software systems. We predict that LLM and AI will have a more significant impact on the drug development value chain, such as drug discovery or target discovery. Therefore, the demand for smarter software in the Biotech industry will spur the emergence of a wave of Biotech SaaS.
01. Research Methodology
Introduction
Life science companies are dedicated to translating scientific discoveries into drugs, diagnostic tools, and technologies that significantly improve people's quality of life. Over the past 15 years, the field has made tremendous progress: various impactful drugs have been approved, such as COVID-19 vaccines, checkpoint inhibitors, and GLP-1 agonists; emerging therapies have matured, including gene therapy, cell therapy, gene editing, protein degraders, antibody-drug conjugates (ADCs), and radiopharmaceuticals; biological research and diagnostic technologies have become increasingly widespread, such as NGS, epigenetics, transcriptomics, proteomics, single-cell biology, spatial biology, and organoids.
Many biotech startups have created immense value for patients, investors, and the industry. In this article, we selected the Top 50 Biotech companies focused on drug development (therapeutics), diagnostic methods (diagnostics), and medical devices (life sciences tools). Due to the long R&D cycles, this article focuses on companies founded in the past 15 years.
We used the valuation of companies at the time of their IPO or acquisition as a measure, selecting and ranking 50 companies. For companies that went public and remained independent (although valuation is not a perfect indicator), we examined their market capitalization at IPO or as of December 31, 2023.
To better understand the characteristics of the Top 50 Biotech companies, we researched their core products, backgrounds of founding CEOs and scientific founders, sources of core projects and technologies, founding locations, time to first exit, and other characteristics.
• Research Methodology
We used Pitchbook to filter startups focused on drug development, diagnostic methods, and medical devices, founded between January 1, 2009, and December 31, 2023, all established in the United States, Canada, and Europe. We then investigated the prepayments, proposed valuations at the time of acquisition, and their market capitalization at IPO or as of December 31, 2023, selecting the highest value as the basis for ranking.
It is worth noting that some companies had high valuations at IPO but failed to achieve those valuations due to poor subsequent clinical trial results, and such companies may also be included. Different investors have varying strategies for exiting after a company goes public, and we adopted the above selection criteria to prioritize companies with the greatest potential for financial returns to investors during this period.
In this article, we do not consider spinouts from large companies. For example, we excluded Cerevel Therapeutics and Viela Bio (the former spun out from Pfizer in 2018 and was acquired by AbbVie for $8.7 billion in 2023; the latter spun out from AstraZeneca in 2018 and was acquired by Horizon for $3 billion in 2021). However, we decided to include Grail, Telavant, and Immunovant in the analysis. Grail focused on product applications different from Illumina's NGS tool platform after spinning out from Illumina, while Telavant originally belonged to Roivant, which is itself a startup.
In addition, we cross-referenced Crunchbase, Pitchbook, and news and reports from the biotechnology industry to supplement several companies into the analysis list. The company and founder information in this article is sourced from primary data, such as company website descriptions, press releases, SEC filings, and news.
• Research Limitations
1) This article uses valuation as a ranking criterion, but this standard may not perfectly reflect a company's intrinsic value or influence.
2) Many companies ultimately bring significant benefits to patients or the industry but were exited early at low valuations; these companies are not included in the analysis.
3) Some selected companies had high valuations at IPO or acquisition but failed to achieve those valuations due to clinical or commercial failures.
4) This article focuses only on companies that have achieved significant success and does not compare them with relatively unsuccessful companies, so the results may be subject to survivor bias.
5) The data and resources available are limited.
6) The valuations used for ranking have not been adjusted for inflation.
02. Top 50 in the Biotech Industry
Products
In the Top 50 Biotech companies, there are 46 drug development companies (92%), 3 diagnostic companies (6%), and 1 medical device company (1%).
Pear VC’s Biotech Behemoth rankings
The overview of their main products is as follows:
Drug Development Companies
• Drug development companies focus on indications
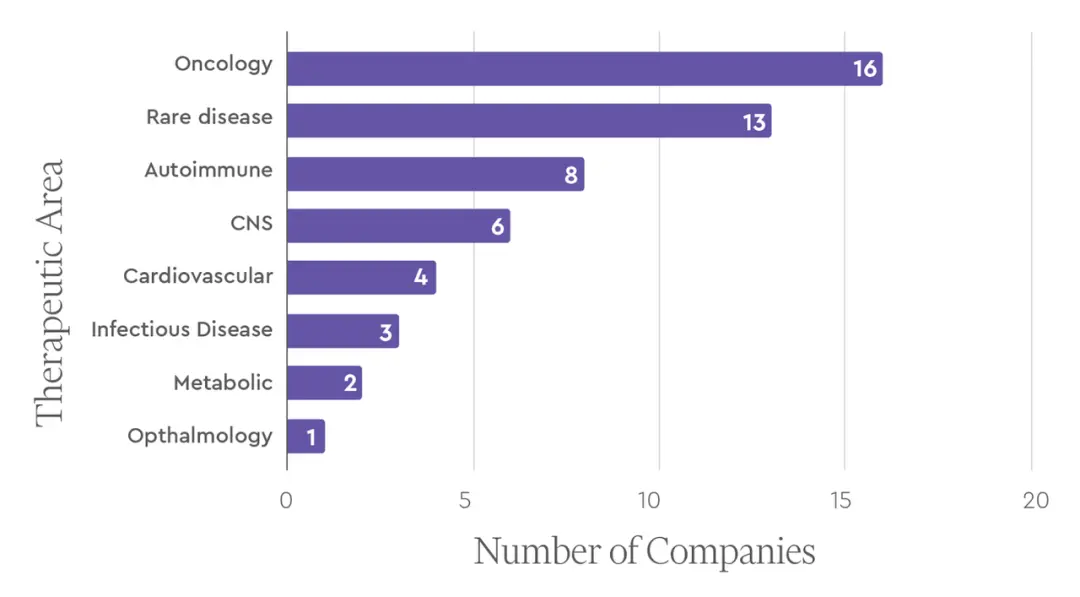
These 46 drug development companies cover major therapeutic areas, including oncology, immunology, central nervous system (CNS) diseases, and infectious diseases. Among them, oncology is the most common primary therapeutic area (16 companies, accounting for 34.78%), followed by rare diseases (13 companies, accounting for 28.26%).
• Clinical stages of drug development company products
(As of the end of 2023)
As of the end of 2023, more than half (52%) of the major pharmaceutical projects from these drug development companies have received FDA approval, about a quarter have entered Phase III clinical trials, while the rest are in earlier clinical stages.
• Overview of approved drugs from drug development companies
We investigated the approval status of drugs developed by the aforementioned drug development companies and found that company valuations are generally positively correlated with the expected peak sales of approved drugs.
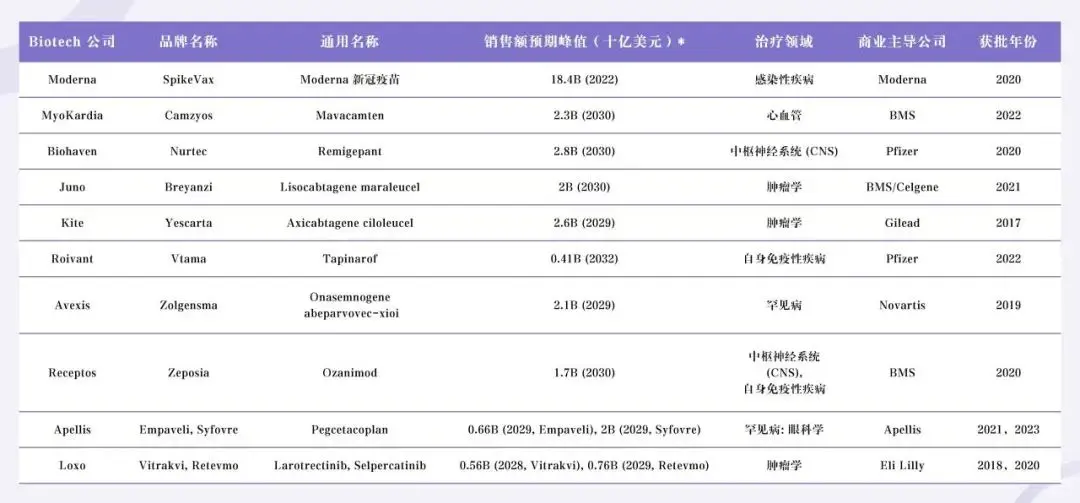
Source: GlobalData
• Platform-driven or asset-driven?
Biotech companies that are platform-driven rely on core technology platforms to develop multiple therapeutic or diagnostic products, while asset-driven companies focus on the development and commercialization of a single or a few specific products.
Among the 46 drug development companies mentioned above, platform-driven companies (24 in total) slightly outnumber asset-driven companies (22 in total), with both types being relatively balanced. Here, a platform is defined as a key technology or research method that can yield multiple assets (therapeutic or diagnostic products). Several major themes exist among platform-driven companies, including:
• Cell therapy: such as Juno, Kite, Sana, Lyell, Arcellx
• CRISPR technology: such as CRISPR Therapeutics, Intellia
• Computation-driven drug development methods: such as Nimbus, Recursion
• Gene therapy: such as Avexis, Spark, Krystal Biotech, Audentes
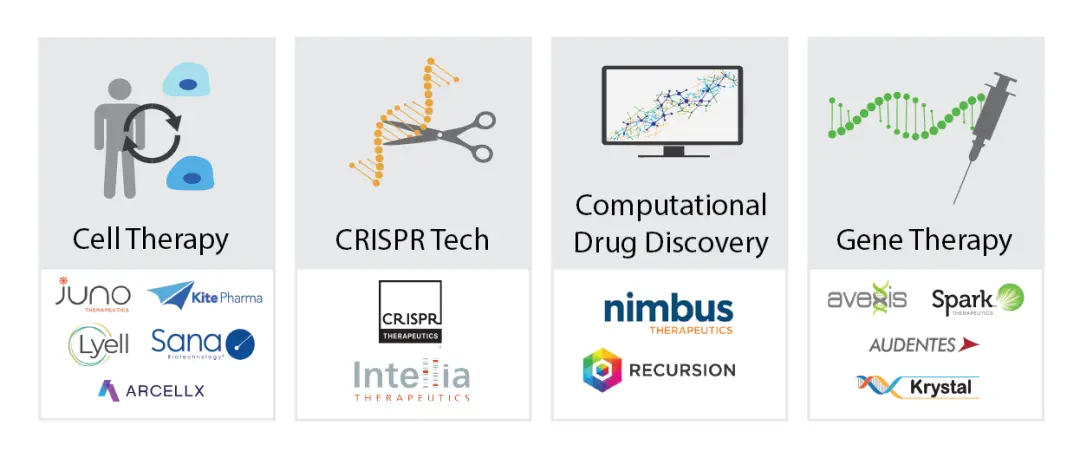
Four major themes of platform-driven companies
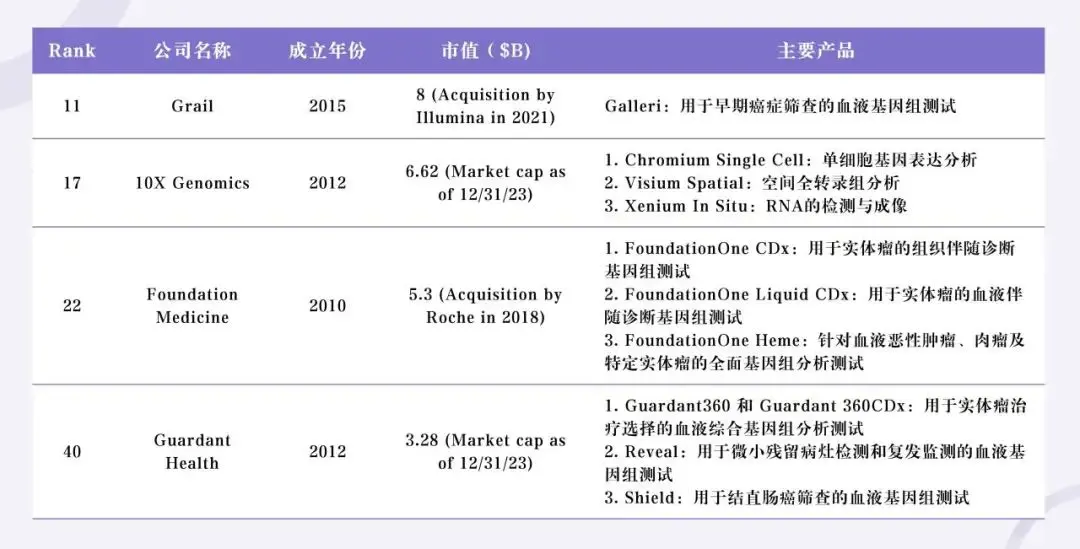
Diagnostic Companies & Medical Device Companies
Among the top 50 companies, only 4 focus on the diagnostic or medical device field. Grail was founded in 2018 and developed and launched the Galleri test for early detection of multiple cancers. 10X Genomics was founded in 2012, with products related to detailed sequencing and characterization of cell genomes and transcriptomes. Foundation Medicine was founded in 2010 and developed various tissue-based oncology gene tests, being acquired by Roche in 2015. Guardant Health was founded in 2012 and developed various liquid biopsy-based oncology tests for early and late-stage cancer detection.
Founder Overview
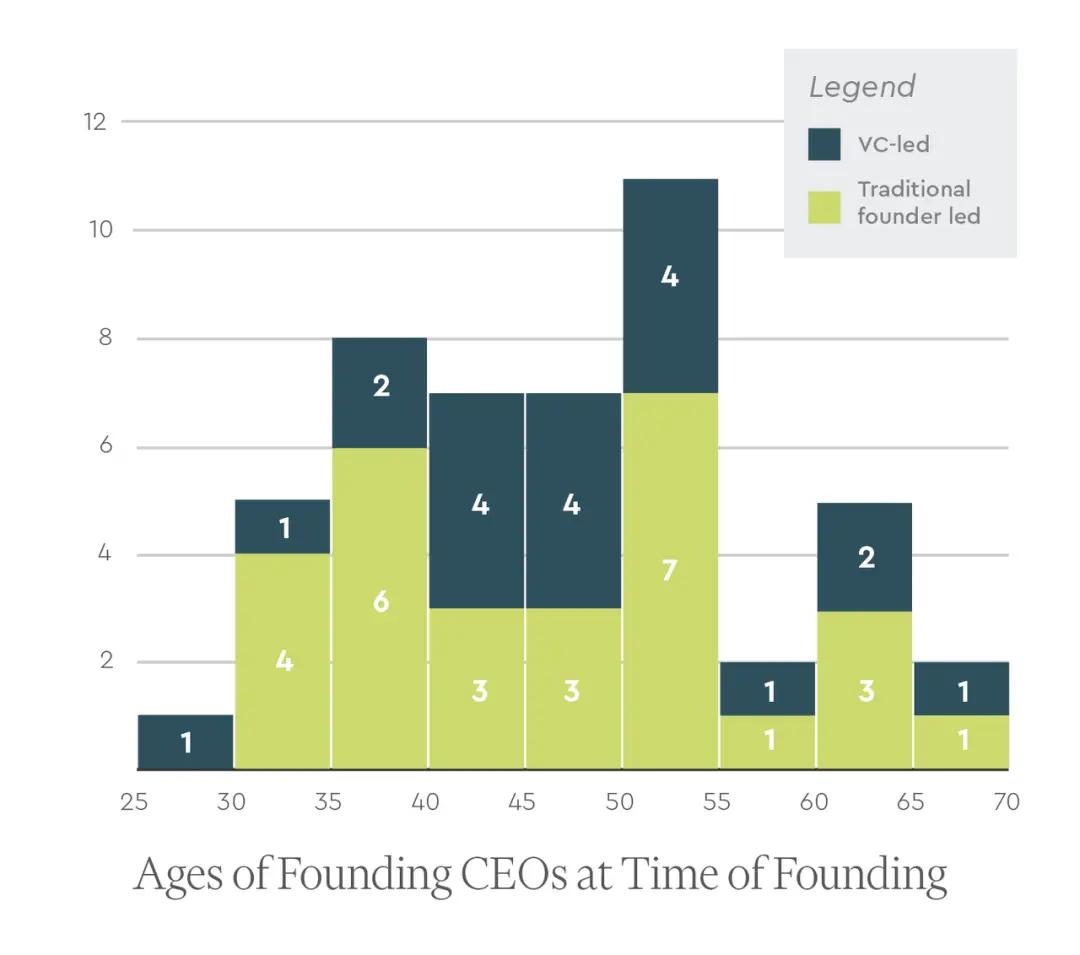
Age of Founding CEOs
Among the top 50 companies, we found age information for the founding CEOs of 47 companies (data error of ±1 year). The analysis revealed that the average age of founding CEOs is approximately 46 years (data error of ±10 years). Among them, the average age of founding CEOs in drug development companies is 47 years (±10 years), while in diagnostic/device companies (4 in total), this number is only 38 years (±5 years).
Additionally, we found that whether or not supported by VC incubation does not significantly affect the average age of founding CEOs. For VC-led companies, the average age of founding CEOs is about 48 years (±10 years), which is only slightly higher than that of founding CEOs in non-VC-led companies (approximately 46 years, ±10 years).
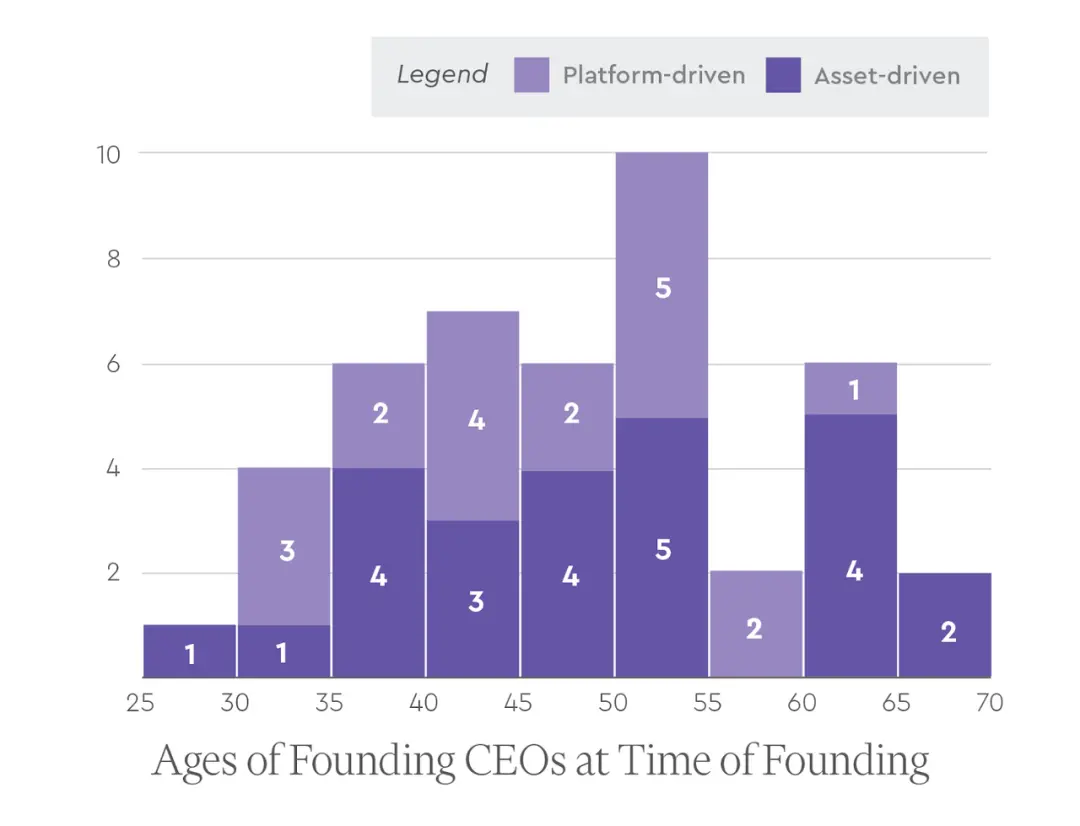
We further explored whether there is a difference in the ages of founding CEOs between platform-driven and asset-driven companies. The results showed that the average age of founding CEOs in platform-driven companies is 46 years (data error of ±9 years), slightly lower than the average age of founding CEOs in asset-driven companies at 49 years (±11 years), but the difference is not significant.
Experience of Founding CEOs
In the Top 50 Biotech companies, slightly more than half (about 53%) of the founding CEOs are first-time CEOs, while the rest have CEO experience in one or more companies, which is somewhat unexpected.
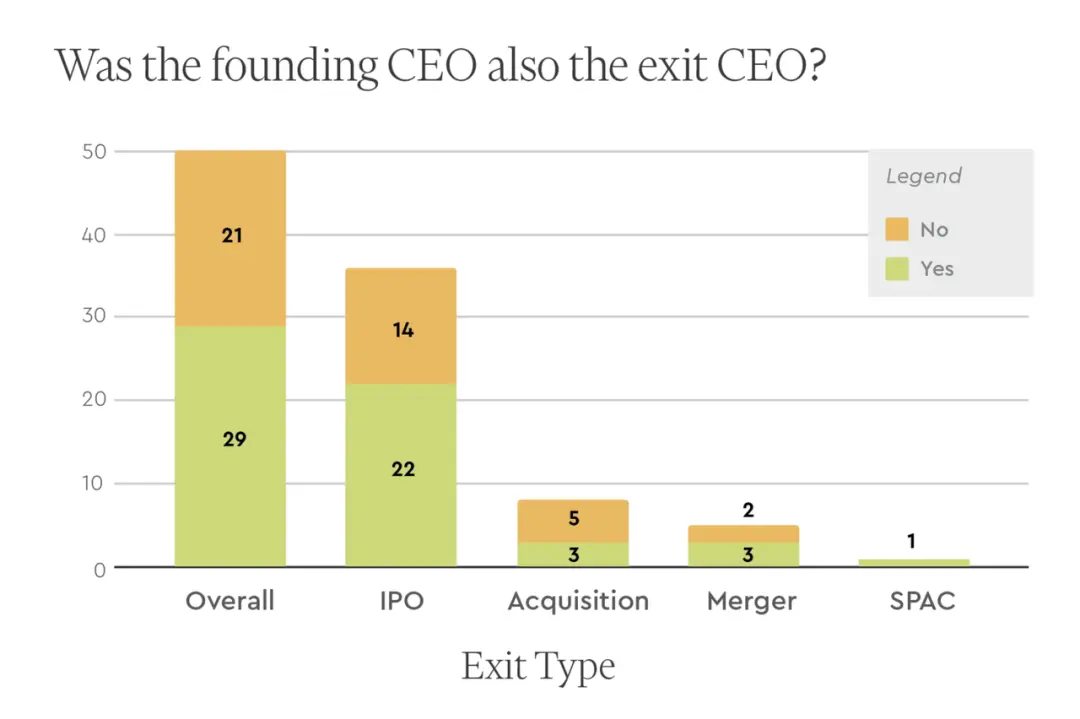
Do founding CEOs still serve as CEO at the time of investment exit?
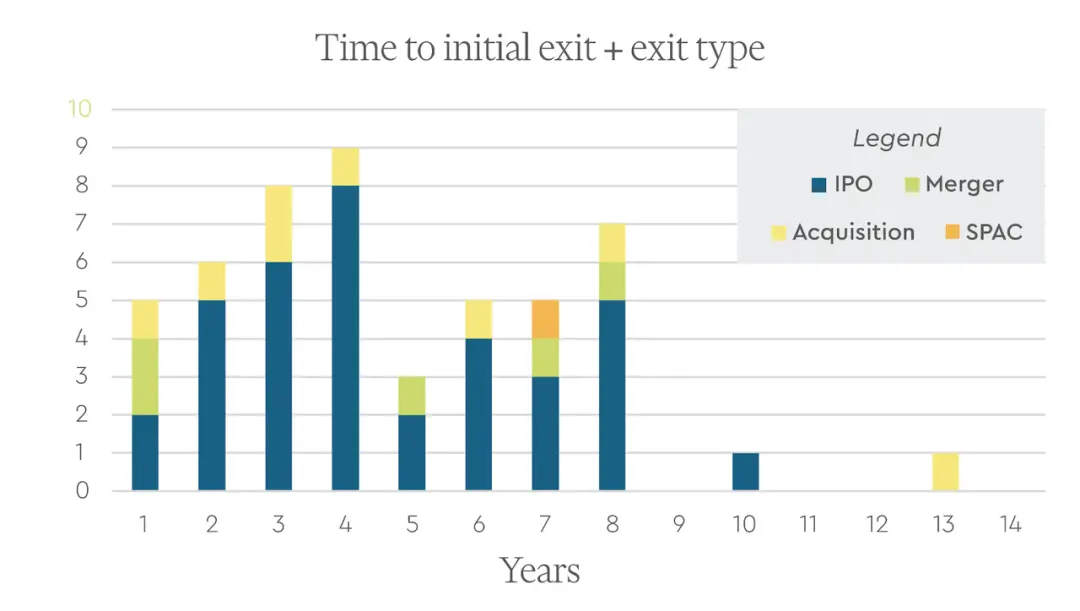
Among the 50 giant companies, 29 of the founding CEOs still served as CEO at the time of their first investment exit (IPO or acquisition). Among them, founders are more likely to continue as CEO in the case of an IPO (22 out of 36), followed by mergers and acquisitions (3 out of 5), and SPACs (1 out of 1); in the case of being acquired, the proportion of founders continuing as CEO is lower (3 out of 8).
VC Incubation
The characteristic of the biotech VC field is that VCs are actively involved in the establishment and incubation of companies. According to public information, only 44% of the Top 50 Biotech companies are VC-incubated.
Among the 21 companies incubated by VCs, the most common VCs behind them are:
• Third Rock: 5 companies
• ARCH: 4 companies
• Atlas: 3 companies
• Flagship: 3 companies
• Versant: 3 companies
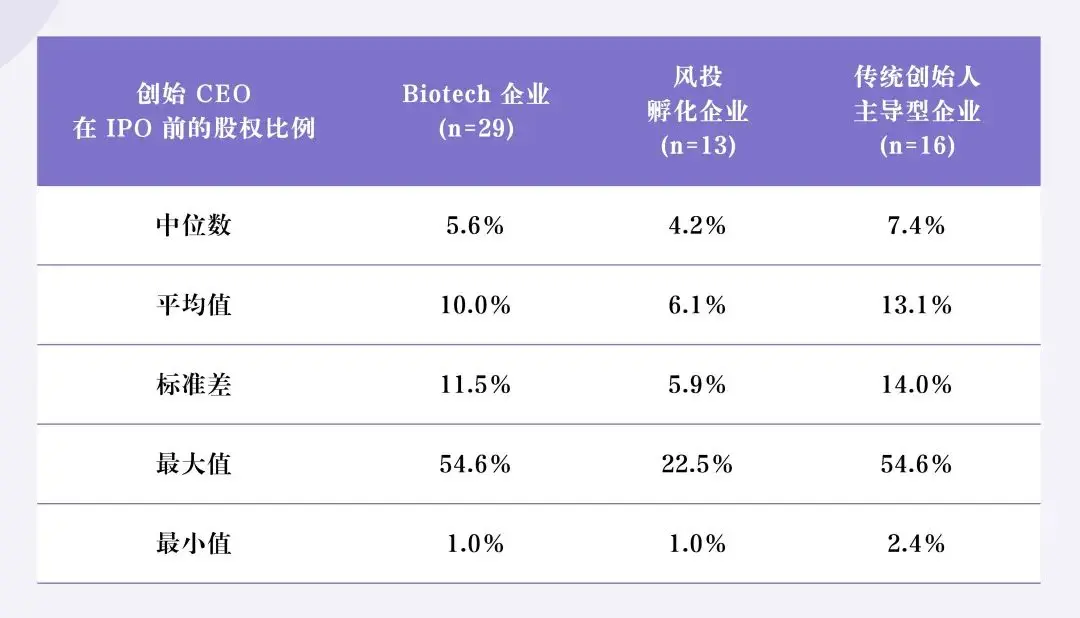
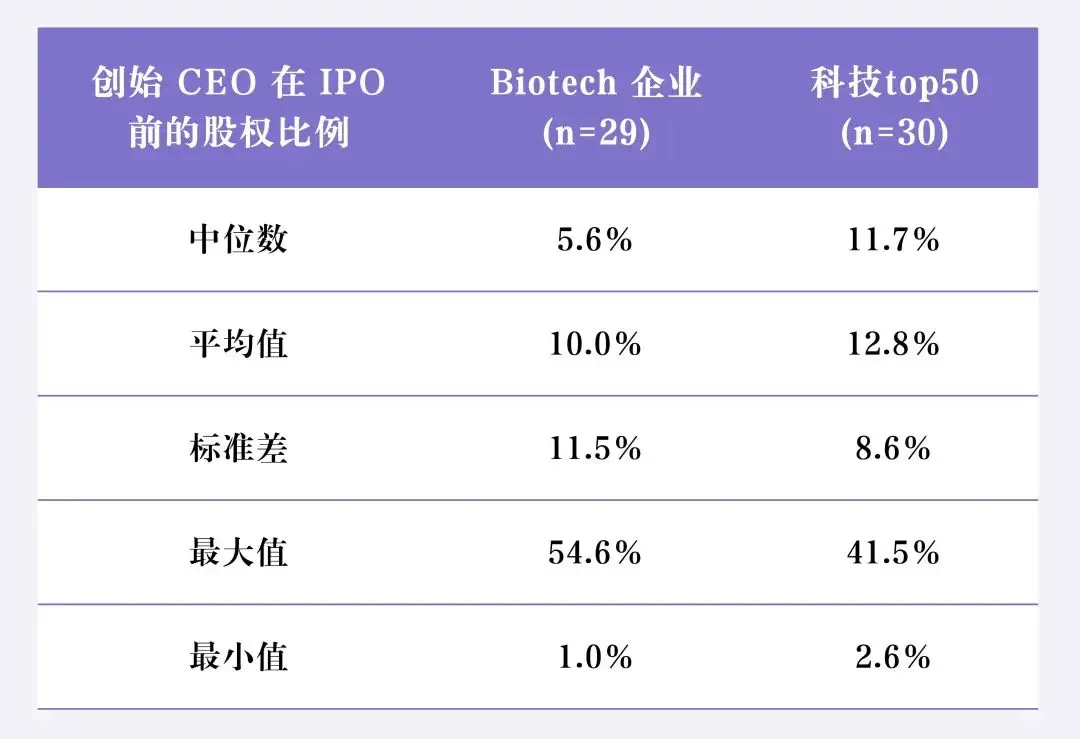
Equity stakes of founding CEOs
For the companies where the founders continued to serve as CEO after going public, we studied the equity stakes of the founding CEOs prior to the IPO. As shown in the table below, the median equity stake of founding CEOs is 5.6%. The median equity stake of founding CEOs in VC-incubated companies (4.2%) is lower than that of founder-led companies (7.4%), which aligns with our predictions.
Educational Background of Founding CEOs
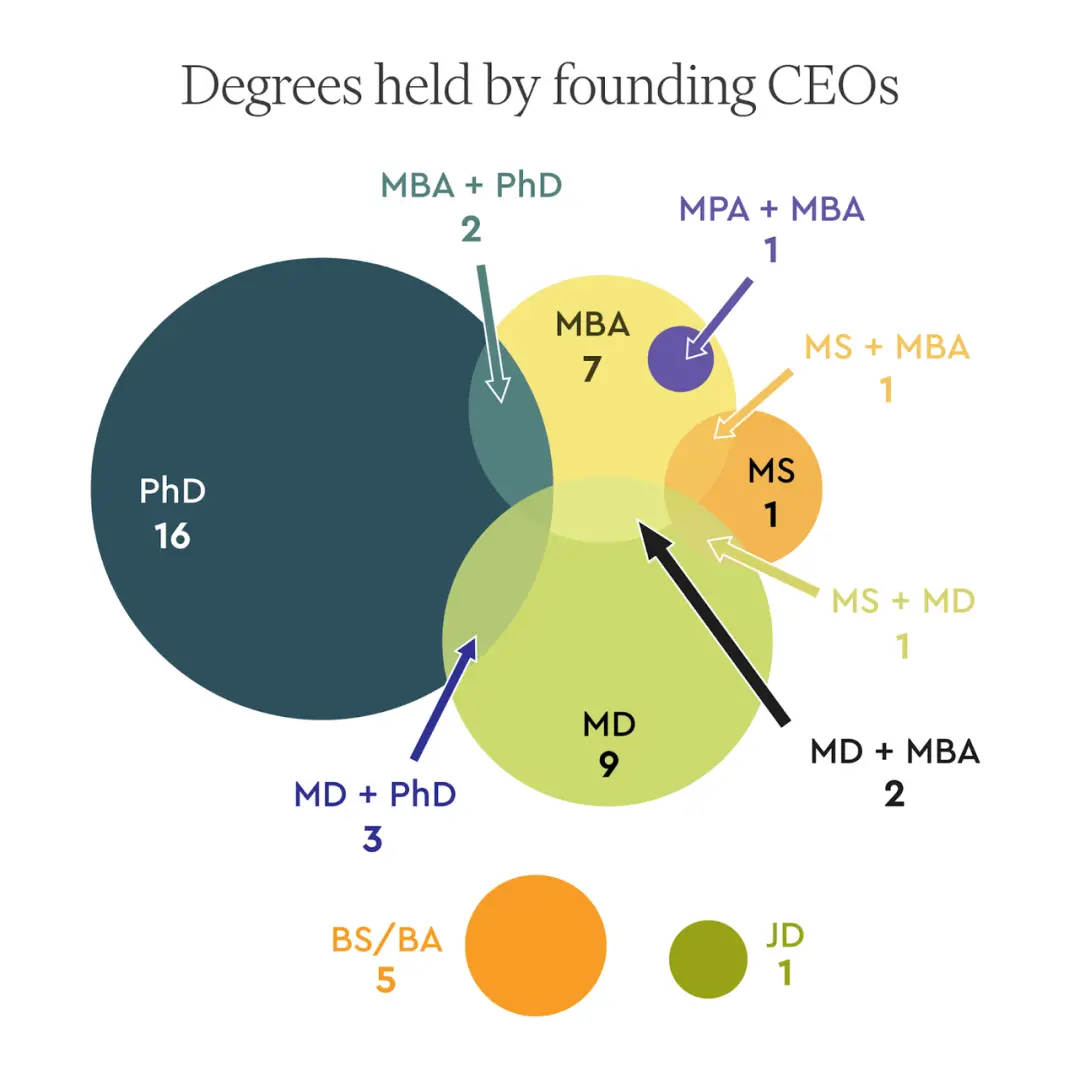
We analyzed the educational backgrounds of founding CEOs. Among the 49 founding CEOs, we found:
• The most common degree is a PhD, with a total of 21 individuals;
• The next most common is an MD, with a total of 15 individuals;
• Followed by an MBA, with a total of 13 individuals.
Most founders hold only one of these degrees, but a few have multiple degrees, such as MD/PhD (3 individuals), MD/MBA (2 individuals), and PhD/MBA (2 individuals). Almost all founding CEOs have a graduate degree (43 individuals). Additionally, most had a graduate degree before founding their Biotech companies (35 individuals).
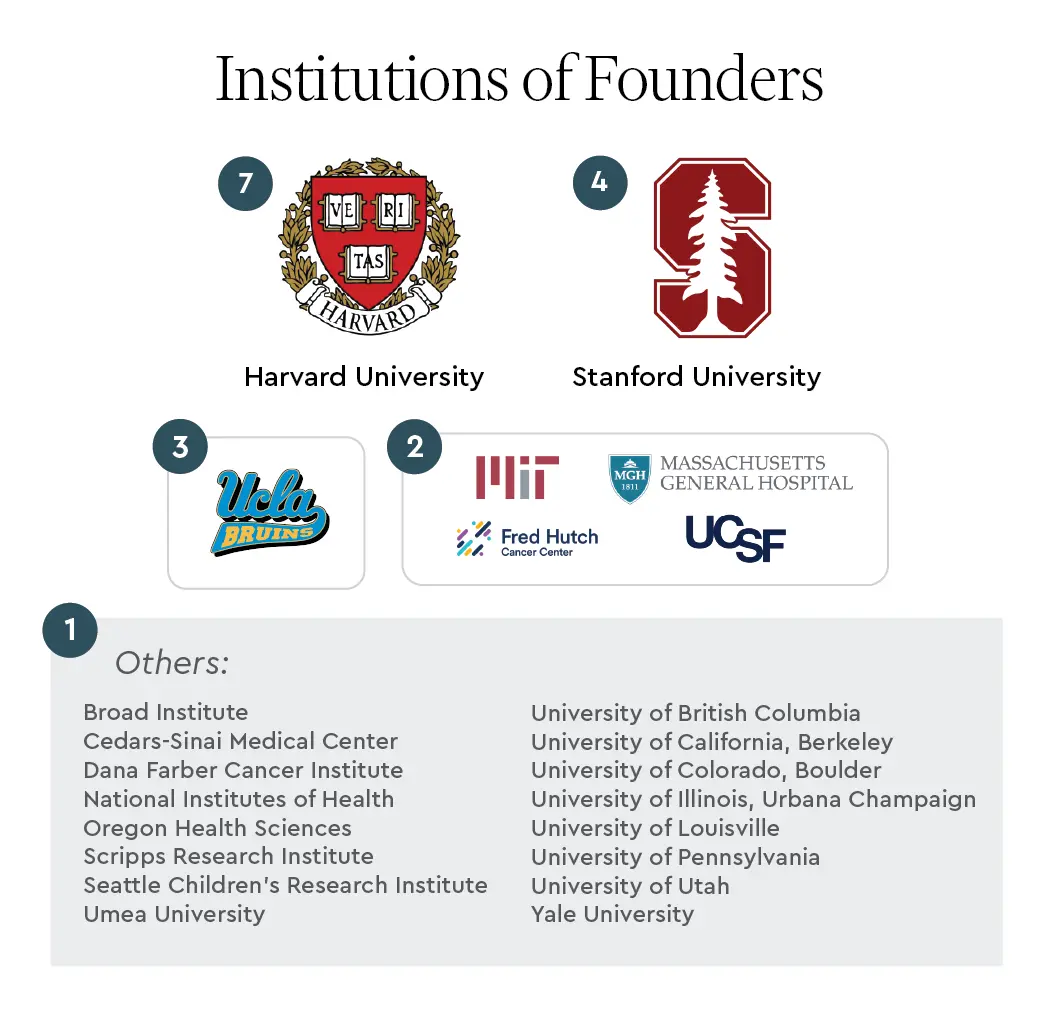
Where Do Scientific Founders Come From?
Many biotechnology companies have founders with academic backgrounds. Among the 50 companies, 30 have founders associated with at least one academic institution. The institutions with the most founders are Harvard (7), Stanford (4), and UCLA (3). Additionally, there are Mass General Hospital (2), Fred Hutchinson Cancer Center (2), UCSF (2), and MIT (2).
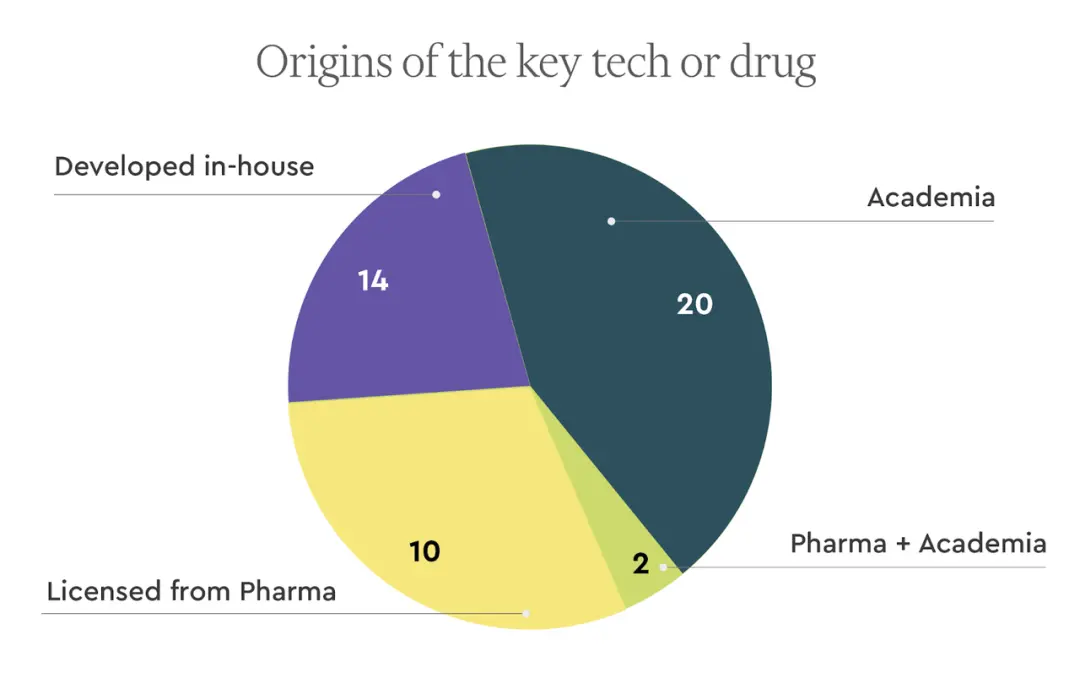
Research Institutions for Key Technologies/Drugs
Among the 46 drug development companies, 20 have core drugs sourced from academic institutions, accounting for a significant portion. Additionally, 12 startups obtained licenses from pharmaceutical companies; 2 are sourced from both pharmaceutical companies and academic institutions. 14 developed core drugs independently.
Large pharmaceutical companies (Big Pharma) license out some drug patents. There are various considerations for doing so. Here are a few common reasons:
1) Focus on core business by outsourcing R&D and sales in non-core areas;
2) Diversify risk by transferring R&D risks to startups;
3) Activate stalled projects by leveraging the flexibility of startups to drive progress;
4) Improve development efficiency by utilizing the resources of startups in specific markets.
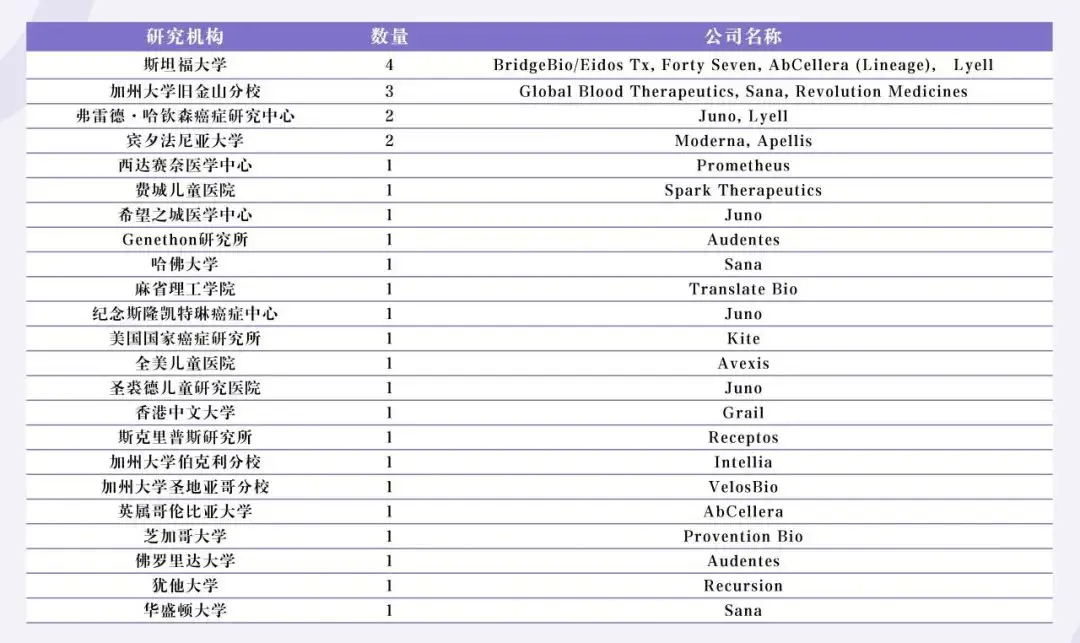
These research institutions that license core drugs or technologies are widely distributed. The top two academic institutions are Stanford (4 companies) and UCLA (3 companies) (counting BridgeBio and Eidos Tx together).
Geographical Distribution
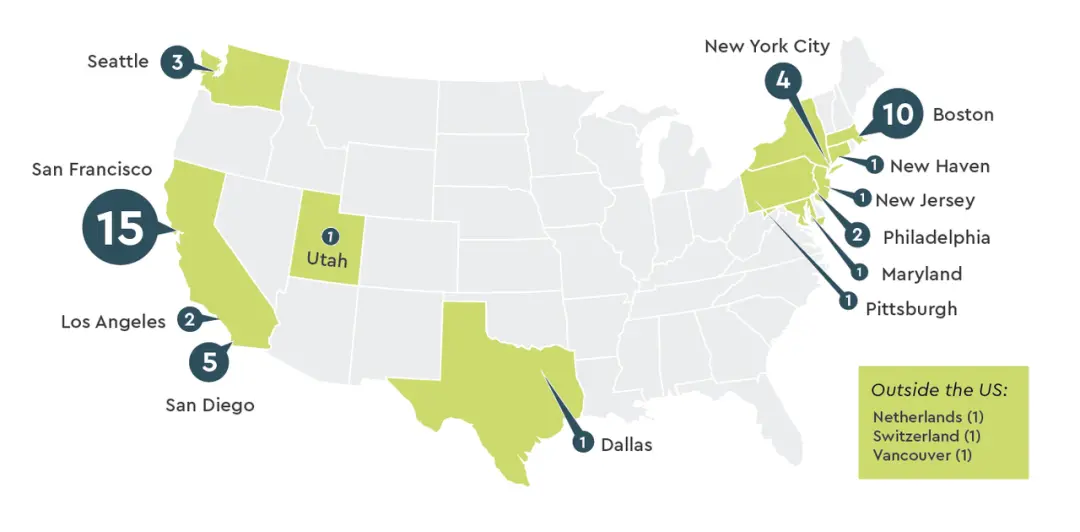
Among these 50 Biotech companies in North America and Europe, more than half were founded in the San Francisco Bay Area (15 companies) or the Greater Boston area (10 companies). Additionally, 7 companies were founded in Southern California (including San Diego and Los Angeles).
Only three companies were founded outside the United States, namely AbCellera (Canada), CRISPR Therapeutics (Switzerland), and Acerta Pharma (Netherlands). However, two of these companies still established operations in the Boston area and the San Francisco Bay Area.
03. Financial Characteristics of Companies
Valuation
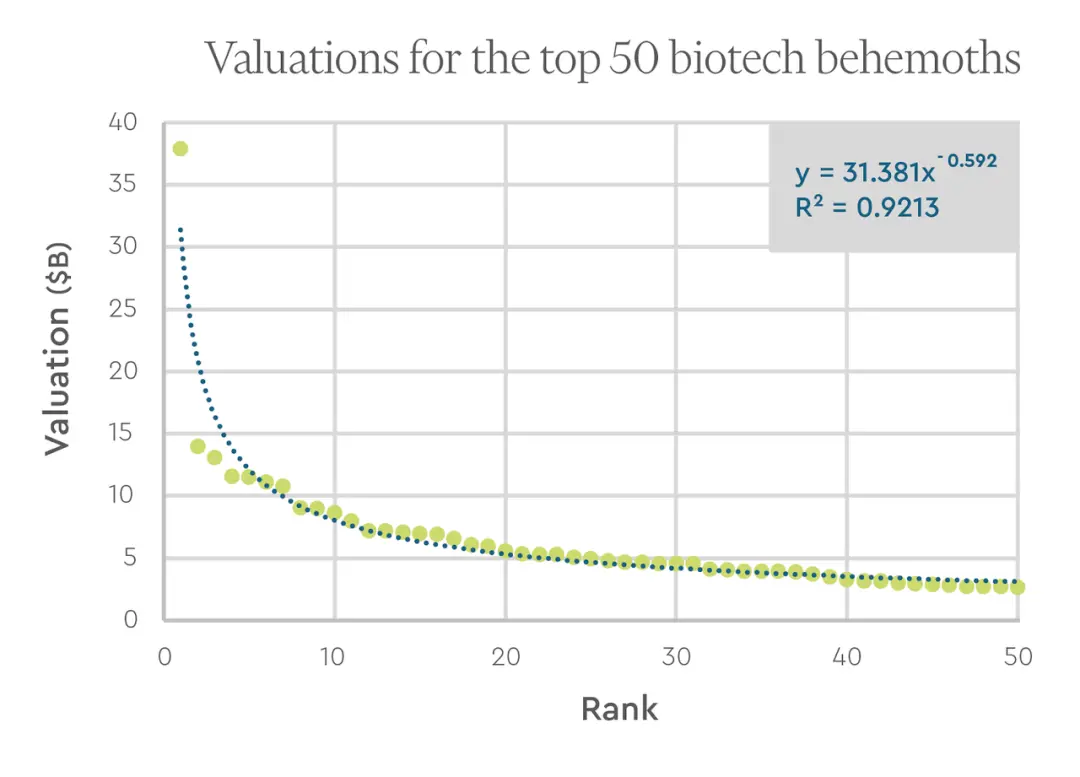
The lowest valuation among these 50 Biotech companies is approximately $2.7 billion, which corresponds to the top 0.17% of startups (about 28,000) during the same period. The 50 companies account for about 2.5% of all drug development and diagnostic/medical companies that have raised over $50 million.
In the VC industry, it is generally a small number of outliers that contribute the majority of returns to the fund. The return distribution of the Top 50 Biotech companies also roughly follows a power law distribution. As shown in the figure below, the power law equation fits the valuation trend of these Top 50 Biotech companies well. However, to more accurately estimate the overall trend, companies in the long tail need to be considered.
Multiple on Invested Capital (MOIC)
The total valuation of the top 50 biotech startups is approximately $322 billion, with total funding of about $43 billion (unadjusted amount), resulting in an overall MOIC (defined here simply as total valuation/total investment) of about 7.5.
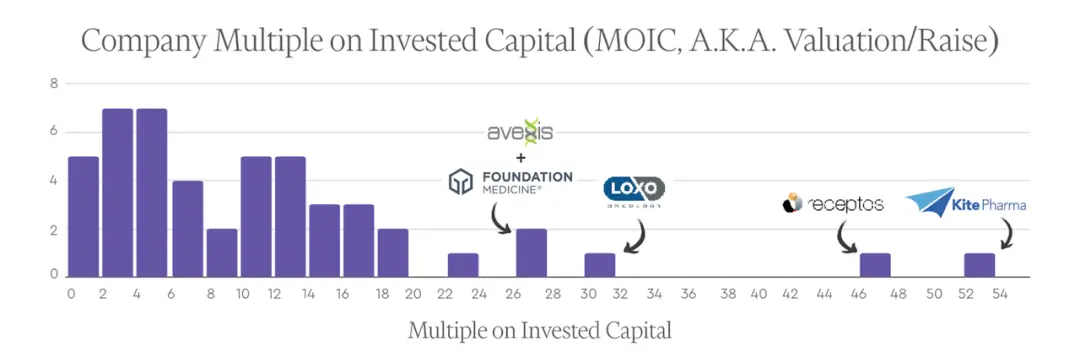
Individual Company MOIC
Among the top 50 companies, the average individual company MOIC is approximately 11.7, with a median of about 9.7. The companies with the highest MOIC include: Kite (approximately 52.5x), Receptos (approximately 46.2x), Loxo (approximately 30.8x), Avexis (approximately 27.6x), and Foundation Medicine (approximately 26.8x).
Year of Establishment and Year of Exit
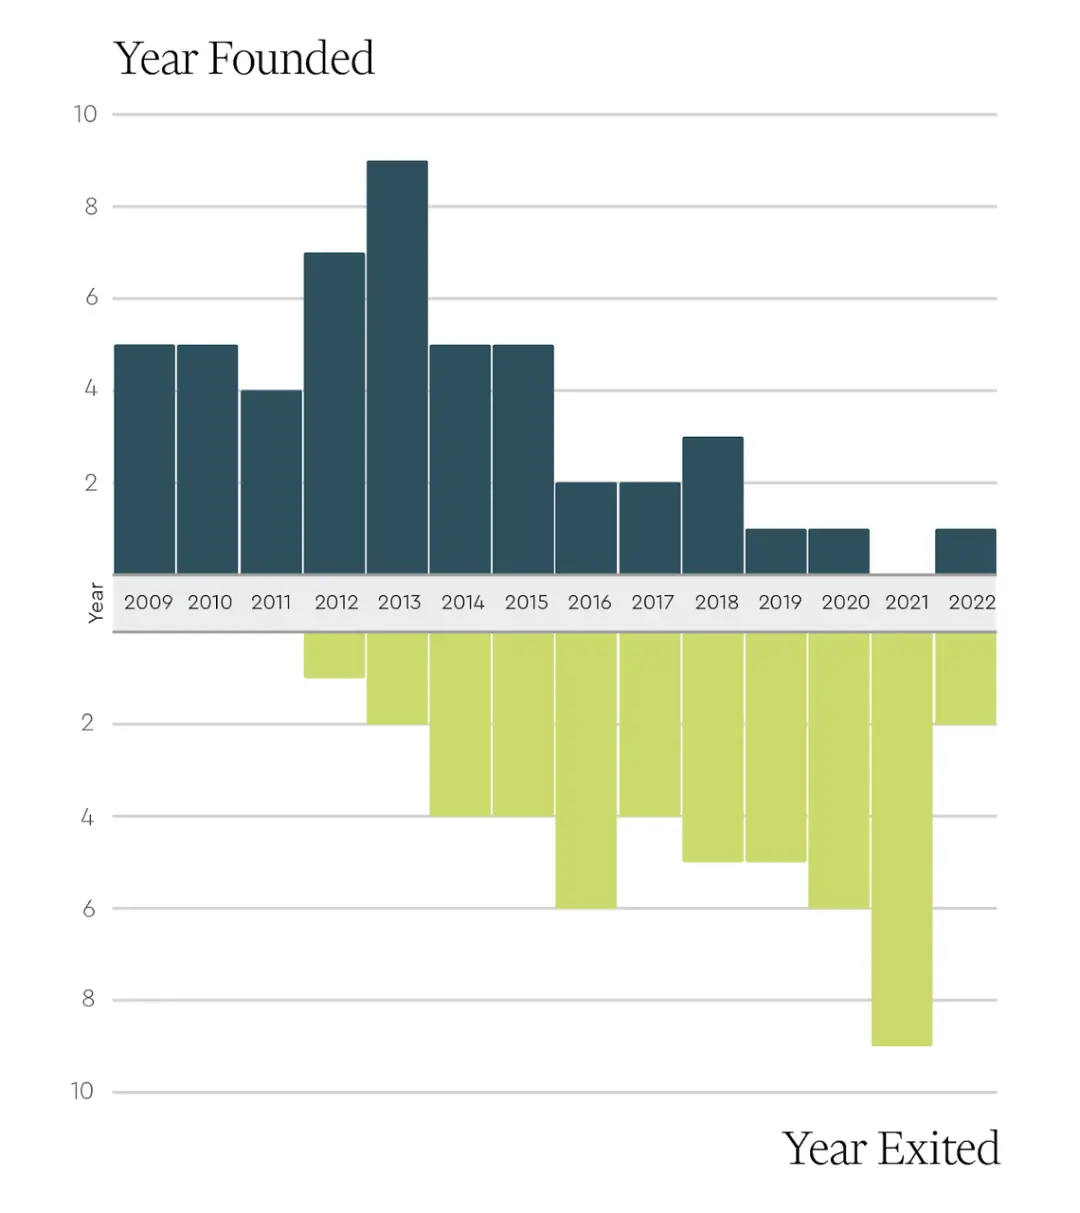
We compiled the establishment years of these 50 companies (between 2009 and 2023) and found that most companies were founded in earlier years. This was expected, as Biotech companies typically require a longer time to accumulate value. Among them, the year with the most companies founded is 2013, with a total of 9 (Biohaven, Juno, Loxo, Vaxcyte, CRISPR, Spark, Turning Point, Eidos, and Recursion).
Similarly, the years of first exits (i.e., IPO or acquisition) for these companies during the 15-year statistical period also tend to be later years, particularly concentrated in years when the biotechnology capital market performed well. The year with the most companies exiting the investment market for the first time was 2021, followed by 2020 and 2016.
Time Required for Initial Exit
We analyzed the time required for these companies to achieve their first exit, with an average duration of 4.7 years (standard deviation of 2.7 years). Notably, 5 companies achieved their first exit in the second year after establishment (Juno, Telavant, Loxo, Immunovant, and Chinook).
04. How Do the Top 50 in the Tech Industry Differ from the Top 50 in the Biotech Industry?
To better understand the relevant data of these top Biotech startups, we conducted a similar analysis of the top 50 tech companies founded during the same period.
The average valuation of the Top 50 tech companies is higher than that of the Top 50 Biotech companies, as the former has a higher ceiling. The most valuable tech company is Uber ($156 billion), nearly four times the valuation of the highest biotech company, Moderna ($38 billion), and close to half of the total valuation of the Top 50 Biotech companies. The lowest valuation among the Top 50 tech companies is $3.2 billion (top 0.2% of tech startups during the same period), while the lowest valuation among the Top 50 Biotech companies is $2.7 billion (slightly below 0.2% among biotech startups during the same period).
The average MOIC for the Top 50 tech companies is 23.2, with a median of 9.4, primarily driven up by WhatsApp (approximately 317x), TradeDesk (approximately 197x), and Honey (approximately 56x). The average MOIC for the Top 50 Biotech companies is lower (11.7), but close to the median (9.7).
Overall, while there are many differences between the two industries, the overall MOIC of the top startups is surprisingly similar (approximately 7.4x for the tech industry and approximately 7.5x for the biotech industry).
One major difference between the two industries is the time required to achieve the first exit. The average time for the Top 50 tech companies to achieve their first exit is 8.2±2.1 years, significantly longer than the Biotech Top 50 (approximately 4.7±2.7 years).
Additionally, mergers and acquisitions play a more significant role in the exit process for these Biotech companies. Among the Biotech Top 50, 24% achieved their first exit through acquisition, with the final acquisition rate reaching 52%; in contrast, the final acquisition rate for tech companies is only 18%.
We also compared the ages of founding CEOs in the two industries. The average age of founders in the Tech Top 50 at the time of company establishment is approximately 36 ± 8 years, while the average age of founding CEOs in the Biotech Top 50 is about 46 ± 10 years, which is significantly higher.
Finally, for companies that successfully went public and where the founders still serve as CEO at the time of the IPO, we compared their equity stakes prior to the IPO. The equity stakes of founding CEOs in the Tech Top 50 are significantly higher than those in the Biotech Top 50, with the median in the tech industry being 11.7%, nearly double that of the biotech industry (5.6%).
05. The Past, Present, and Future Outlook
We found that among the top 50 biotech startups (including drug development, diagnostics, and medical device companies), drug development companies dominate. While diagnostic and medical device companies undoubtedly create significant value for patients and the entire industry, their business models (which typically have lower pricing power and profit margins) often fall short in terms of capturing and maintaining value compared to drug development companies.
Value Success Path of the Top 50 Biotech
There is no single path to success.
Many companies in the Top 50 focus on targeted therapies in oncology or rare diseases, but there are also two companies that focus on relatively common indications such as COVID-19 and migraines.
Some companies have developed their own products and technologies internally, but most choose to obtain licenses from academia or other pharmaceutical companies. Some are incubated by venture capital, while many are founder-led. Some companies have impressive technology platforms, but more are driven by specific assets.
Some founders are experienced, but many companies are led by novice CEOs. Some companies have scientific founders from Stanford or Harvard, but the vast majority do not have such academic backgrounds.
Most biotech companies are located in key biotechnology hubs where capital, innovation, and management talent are concentrated (such as the Bay Area and Greater Boston). Nevertheless, their geographical distribution within the United States remains relatively broad. Notably, only three companies were founded outside the United States.
What Are the Differences Between the Tech Industry and Biotech Industry Top 50?
The differences between the two types of companies are evident, particularly in terms of capital intensity, technological risk, regulatory scrutiny, the prevalence of binary outcomes, and market size. In fact, even the most successful biotech companies cannot compare their valuations and investment return multiples with some tech companies. However, when looking at the overall category's MOIC (total valuation and/or total investment), the performance of the Biotech Top 50 surprisingly resembles that of the Tech Top 50.
The Biotech Top 50 has a shorter average return cycle compared to the Tech Top 50, primarily due to two reasons:
1) Mergers and acquisitions play a larger role in the biopharmaceutical sector (as drugs continuously lose patent protection).
2) IPOs provide strong support for expensive and high-risk late-stage clinical development.
These findings should be good news for potential founders in the biotech sector.
What Is Attractive About the Biotech Industry?
Many people enter the biotech industry hoping to improve standards of care through the development of innovative drugs and diagnostic tools; or to enhance existing diagnostic methods, extending patients' lives through early disease detection or the selection of appropriate therapies; or to develop a technology that reveals unknown biological principles, improving treatment outcomes.
By this measure, the Biotech Top 50 over the past 15 years is undoubtedly a benchmark for the industry, with achievements including:
• Rapidly launching the first mRNA vaccine for global pandemics;
• Developing a treatment for schizophrenia targeting specific pathways in the brain, effectively avoiding side effects in other areas;
• Developing the first gene therapy for patients with hereditary blindness;
• Developing the first cell therapy for certain refractory blood cancer patients;
• Optimizing genetic testing for cancer patient care;
• Developing technology to measure variations in single-cell genomes and transcriptomes.
What Is the Outlook for the Next Generation of Biotech Unicorns?
What will the next generation of biotech unicorns look like? Here are our projections.
• Drug development companies will continue to dominate: Although these companies face pressure from the Inflation Reduction Act (which aims to limit price increases for certain drugs) and other pricing factors, they still have advantages in their business models, and related technologies are continuously advancing. We hope, and data already shows, that we have actually reached the point of the "anti-Moore's Law." (Note: Anti-Moore's Law refers to the phenomenon where the efficiency of pharmaceutical R&D declines over time).
• Certain areas will experience breakthrough growth: Currently, drugs such as GLP-1 agonists (for diabetes and obesity) and anti-amyloid antibodies (for Alzheimer's disease) have made significant progress, and pharmaceutical companies are likely to achieve more similar breakthroughs. Therefore, we believe that in the future, multiple companies will emerge with breakthrough advancements in metabolic diseases, neurology, and immunology, with market valuations potentially reaching $5 billion to $15 billion.
• The emergence of innovative platforms: Since the inception of the biotech industry, from the advent of recombinant DNA technology to the rise of companies like Genentech and Amgen, we have consistently seen the establishment of well-funded biotech unicorns based on innovative platforms. This trend will continue, especially in the following areas: new target discovery platforms, entirely new drug design methods, and the development of improved or novel therapeutic approaches. For example, if a company can truly solve the intravenous delivery problem for large-molecule nucleic acid drugs that are organ-specific and extrahepatic, and possesses the right business model and execution capabilities, that company could be worth billions of dollars. This is because there are currently many highly valuable therapeutic molecules waiting to be delivered, and these technologies can also be used to treat many yet-to-be-conquered diseases.
• Biopharmaceutical software companies are emerging: Several software companies focused on biopharmaceuticals are expected to emerge, with valuations potentially reaching $3 billion to $5 billion. Currently, the pharmaceutical industry spends over $200 billion annually on global R&D, but invests very little in software, and the drawbacks are becoming apparent—many biopharmaceutical R&D teams currently use outdated, cumbersome, or fragmented software systems. Additionally, artificial intelligence is expected to have a profound impact on multiple stages of the drug development value chain (not limited to target discovery or drug discovery). Therefore, pharmaceutical companies will ultimately need to significantly increase their software investments, or they may lose their competitive edge.
• The central positions of the Bay Area and Boston remain unchanged: Over time, the network effects of the Bay Area and Boston will continue to strengthen, maintaining their central positions in the biotech field.
• The average age of founding CEOs will continue to be higher: Compared to tech unicorns, the average age of founding CEOs in biotech unicorns will remain higher. We believe this difference partly reflects the complexity and stringent regulation of the biotech industry, necessitating founders to have rich educational backgrounds and experience. Another important reason is that achieving significant value inflection points often requires substantial financial support from investors. However, these investors need to manage various risks present in the companies, so they are often reluctant to take on additional risks associated with insufficient team capabilities.
• Diversity among founding CEOs is increasing: Currently, there is an active push within the industry to promote diversity and inclusion in company boards and executive teams. As a result, we believe that the racial and gender diversity of founders in this field will become more pronounced.
免责声明:本文章仅代表作者个人观点,不代表本平台的立场和观点。本文章仅供信息分享,不构成对任何人的任何投资建议。用户与作者之间的任何争议,与本平台无关。如网页中刊载的文章或图片涉及侵权,请提供相关的权利证明和身份证明发送邮件到support@aicoin.com,本平台相关工作人员将会进行核查。


