Title: "Airdrops: An Analysis of Over 2,000,000 Events"
Author: 6THMAN Research
Translator: Frost, BlockBeats
Airdrops, as part of Token Generation Events (TGEs), have become very common, but research on them is relatively scarce. The mechanism is simple - distributing newly minted tokens to suitable wallets to help establish initial circulation, enable on-chain governance, drive transactions, reward early contributors, and potentially attract new users.
We believe that such a prevalent token design element should be quantitatively studied to determine best practices. We collected data on over 2 million airdrop events covering 40 protocols and analyzed the two most important choices token designers face:
- How much token supply should be airdropped?
- Who should be eligible to participate in my airdrop?
We used various methods to answer these questions, including price performance, volatility, and wallet activity. Our analysis and dataset will be made public (to be released soon), and we encourage contributors to help expand the dataset and analysis.
Dataset
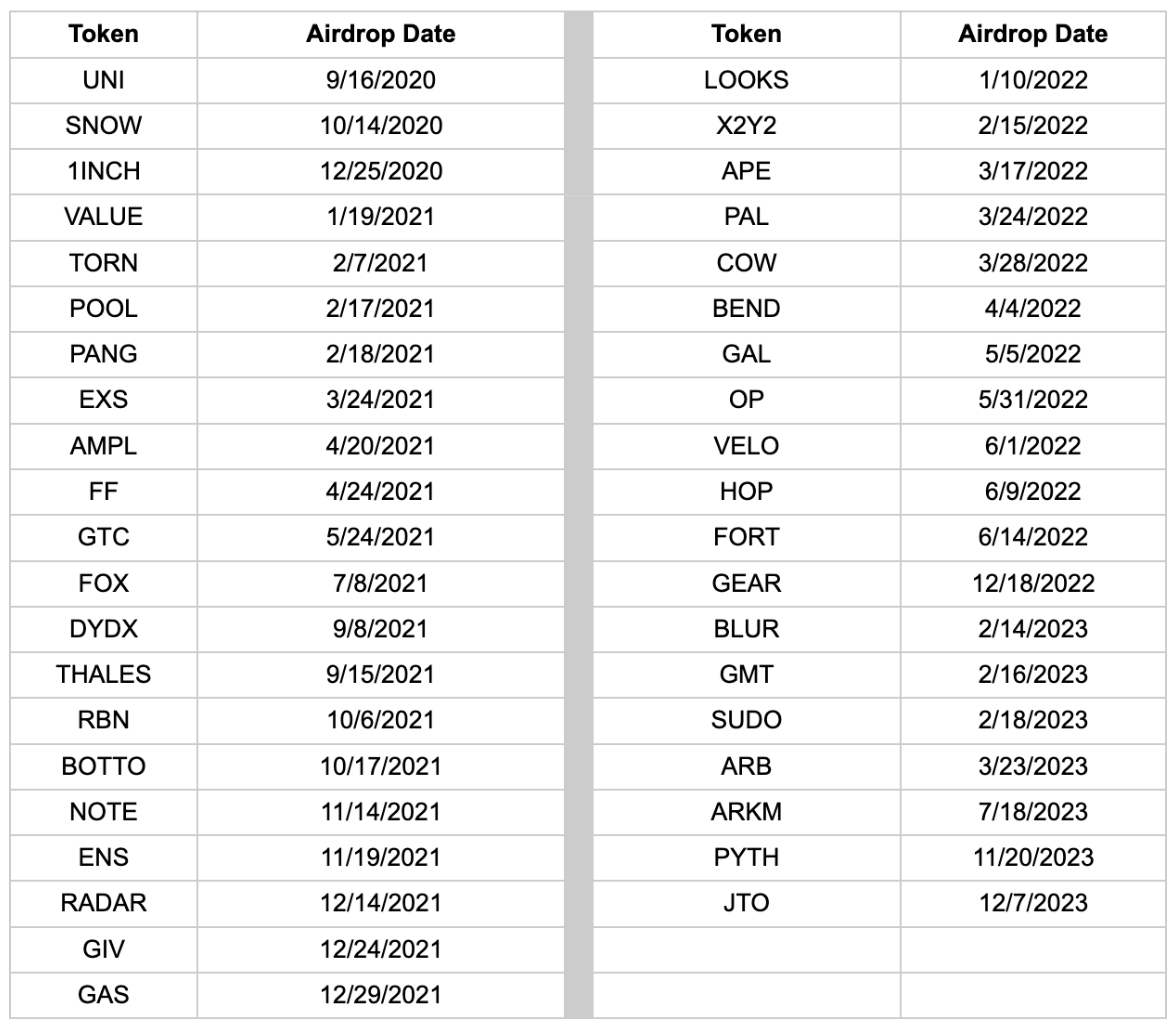
Our final dataset includes 40 airdrop events from 40 protocols and the activity of 2,098,698 unique wallets. It is important to note that we only used airdrops from 2023 and earlier.
The analysis covered events for the following 40 tokens:
For each protocol among these 40, our analysis focused on the previously mentioned metrics: eligibility type and airdrop size.
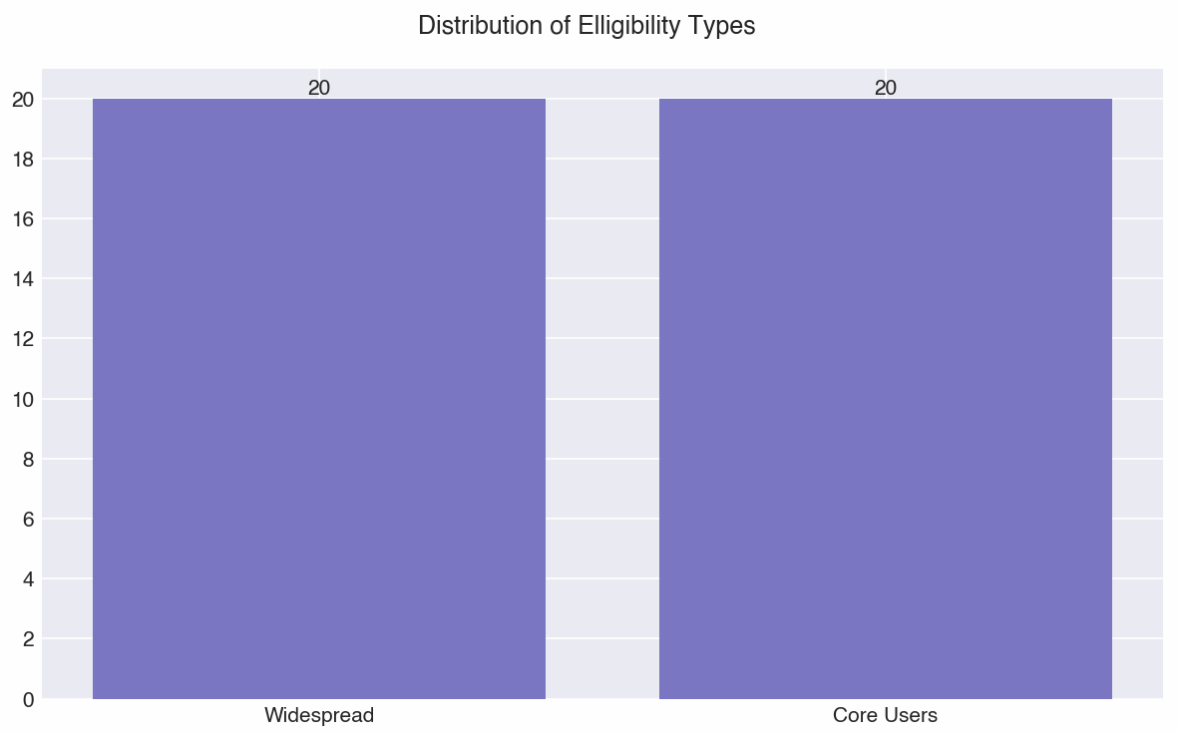
Eligibility Type
"Eligibility type" is divided into "broad users" and "core users." In the former, the protocol airdrops tokens to general ecosystem users, for example, the new DePIN protocol airdrops tokens to wallets that participated in other DePIN protocols within a specific time frame, or to specific on-chain communities (such as NFT). In the latter case, the protocol only rewards users who directly participated in the protocol before. Fundamentally, these methods differentiate between two choices: should airdrops primarily serve as marketing and growth tools, or should they focus on rewarding the most active users during the protocol's launch?
Airdrop Size
Another key element is "airdrop size," which is the percentage of total supply allocated for the airdrop. The motivation here is simple: is there a "best" airdrop size range? The allocation sizes in our dataset are as follows:
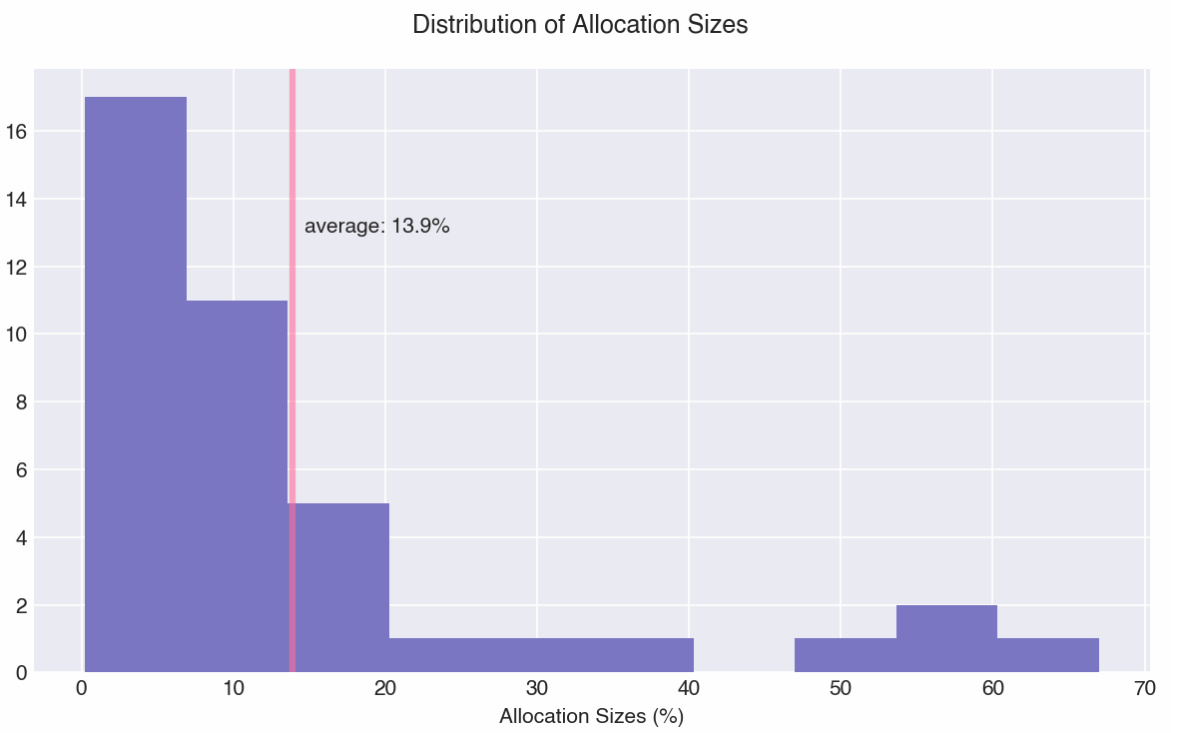
The median allocation size is approximately 10%, resulting in a relatively even distribution of 19 small airdrops and 21 large airdrops.
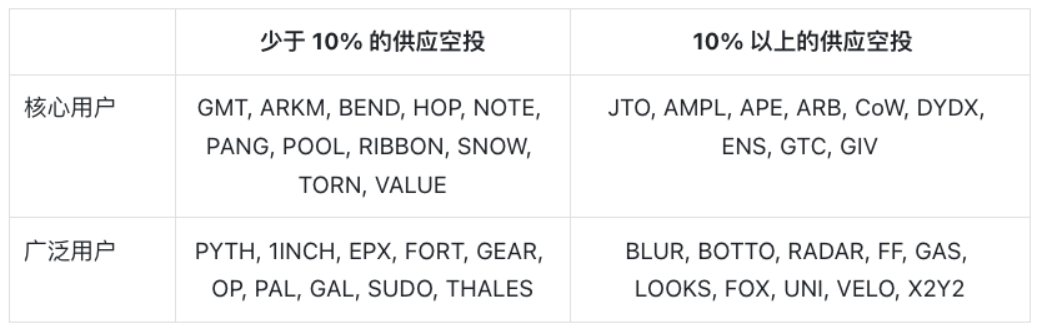
Categorization
The goal of categorizing events is to compare overall design choices. To achieve this, we organized events into four different combinations:
Analysis and Insights
First and foremost, it should be noted that our analysis aims to balance rigor and insight - it is difficult to prove causality using only price data or wallet data, especially in a multi-factor environment such as the token market. We can observe that certain design combinations perform better than others, but we do not claim to be able to rigorously prove that these design combinations perform better as a result of these design choices. We believe that a combination of factors, especially airdrops, may lead to differences in average price performance across categories.
Price and Volatility Effects
An important indicator of measuring airdrop effectiveness is price impact. We aimed to measure the price effect within the time window that airdrops may influence. Due to most airdrops occurring at TGE, there are some confounding factors when analyzing price data. We collected price data for the two months following the airdrop, standardized by the crypto index, and calculated the percentage change in price. It is important to note that our initial price is based on 24 hours after the airdrop, allowing for some initial price discovery (i.e., immediate sellers).
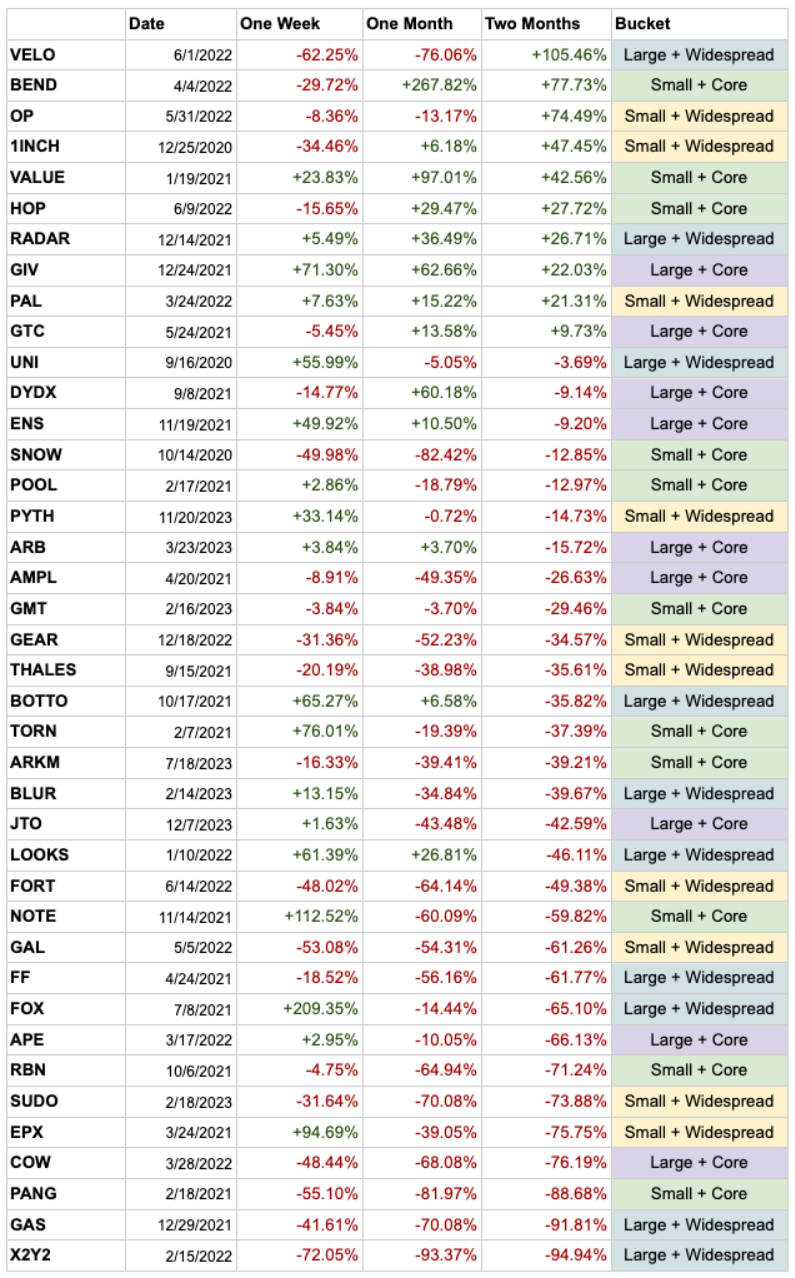
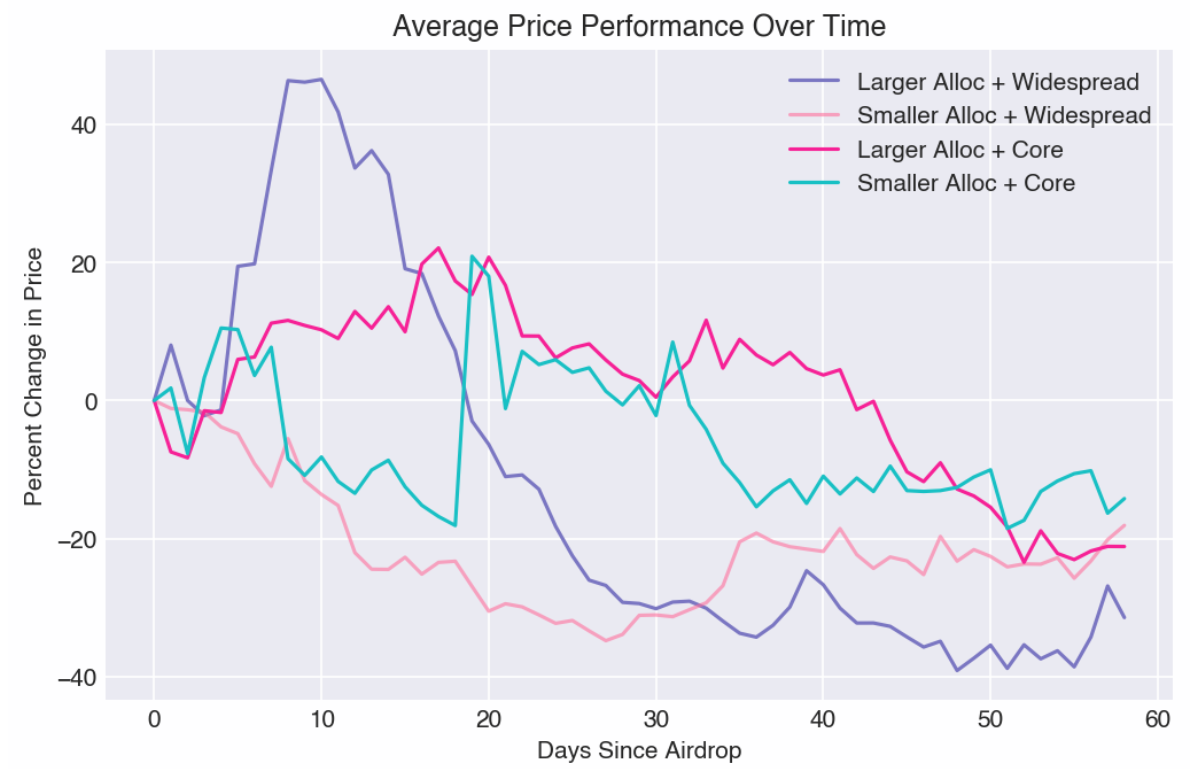
Price change after airdrop
Out of the 40 airdrops, only 10 experienced price increases two months after the airdrop. Although we observe a wide range of performance, when we measure the four categories (as shown in the following chart), they tend to decrease by 10-40% after 60 days. This is consistent with the significant cliff-like distribution we observed in token unlocking articles. Large expected token distribution events (exceeding 1% of the token supply) typically generate selling pressure and stabilize at lower levels after some time. This effect is most likely amplified in the accumulation of airdrop events.
We can draw some interesting insights:
- The large + broad user group performed the worst in terms of price performance and volatility.
- Overall, the core user group outperformed the broad user group in terms of price performance and volatility.
- Airdrop size does not have a decisive impact on price performance or volatility.

Additionally, four protocols airdropped most of their supply. They are identified as DYDX (50%), GAS (55%), VELO (60%), and AMPL (67%). We expected to observe a correlation between airdrop size and price, but it was not observed, either in this group or across all tokens (not shown). However, the lack of correlation suggests that teams can airdrop most of their tokens and still experience positive price changes two months later (VELO +105%).
Wallet Behavior
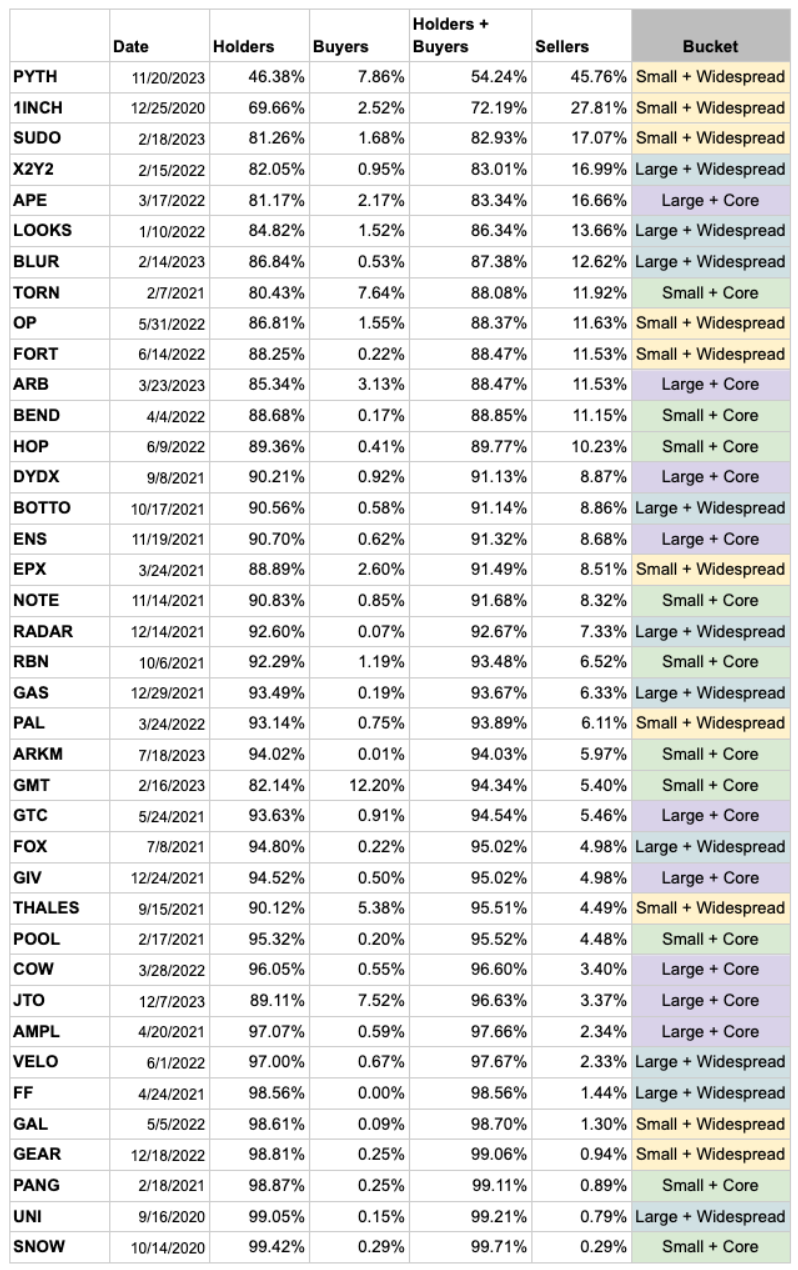
Another valuable insight into measuring airdrop success is understanding how users handle the received tokens. For each protocol, we analyzed the wallets of recipients within 60 days after the airdrop. It is important to note that, for the sake of complexity, we did not consider cases where users transferred tokens to other wallets or exchanged them outside of DEX (e.g., sent to centralized exchanges). Tracking deposits to centralized exchanges on a scale became impractical, so we propose using DEX data as a useful proxy for comparative analysis, likely serving as a lower bound for sellers.
Generally, we categorized users into three types: sellers, holders, and buyers. To make this classification, we calculated the net change over 60 days - users with no change were classified as holders, those with increased holdings as buyers, and those with decreased holdings as sellers.
Wallet behavior within 60 days after airdrop
We can draw two insights:
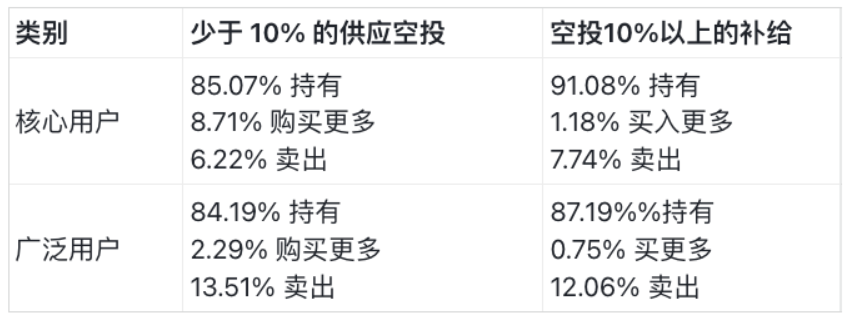
- Broad airdrops lead to a doubling of the number of sellers. On average, recipients of broad airdrops are more likely to sell their tokens than core users. This is intuitive. If users receive tokens for something they have not previously used, or even just heard of, they are more likely to exchange it for assets they care about. More compellingly, among the top 10 protocols with the highest proportion of sellers, 8 conducted "broad" distributions.
- Small airdrops to core users result in a 4-8 times increase in the number of buyers. Data shows that when the airdrop size is small (10%) and targeted at core users, the proportion of buyers is highest. This is also intuitive, as they are the most active users and most likely to purchase tokens for governance participation or liquidity voting.
Recommendations
Our analysis revealed four main insights:
- Airdrops to core users exhibit higher price performance in the two months following the airdrop.
- Airdrop size does not have a significant impact on price performance or volatility, suggesting that "low circulation" may not have as much of an impact on price volatility as other factors.
- The number of sellers in the broad airdrop group is twice that of the core group.
- Small airdrops + core user group saw a 4-8 times increase in the number of buyers (increased holdings).
We derive some general biases in airdrop design from the data, but it must be noted that the specific context and goals of the protocol must always be taken into consideration.
Recommendation #1: Lean towards airdrops to core users rather than broad audiences
Considering the opportunity cost of airdropping to users more likely to sell, our first overarching view is that airdrops should primarily target core users who help guide liquidity and/or drive usage, rather than a broader audience. Our intuition suggests that rewarding core users will lead to higher holder retention, which is validated in the data. The likelihood of converting non-users into users through airdrops is low, and it is often better to focus attention and funds on incentivizing the core community. Airdropping to core users may also promote buying momentum and relatively higher prices.
Recommendation #2: Lean towards smaller airdrops
Given that airdrop size does not have a significant impact on price and volatility, we lean towards maintaining smaller airdrops rather than larger ones. Airdrops help guide usage and liquidity, especially if the team plans to continue iterating their product (rather than planning to solidify it), keeping more reserves to reward future users and liquidity is beneficial. It should be noted that airdrops should still be large enough to meaningfully reward early venture capital and serve as a community incentive moment.
In certain cases, a lean towards larger airdrops may be preferable. For example, larger airdrops can prevent voting centralization and make it more difficult for malicious actors to influence the network. However, allowing teams and investors to vote on their locked tokens may reduce this risk factor.
Observation: "Low circulation" may not be the primary driver of price volatility
Finally, as an observation rather than a recommendation, the data does not support the theory that "low circulation" is the primary driver of significant price volatility. Logically, low circulation limits supply and should drive prices up. However, we did not observe a significant relationship between large and small airdrop groups, with all groups showing lower prices 60 days after issuance. Furthermore, the analysis of relative volatility did not reveal significant differences in airdrop size, although we expected low circulation to lead to higher volatility. In fact, the volatility of the large + broad user group was by far the highest!
If we had unlimited resources and knowledge, we would expand our research to include evaluating protocol TVL before/after TGE to assess whether airdrop size affects TVL stickiness, and analyzing the ratio of TGE price to the last significant investment round.
Appendix
Crypto Index Correction
To balance the analysis for different macro conditions, we used beta normalization to eliminate macro price changes in token price changes. This was done using a multiple regression with BTC and ETH, where we removed the beta coefficients of each asset relative to the macro, and reconstructed prices after adjustment.
免责声明:本文章仅代表作者个人观点,不代表本平台的立场和观点。本文章仅供信息分享,不构成对任何人的任何投资建议。用户与作者之间的任何争议,与本平台无关。如网页中刊载的文章或图片涉及侵权,请提供相关的权利证明和身份证明发送邮件到support@aicoin.com,本平台相关工作人员将会进行核查。


