Market expectations for BTC spot ETF will attract new funds of several billion dollars in scale.
Authored by: Mike
A. Market View
I. Macro Liquidity
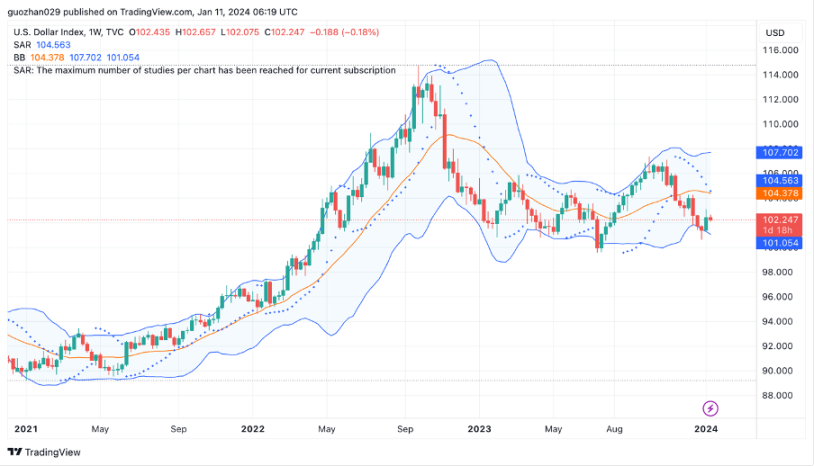
Improvement in currency liquidity. The market is waiting for the release of heavyweight US inflation data and new clues about when the Fed may start cutting interest rates. The US stock market hit a 2-year high, and the yield on the 10-year US Treasury bond rose slightly. This week, the US SEC approved BTC spot ETF for the first time, authorizing 11 ETFs to be listed and traded. The US SEC has refused to allow such products to be launched for the past 10 years. The market expects that the BTC spot ETF will attract new funds of several billion dollars in scale.
II. Overall Market Trends
Top 100 Market Cap Gainers:
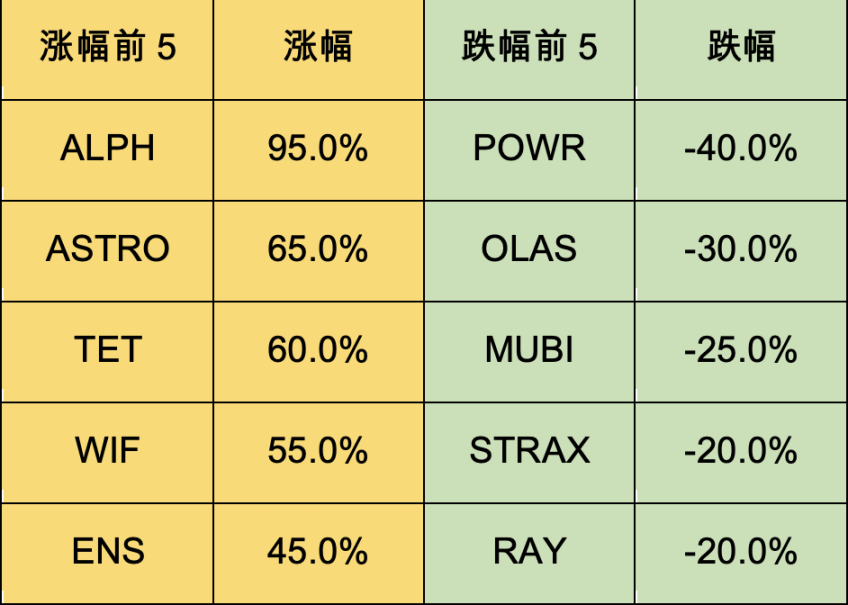
BTC fluctuated at a high level this week, and the SEC approved the BTC spot ETF as scheduled. The BTC dominance rate peaked on a weekly basis. The market narrative shifted from BTC to ETH, and the ETH/BTC exchange rate made a significant reversal after breaking through the 3AC liquidation low point, indicating that ETH may lead the altcoin season in the future.
- ETH: The public chain ETH is expected to undergo the Cancun upgrade in mid-March and the spot ETF is expected to be approved by the end of May. Small-cap L2 projects in the ETH ecosystem and liquidity staking projects are expected to benefit from the Cancun upgrade.
- ENS: It is the leading domain name on the ETH chain. Vitalik Buterin believes that it will have a significant future role and aims to expand to all L2, forming a unified standard for L2. The last project he was so bullish on was SOL.
- ASTRO: The team comes from the original Luna ecosystem and is currently the main dex on INJ, SEI, and NTRN chains, the preferred choice for Cosmos, with a market value only 1/5 of Osmo's and not listed on any exchanges. Top dex and top meme on the public chain often outperform their respective public chains.
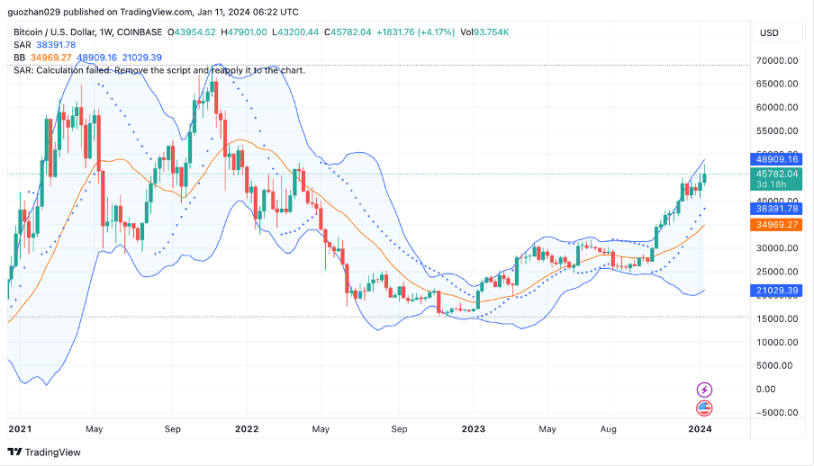
III. BTC Market Trends
1) On-chain Data
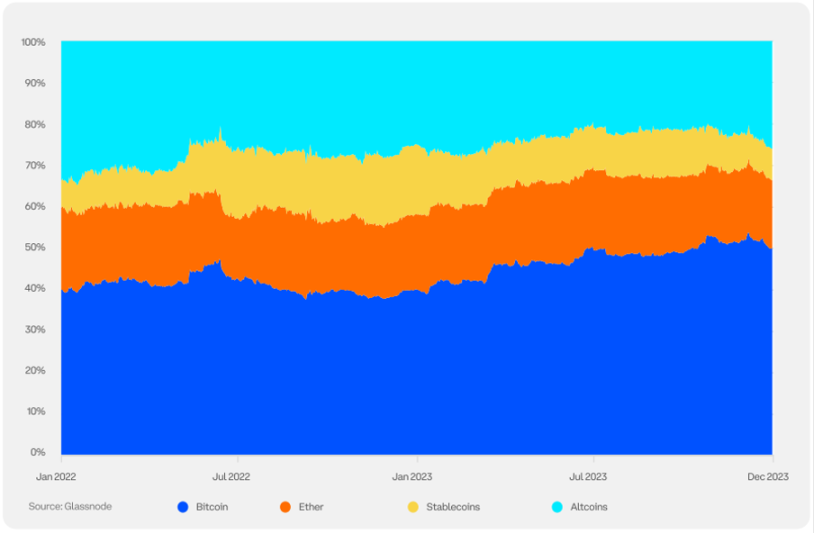
BTC dominance reached a historical high. With the increasingly optimistic prospect of the approval of the BTC spot ETF, BTC dominance has continued to rise over the past year, and investors still believe that the BTC halving in April 2024 could be a positive catalyst.
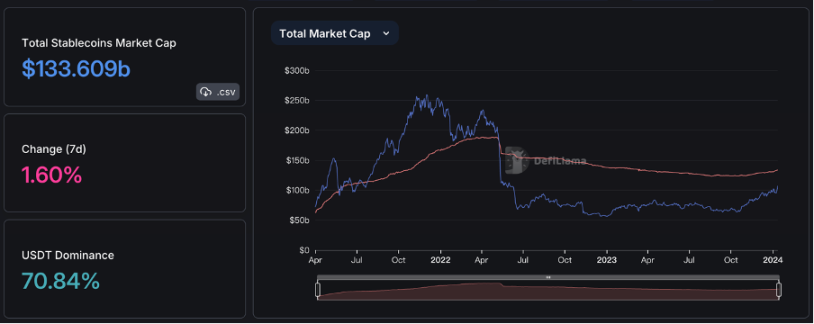
Stablecoin market cap increased by 1.6%. The supply of the top 2 stablecoins, USDT and USDC, has increased by 3% in the past month. The stablecoin PYUSD developed by Paypal also showed strong growth.
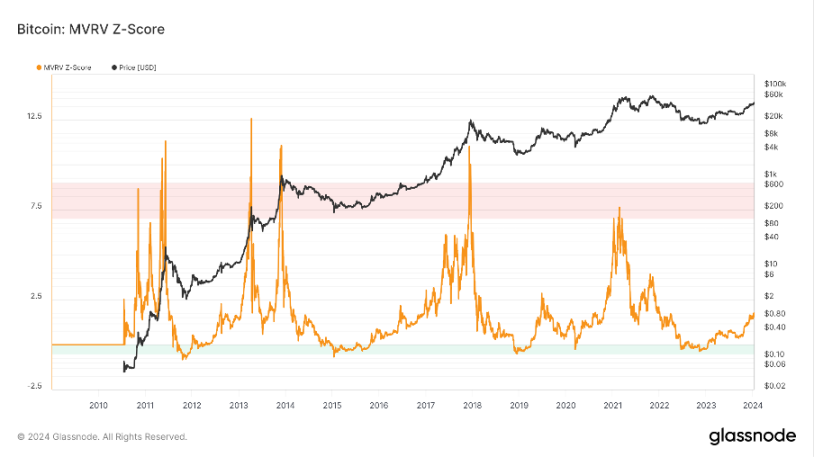
The long-term trend indicator MVRV-ZScore is based on the total market cost and reflects the overall profitability of the market. When the indicator is greater than 6, it is in the top range; when the indicator is less than 2, it is in the bottom range. MVRV has fallen below the key level of 1, indicating that holders are generally at a loss. The current indicator is 1.72, entering the recovery phase.
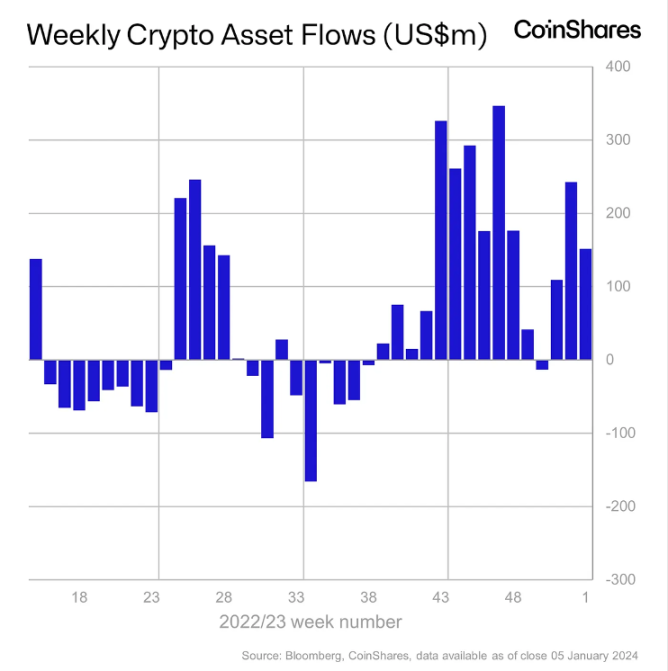
Institutional investment in crypto products continues to see net inflows. ETH fund inflows have increased, and market sentiment has improved.
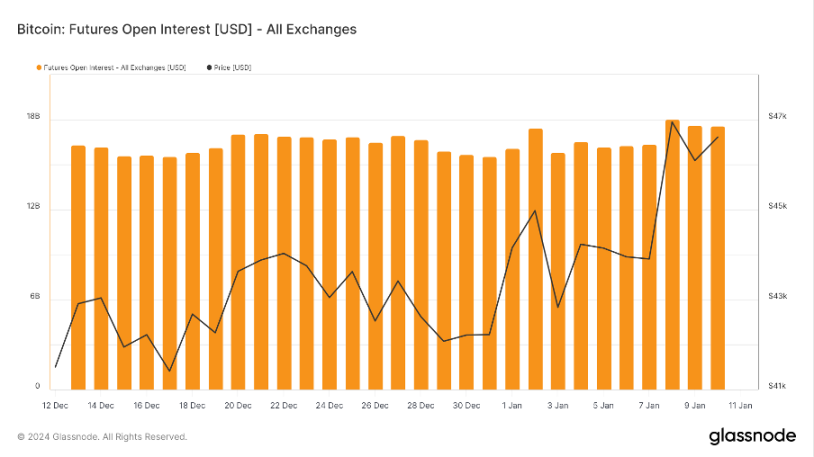
2) Futures Market Trends
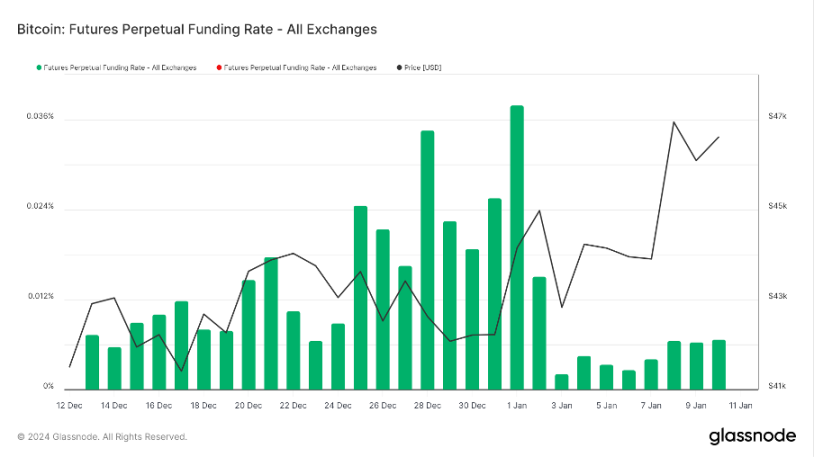
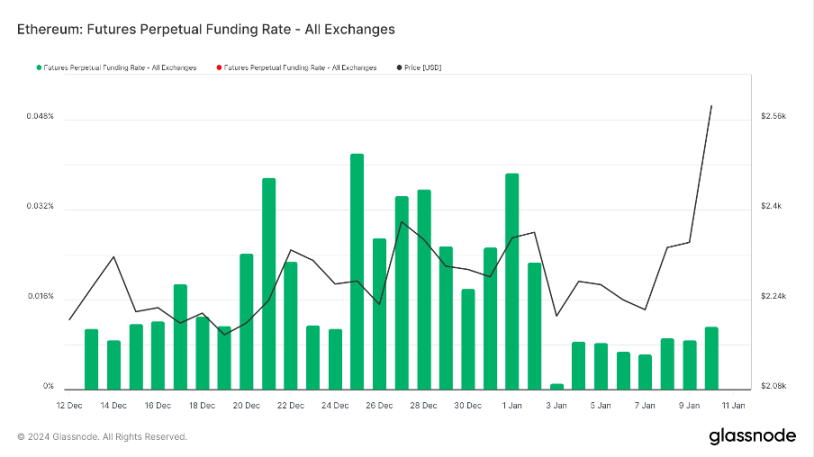
Funding rate: This week, the rate has returned to normal, and the market sentiment is neutral. The rate is 0.05-0.1%, indicating a higher long leverage, which may signal a short-term market top; a rate of -0.1-0% indicates a higher short leverage, which may signal a short-term market bottom.
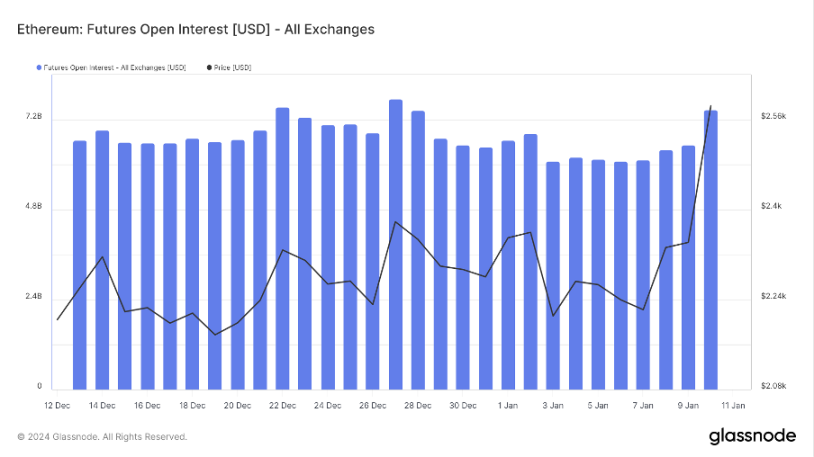
Open interest: This week, BTC open interest has slightly increased, and ETH open interest has significantly increased, indicating that the market's focus has shifted to long ETH positions.
 \
\
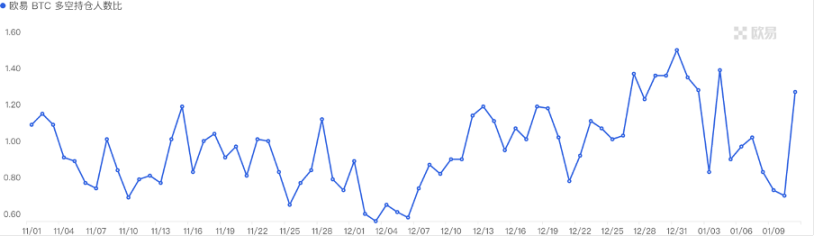
Long/short ratio: 1.3. Retail sentiment for long positions is rising. Retail sentiment is often a contrarian indicator, with below 0.7 indicating fear and above 2.0 indicating greed. The fluctuation of the long/short ratio weakens its significance as a reference.
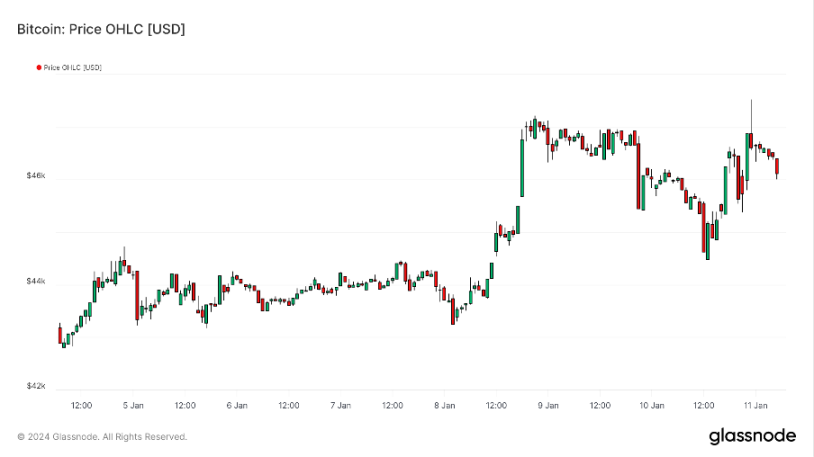
3) Spot Market Trends
BTC fluctuated at a high level, and ETH rebounded. In the previous rebound in 2019, BTC reached a high point of 14000, which was 70% of the previous bull market high of 20000. Similarly, this time, due to the expected rebound brought by the spot ETF, 48000 corresponds to 70% of the previous bull market high of 69000. Will history repeat itself? The market narrative shifted from BTC to ETH.
Previously, ETH underperformed the overall market by 50%. Comparing with BTC and SOL, ETH is highly likely to rebound to the position of this round's rise and fall. The ETH ecosystem is expected to outperform the public chain, so it is recommended to focus on the ETH ecosystem in the early stage and on the meme on ETH later.
B. Market Data
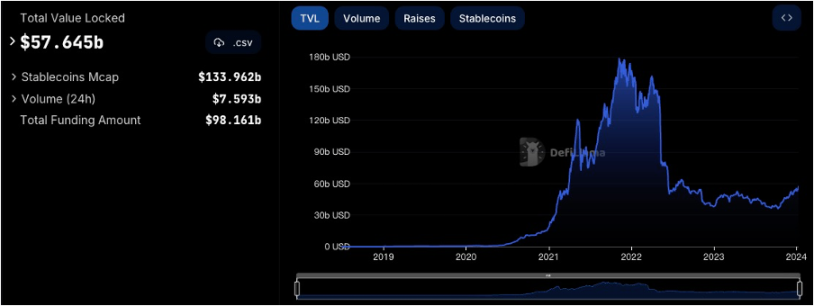
I. Total Lock-up Amount of Public Chains
II. Proportion of TVL for Various Public Chains
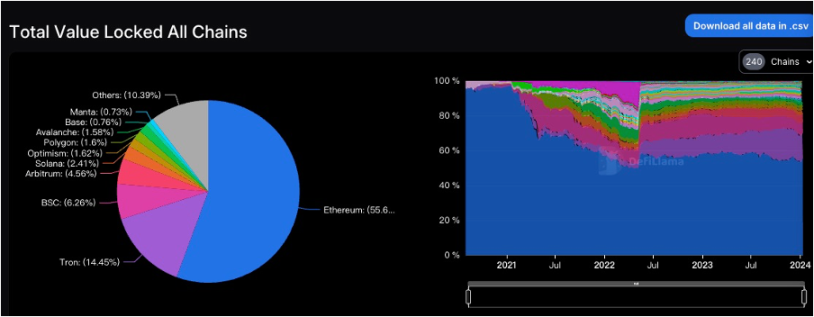
This week's total TVL is $576 billion, with an overall increase of around $38 billion, or about 7%. This week, the SEC officially approved the Bitcoin spot ETF, propelling BTC close to the $50,000 mark after successfully entering the global mainstream assets. Apart from a slight decline in the BSC chain, the TVL of the remaining mainstream public chains all saw significant increases. The TVL on the ETH chain increased by nearly 20%, TRON chain by 3%, OP chain, SOLANA chain, ARB chain, and POLYGON chain all increased by around 8%, and BASE chain increased by 4%. Of particular note is the MANTA chain, which has surged by 1500% in the past month and continued to rise by 26% this week, successfully displacing the CARDANO chain to enter the top 10 public chains. Undoubtedly, the SEC's approval of the Bitcoin spot ETF has once again brought about a wave of emotional highs, and the FOMO sentiment of retail investors in the market will gradually increase. With about 100 days left until the halving of BTC block production, let's wait and see if Bitcoin can reach a new all-time high before the block production halving.
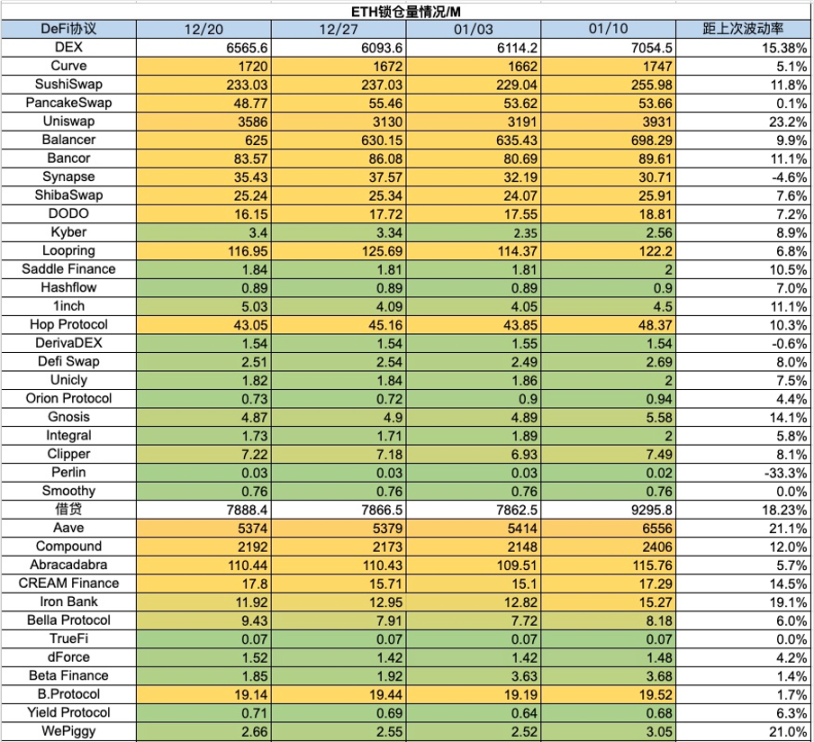
III. Lock-up Amount of Various Chain Protocols
1) ETH Lock-up Amount
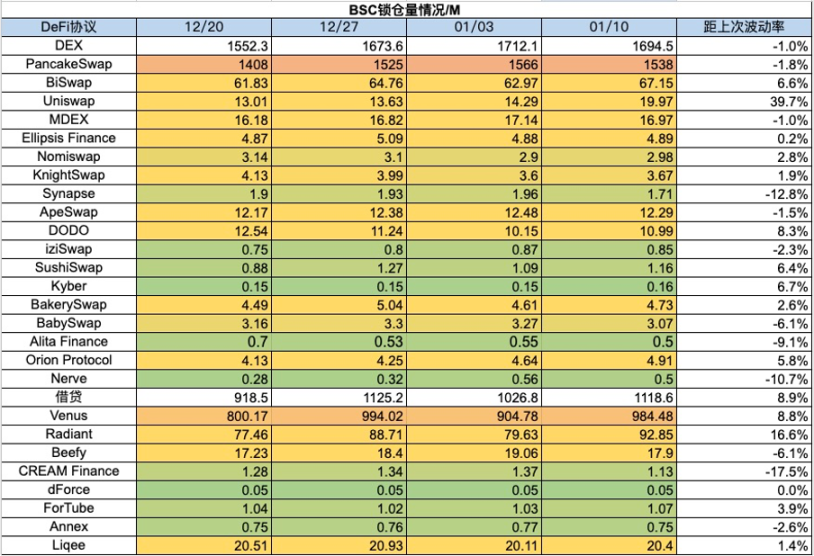
2) BSC Lock-up Amount
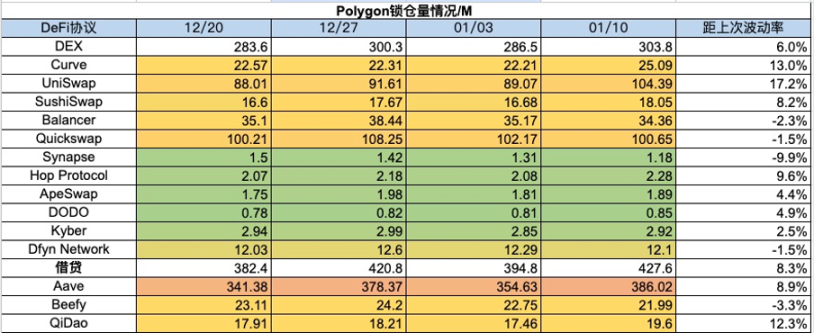
3) Polygon Lock-up Amount

4) Arbitrum Lock-up Amount
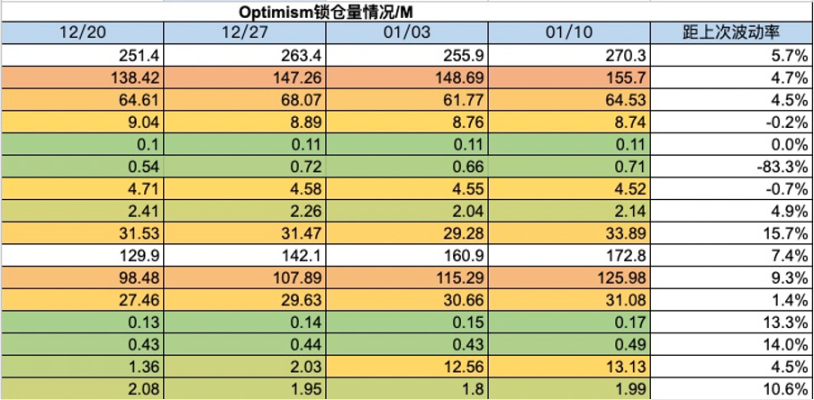
5) Optimism Lock-up Amount
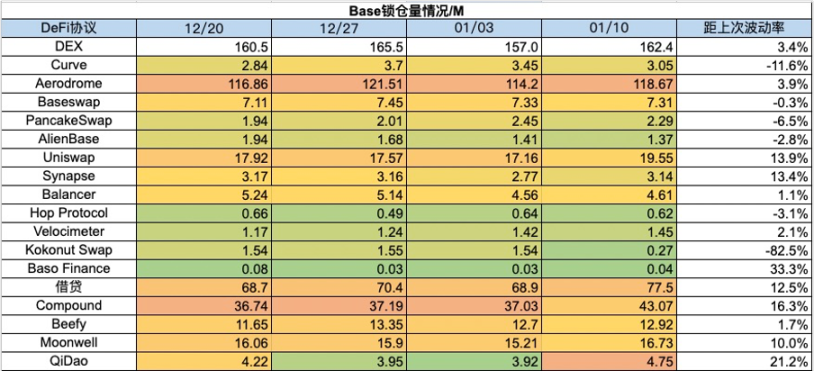
6) Base Lock-up Amount
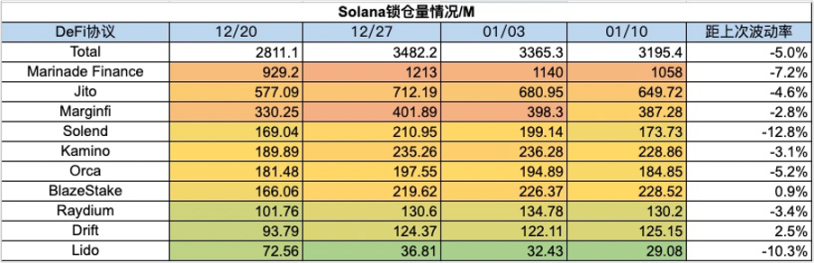
7) Solana Lock-up Amount
IV. Changes in NFT Market Data
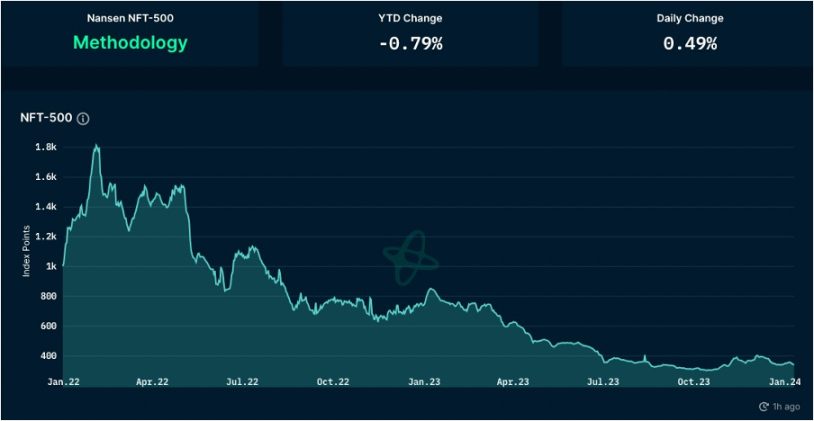
1) NFT-500 Index
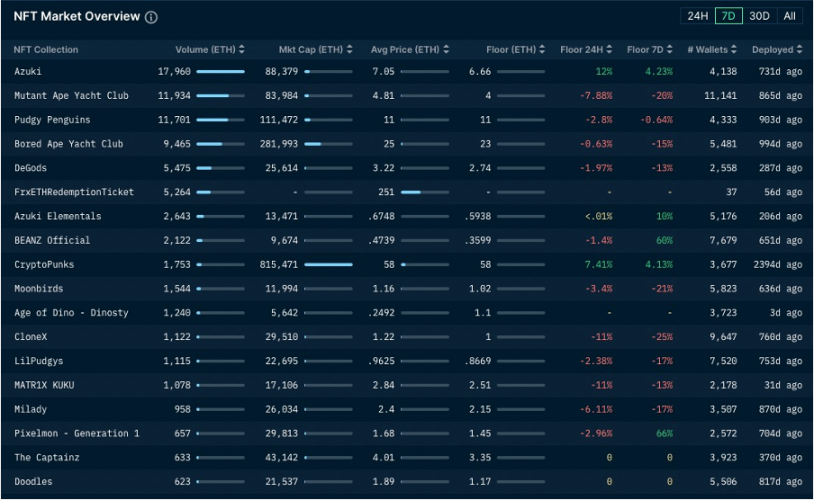
2) NFT Market Situation
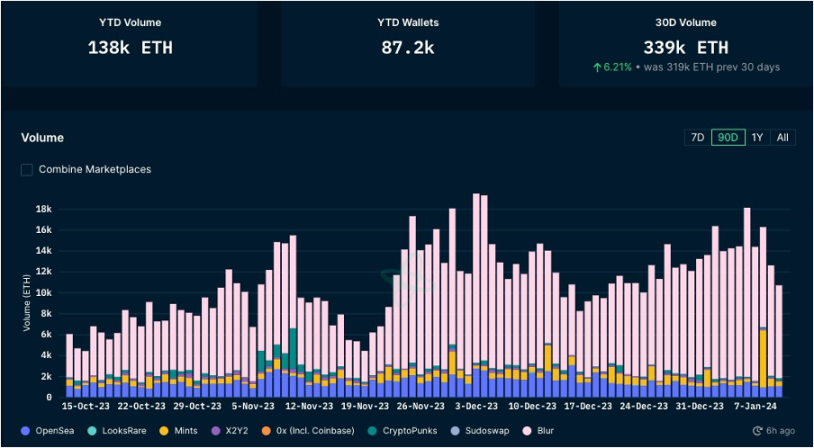
3) NFT Market Share of Trading Markets
4) NFT Buyer Analysis
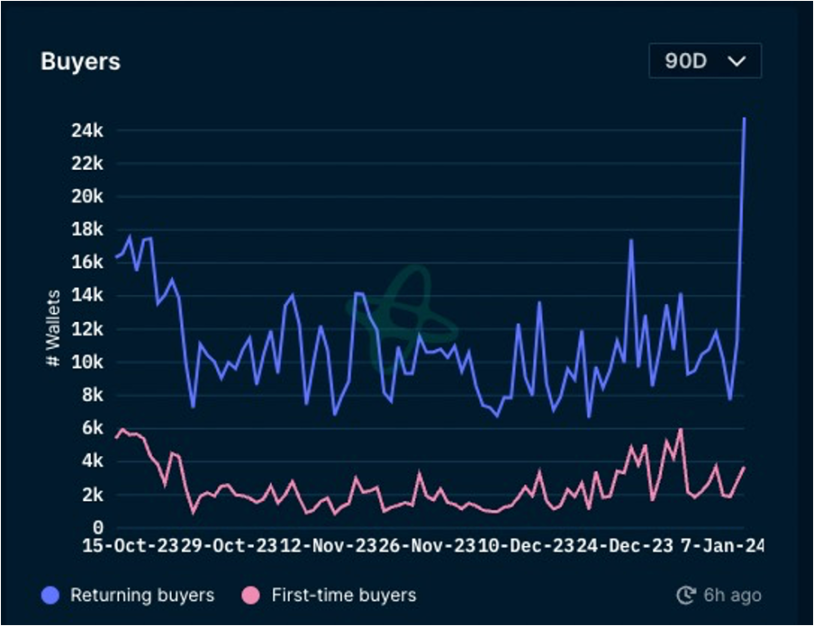
This week, the floor prices of top blue-chip projects in the NFT market plummeted. MAYC fell by 20%, BAYC by around 15%, DeGods by 15%, Azuki increased by around 4%, CloneX fell by 25%, and Milady fell by 17%. In the past week, there has been a significant decline in both the trading volume and the overall market of the NFT market, but the number of repeat NFT buyers has surged to its highest point in three months. The NFT market is yet to experience an explosion, and we need to be more patient in waiting for the spring of the NFT market.
V. Latest Financing Situation of Projects

VI. Post-Investment Dynamics
1) Orderly Network -- DeFi
Orderly Network's new futures are listed: $OP/ $WOO/ $MATIC. They are currently available for trading with 10x leverage on Orderly Omnichain DEXes.

2) Space ID - DID
Space ID 3.0 will be linked with Sei Network for ecological linkage and will hold a Twitter Space event together.
Details: https://twitter.com/i/spaces/1kvJpvLrNzXKE

3) Shardeum - Layer1
Shardeum announced the official release of Sphinx Validator 1.9.0, which is a network hard reset, so all past balances will be reset, and dapps will need to be redeployed.
For existing validators: http://shm.gg/validator-update
Install a new validator: http://shm.gg/validator
Reapply for testnet SHM: http://shm.gg/testnet-shm
4) Polyhedra Network - ZK
Polyhedra announced a collaboration with Dechat, which is an open, secure Web3 communication protocol that powers decentralized user interactions. This collaboration will advance a seamless, secure, and interoperable communication experience supported by zkBridge.

免责声明:本文章仅代表作者个人观点,不代表本平台的立场和观点。本文章仅供信息分享,不构成对任何人的任何投资建议。用户与作者之间的任何争议,与本平台无关。如网页中刊载的文章或图片涉及侵权,请提供相关的权利证明和身份证明发送邮件到support@aicoin.com,本平台相关工作人员将会进行核查。


