The market trend of Bitcoin is the barometer of the entire market, and this point is beyond doubt. However, in the past two days, we have witnessed a relatively strange scene: despite the clear expectation of a pullback in Bitcoin, many altcoins have continued to rise stubbornly. This indicates that the current decline in Bitcoin is still within the acceptable range for many altcoin speculators, which can be considered a consensus in the market.
Yesterday's article was also severely contradicted by the market. After only one upward movement in the 1-hour timeframe (although this movement was very strong), the trend reversed downwards. At present, a more detailed observation of the 30-minute timeframe may be needed to correctly grasp the strength of the market's long and short positions.
Looking back at the recent pullback of Bitcoin, many of them are small reversals on the 30-minute timeframe, meaning that a divergence on a small timeframe has caused a reversal on the 30-minute timeframe.
Let's first look at the 4-hour timeframe:
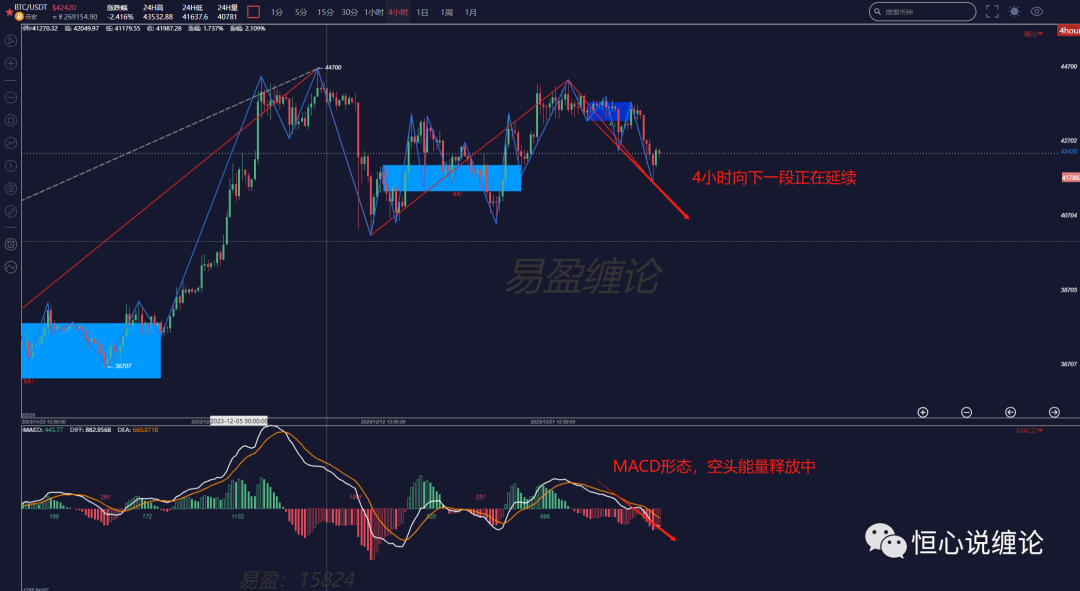
From the 4-hour timeframe, a new 4-hour central range is being constructed, and the current downward movement is still ongoing, and has not yet reached the lower boundary of the maximum central range (near 40200). At present, we need to see either a second buy signal on the 4-hour timeframe (corresponding to the second buy signal on the 30-minute timeframe) or a divergence structure in the trend on the 30-minute timeframe corresponding to the downward movement. Otherwise, we cannot consider the end of the current downward pullback. We can look at the last pin bar, although it was a small reversal on the 30-minute timeframe, there was still a confirmation of a second buy signal on the 30-minute chart (see the 30-minute chart for details).
30-minute timeframe:
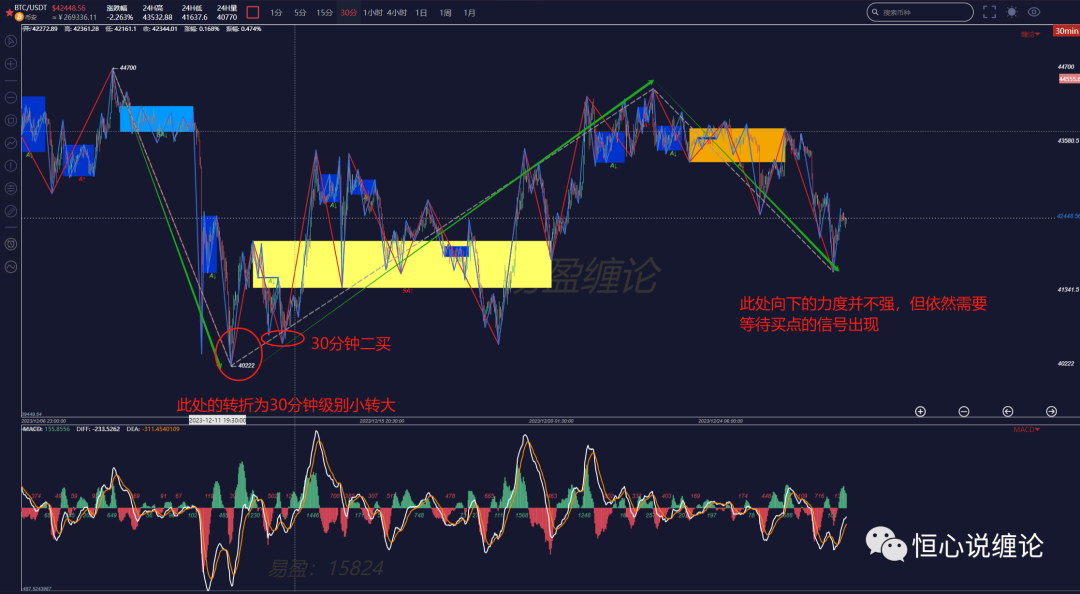
On the 30-minute timeframe, we can see more clearly how the reversals in the long and short positions occurred several times. After the downward pin bar on the left side reached 40200, a second buy signal appeared, followed by an upward trend;
while at the top, there was a clear divergence pattern corresponding to the 4-hour second sell signal. At the current position, there is no divergence or second buy signal, so the current short positions can continue. Consider covering the short positions and going long after a divergence structure or a second buy signal on the 30-minute timeframe. After the end of the downward trend on the 4-hour timeframe, there will still be at least an upward movement on the 4-hour timeframe. At that time, whether it continues to reach new highs or another second sell signal appears, we do not know at the moment.
The recent altcoin market is still in a state of fluctuation. On the one hand, it indicates that the speculators of altcoins do not consider the current position of Bitcoin to be very dangerous, and there is likely still room for upward movement; on the other hand, it also indicates that the upward trend in the second half of 2023 may be coming to an end, because the crazy rise of altcoins and the easy money-making market are unlikely to continue for too long before the bull market arrives. At present, altcoin speculators still need to pay attention to the risks.
Brief explanation of terminology:
Timeframe: A unique concept in the theory of Chan, representing the market in two dimensions of time and space. The larger the timeframe, the longer the time and the greater the fluctuation space, generally including 4-hour timeframe, 1-hour timeframe, 30-minute timeframe, etc.
Trend type: Divided into consolidation and trend, including upward trend and downward trend; each timeframe has its corresponding trend type.
Segment: The trend type of the sub-timeframe, "a segment of a certain timeframe" specifically refers to a segment.
Divergence: Refers to the end of an upward or downward movement, where the price reaches a new high/low, but the momentum clearly weakens. It is usually judged with the assistance of MACD.
The views in the article are for learning and reference only and do not constitute investment advice.
If you want to systematically learn the theory of Chan, use the automatic drawing tool of Chan theory, participate in offline training camps of Chan theory, improve your trading skills, form your own trading system to achieve a stable profit target, and use the Chan theory to timely escape the peak and bottom. You can scan the following QR code to add my WeChat (vhenrythu) for consultation and exchange of learning!
免责声明:本文章仅代表作者个人观点,不代表本平台的立场和观点。本文章仅供信息分享,不构成对任何人的任何投资建议。用户与作者之间的任何争议,与本平台无关。如网页中刊载的文章或图片涉及侵权,请提供相关的权利证明和身份证明发送邮件到support@aicoin.com,本平台相关工作人员将会进行核查。


