Original Title: "The Waterfall Effect of Capital"
Authors: Ding HAN, Checkmate, CryptoVizArt, UkuriaOC, Alice Kohn, Glassnode
Abstract
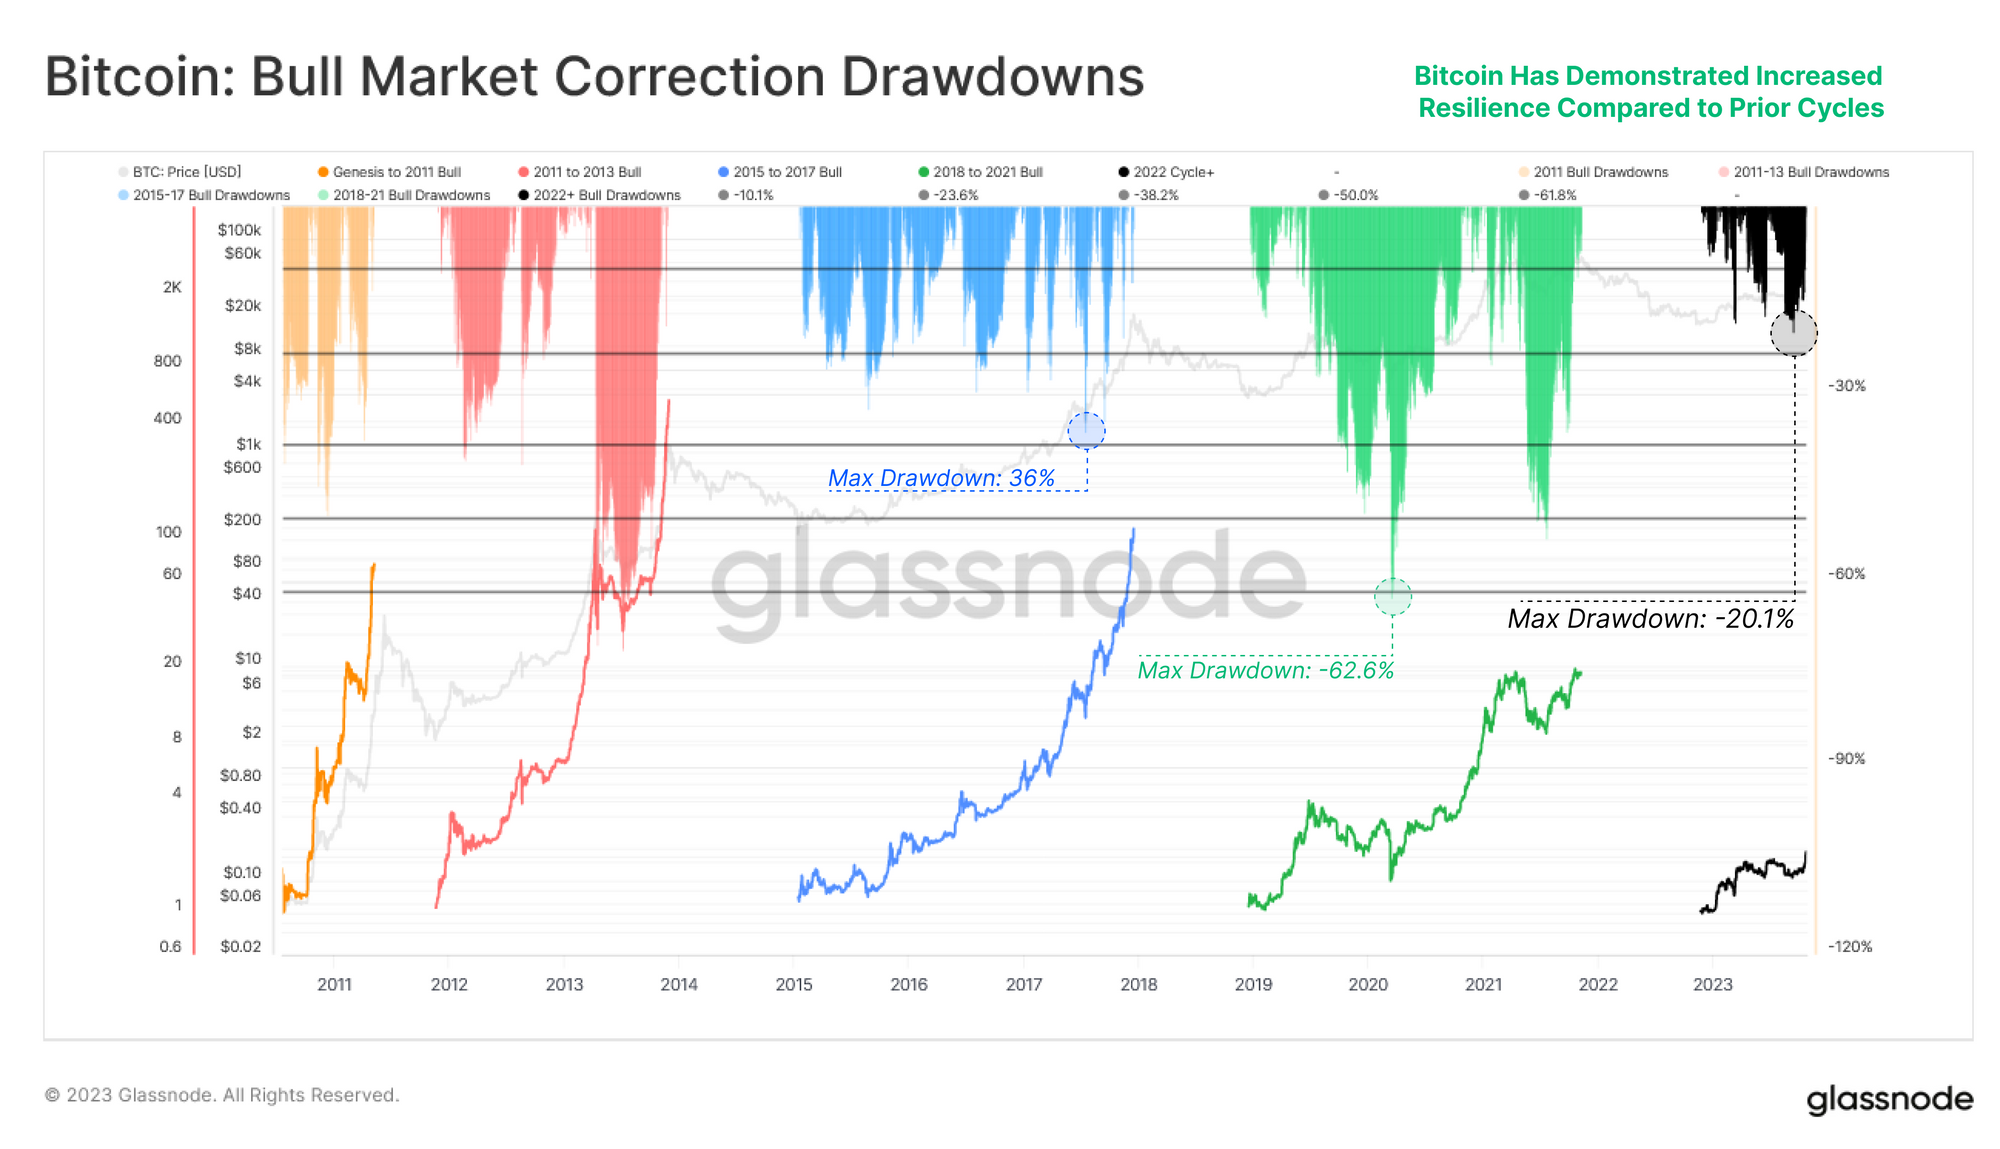
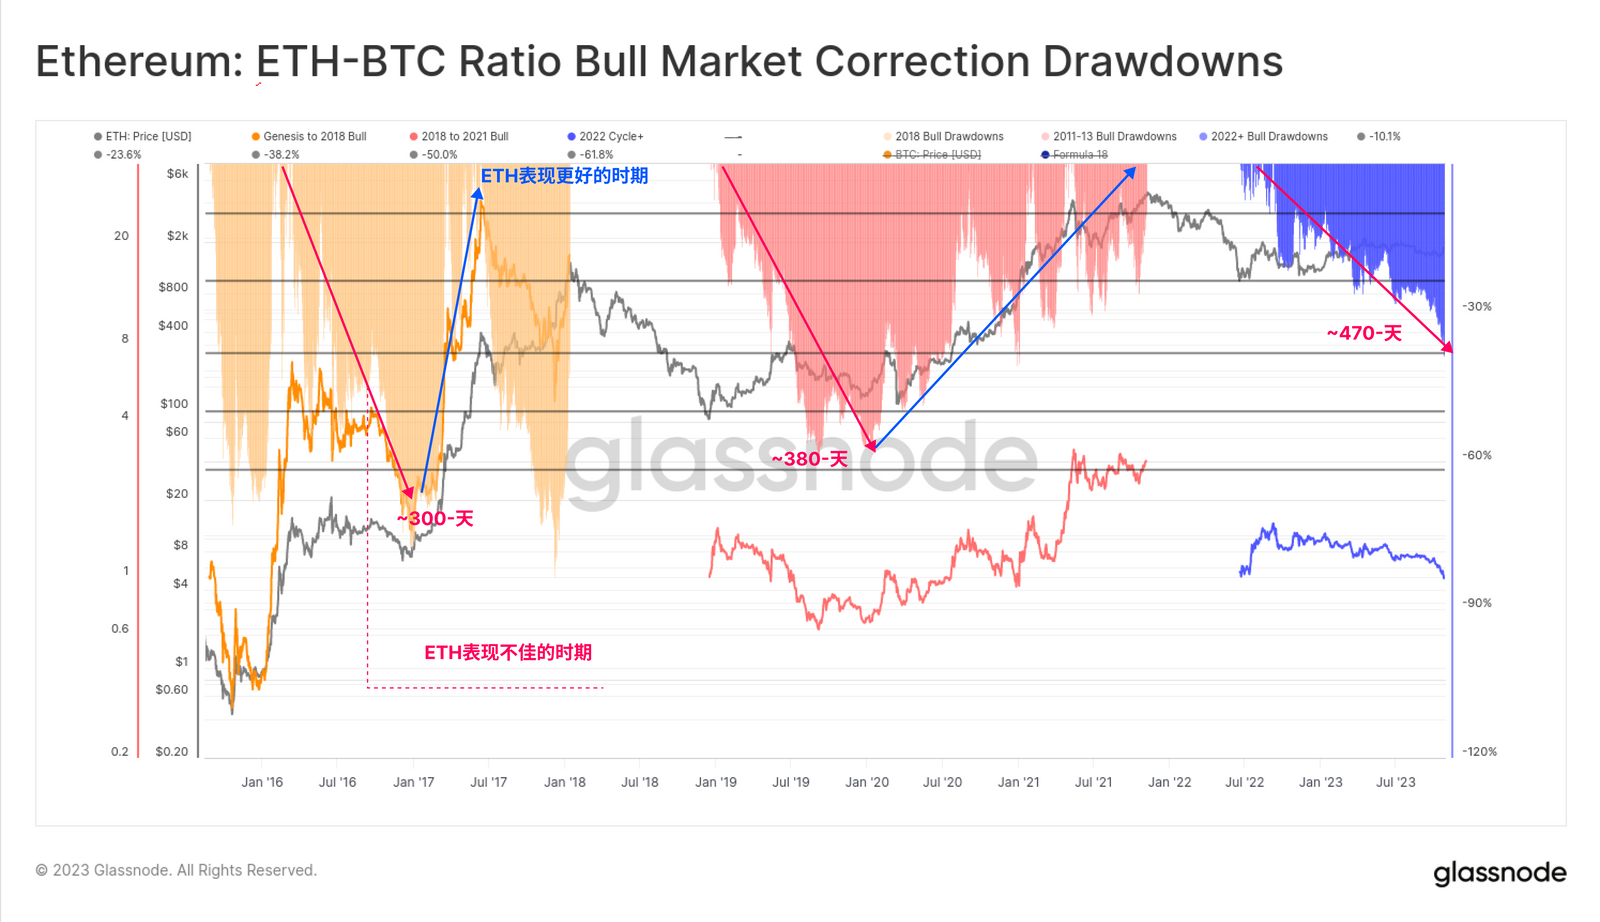
- BTC's performance can also be compared to this, with its deepest drawdown in 2023 being only -20.1%. During the bull market of 2016-17, corrections often exceeded -25%, while in 2019, it retraced over -62% from its peak of $14,000 in July 2019.To assess the capital flow within the digital asset market, a useful reference is to look for periods when ETH outperforms BTC. The chart below shows the depth of the maximum drawdown of the ETH-BTC ratio compared to the local high of the current uptrend.
Previous cycles have seen ETH retracements of over -50% based on the relative benchmark during the bear market recovery phase, with the current retracement reaching -38%. Of particular note is the duration of this trend, with ETH having depreciated relative to BTC for over 470 days. This highlights a potential trend between cycles, where BTC's dominance strengthens for a longer period after the hangover period following a bear market.
We can also use this tool to monitor turning points in the rising and falling risk periods.
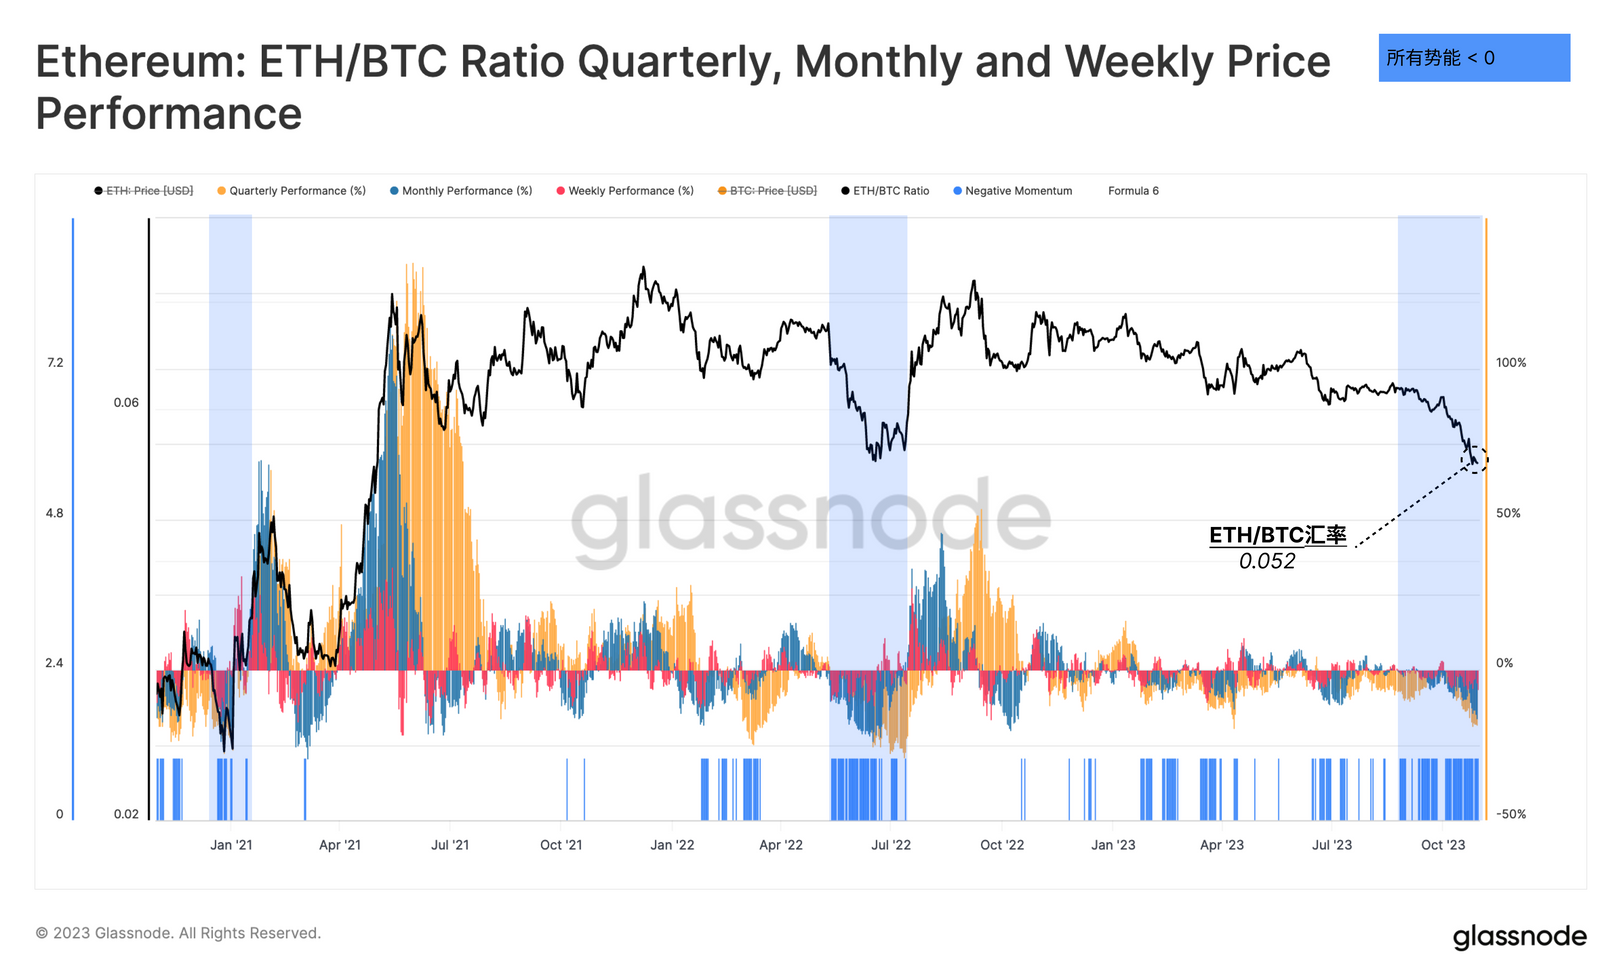
The chart provides an alternative view of the relative performance of the ETH/BTC ratio, displaying the oscillation indicators of quarterly, weekly, and rolling weekly investment returns for the ETH/BTC ratio. Subsequently, a bar chart indicator (in blue) prominently highlights periods when all three time frames show underperformance of ETH relative to BTC.
Here we can see that the recent weakness in the ETH/BTC ratio is similar to the situation in May to July 2022, with the price ratio reaching the same level of 0.052.

Investor Sentiment Trends
In-depth research into the Ethereum price model reveals that the trading price of ETH is $1800, which is 22% higher than the realized price ($1475). The realized price is typically considered the average cost basis of all coins in supply, priced at the time of the last trade.
This indicates that the average holder of ETH is holding a moderate profit, but it is still far below the extreme price levels often seen during bull market euphoria.
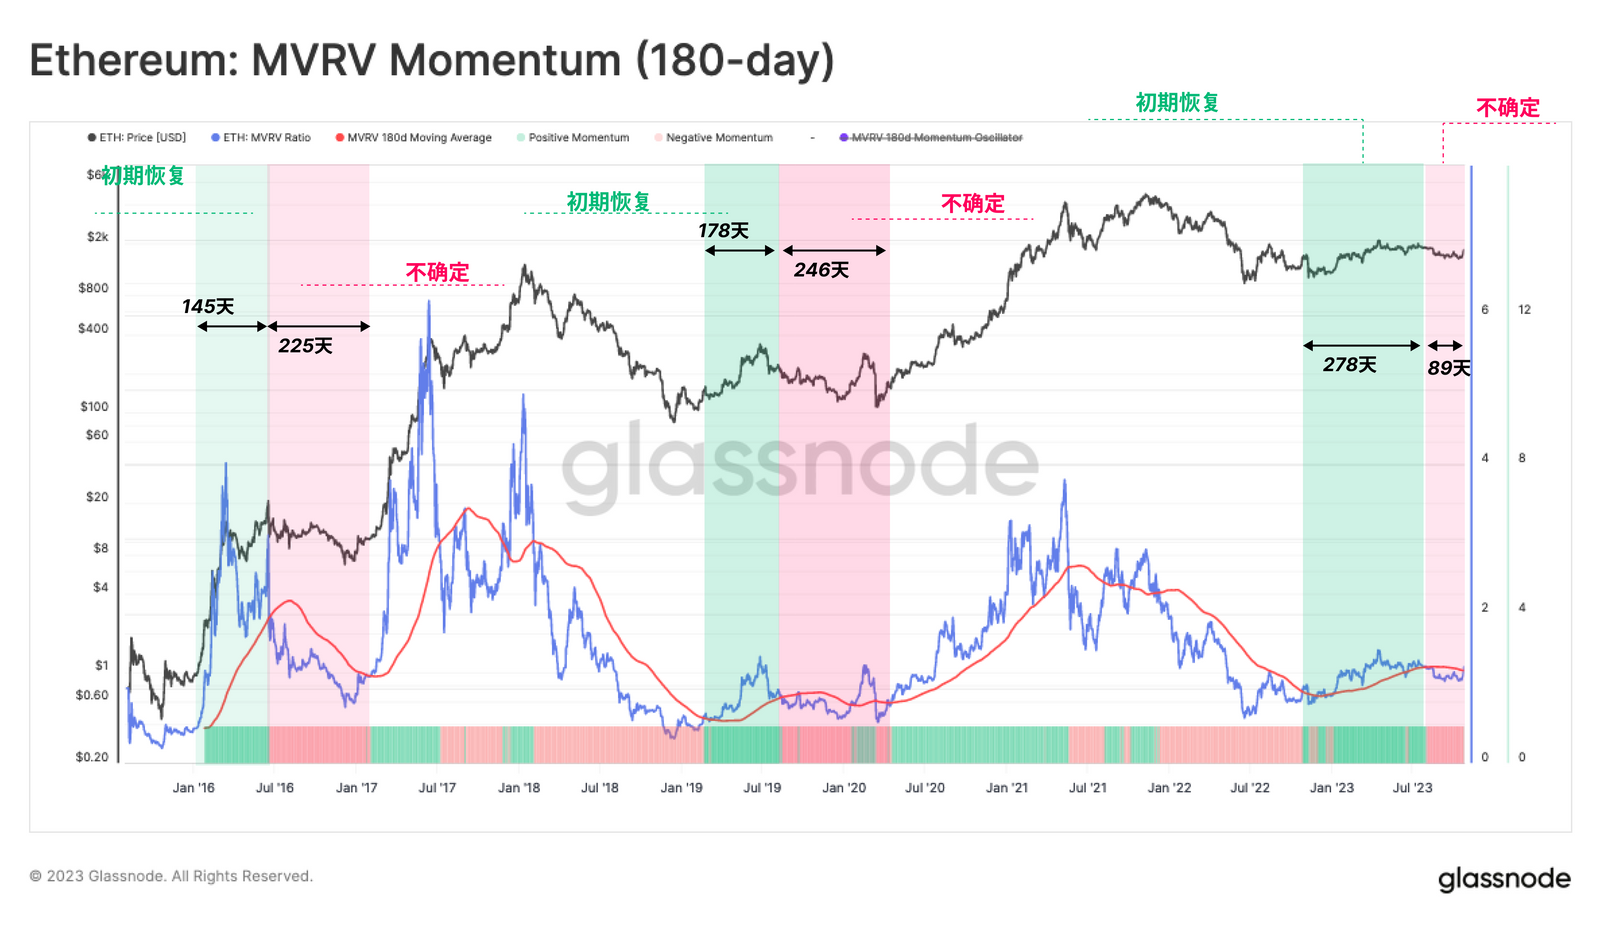
```html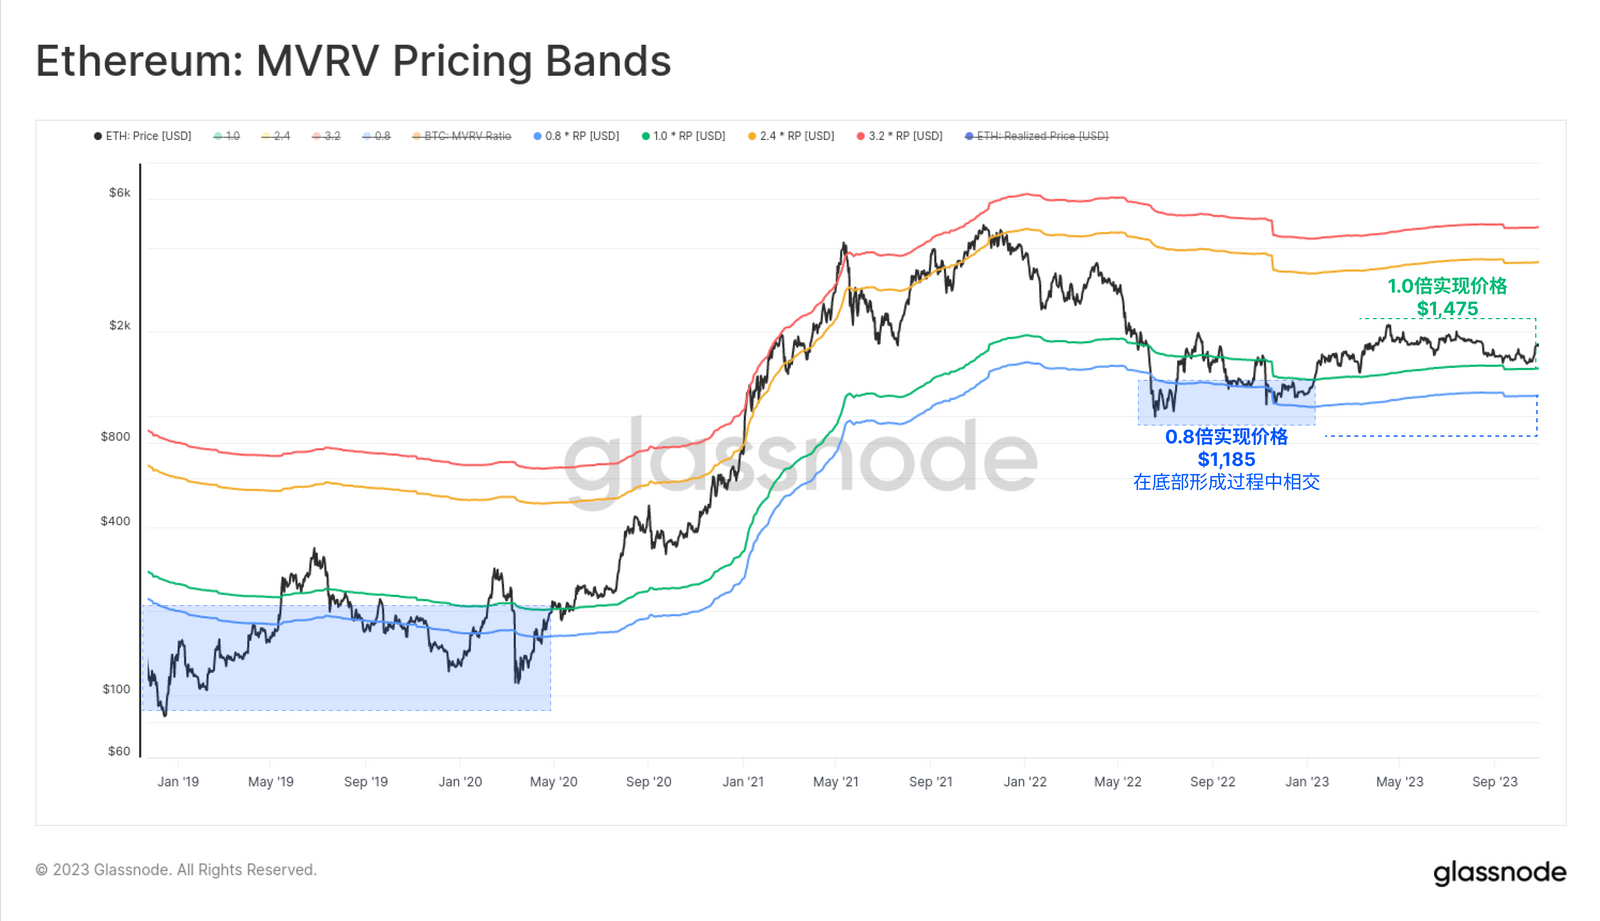 ```Another way to visualize changes in investor profitability is through the MVRV ratio, which is the ratio between price and realized price. In this case, we compare the MVRV ratio with its 180-day moving average as a tool to monitor trends.
When the MVRV ratio is higher than this long-term average, it indicates a significant increase in investor profitability, which is usually a signal of a rising market. However, despite ETH's strong market performance earlier this year, the market is still in a negative trend according to this indicator. It seems that the aftermath of the 2022 bear market is slowly dissipating.
```Another way to visualize changes in investor profitability is through the MVRV ratio, which is the ratio between price and realized price. In this case, we compare the MVRV ratio with its 180-day moving average as a tool to monitor trends.
When the MVRV ratio is higher than this long-term average, it indicates a significant increase in investor profitability, which is usually a signal of a rising market. However, despite ETH's strong market performance earlier this year, the market is still in a negative trend according to this indicator. It seems that the aftermath of the 2022 bear market is slowly dissipating.