Author: 0xKyle
Translated by: Deep Tide TechFlow
Deep Tide Overview: Gold has suddenly broken out after months of correction, driven by the central bank returning to buying and the clearing of speculative sentiment. This article presents asymmetric opportunities from macro logic and technical aspects, providing valuable insights for investors focused on safe-haven assets and macro trading.
Note: This article was published to my subscribers on August 9. Pricing and other information may be outdated. Thanks to Cptlightyear and Riff for bringing it to light; they are impressive. Also, thanks to basedpotato for providing charts and some of the insights below.
I did some due diligence on the gold argument over the weekend. Gold has bottomed for months and then surged upward. This article is just a collection of my findings about gold.
Qualitative Arguments
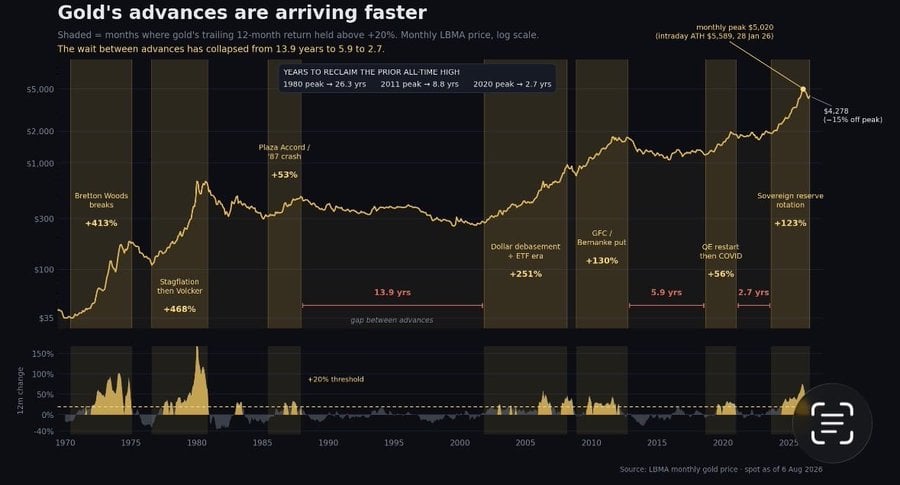
The cycles are becoming increasingly compressed: 2000-2011: 10 years; 2011-2020: 9 years; 2020-2022: 2 years
The initial bullish logic has strengthened over time—after the West froze Russian reserves, countries were forced to diversify away from fixed income securities in developed markets (especially China). Coupled with America's debt issues, no one wants to be a buyer of the country with the world's largest debt—everyone is looking for alternatives. This is a very long-term, broad macro bullish logic.
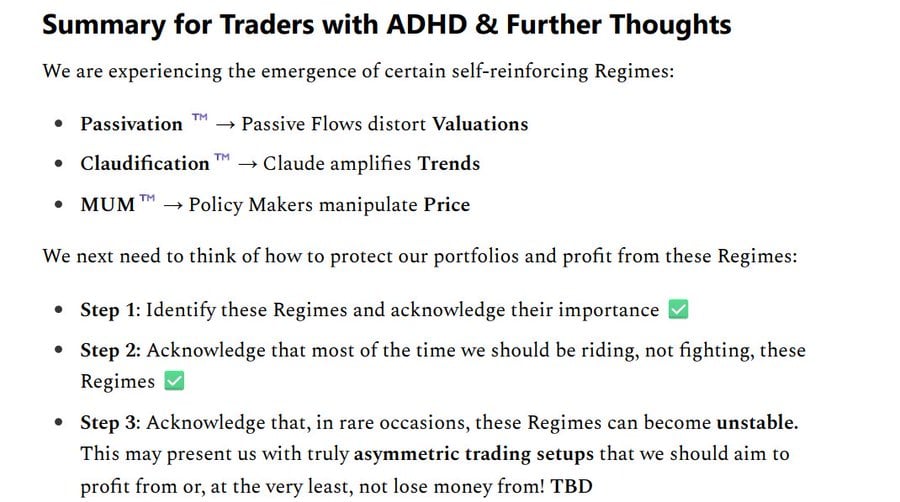
Add to that the era of Trump’s corruption—the Federal Reserve is being slowly eroded. Currently, volatility is being suppressed—Shrub's article aptly points out: passive fund flows combined with Claude "Hey, what should I invest in?" along with policymakers manipulating prices (Bessent suppressing paper oil prices) --> gold is the long-term safe haven choice.
But why now? Gold peaked in February 2026 at 5300 USD; since then, it has retraced 26%, and traders have been looking for the bottom. The reasons for the correction are varied, but Chinese liquidity, the Iran war, and the central bank halting purchases seem to be the main factors.
The chart below shows the annual changes in net liquidity provision to China's currency market by the People's Bank of China, measured daily and smoothed with a 50-day moving average. An important feature is a significant peak on March 2. Since then, liquidity has stopped accelerating and then contracted.
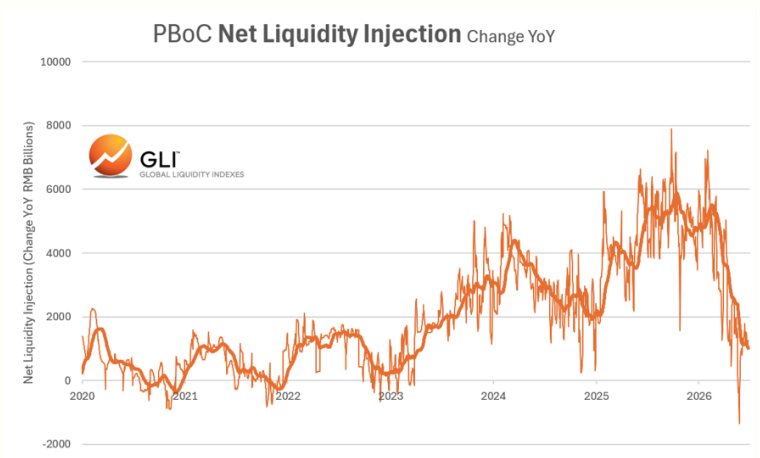
Daily reverse repos have recently increased, but it’s still unclear. What is clear is that the central bank has resumed buying after the Q1 quiet period! (This drop coincides perfectly with it)
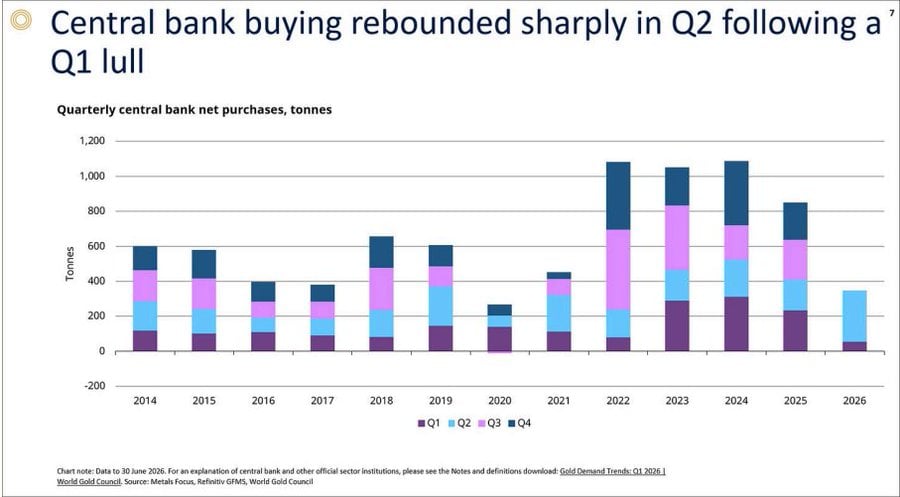
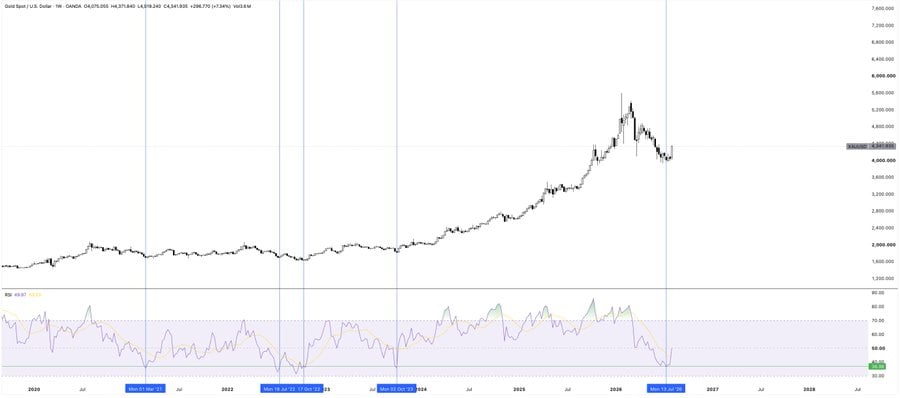
Moreover, these countries (especially China as a major buyer) do not want speculative mania in the market. They want to accumulate as much as possible, at the lowest possible price. If a bull market fever gets out of control, they will exit—so when sentiment turns extremely bullish, that’s what they do. But over the past few months, this speculative sentiment has collapsed—which aligns with the RSI readings (which will be detailed in the technical section below).
Now, these players have missed out. Everyone and their moms are buying semiconductor stocks. Remember the photos in January of people lining up at gold stores? As Citrini said—"When people worry about the future, they buy gold. When they worry about the present, they sell gold." People sold gold because of the war—they are worried about the present. Now, I do not know if people are worried about the future, but they certainly are not worried about the present! The queues at the gold stores in my country have disappeared.

Now, gold sentiment has cooled. Today, very few people care—again, everyone is buying semiconductor stocks and momentum stocks. I think this is a great combination—an asymmetric opportunity, timing, plus people are not in yet. This is the kind of fat trade I like the most. Today, very few people care.
From a macro perspective—theoretically, higher real interest rates and a stronger dollar should lead to lower gold prices. I am not a macro expert, but the logic is higher real interest rates → gold does not pay interest → investors prefer bonds; at the same time, a stronger dollar → gold becomes more expensive for buyers in other currencies.
Despite this, gold has not dropped below 4000 USD. I trade gold myself, have taken long positions multiple times—none have been successful. It did fluctuate in the 4000 USD price range—initially bearish. But over time, this price range has become support—obviously, this is accumulation.
On the seasonal front: early August is precisely when the summer lull ends, and seasonal strength returns—this is the current breakout.
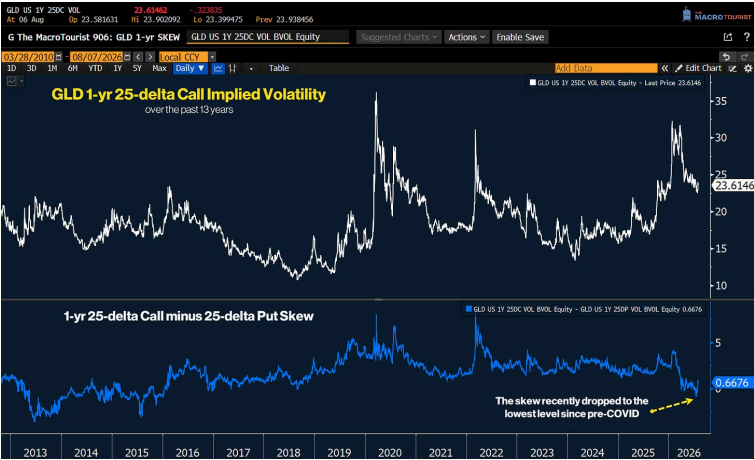
Finally, thanks to Macro Tourist: Gold's 1-year 25-delta call option skew is at its lowest level since before the pandemic—no one is paying for right-tail risk.
Technical Arguments
Gold has triggered many technical signals:
In the bull markets of the past few years, the 50-day moving average has been a crucial level that gold often maintains above. It always tests that level and then continues its upward trend.
On January 26—gold fell sharply from 5500 USD to 4400 USD; it rebounded from the 50-day moving average. The bull market resumed. The Iran war began—closing below the 50-day moving average. It then lingered there, with the 50-day moving average turning into resistance.
Now, the gold price has once again risen above that line (blue line).
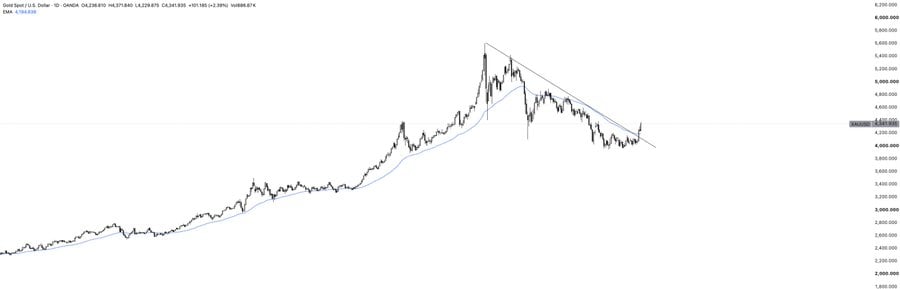
Additionally, a simple descending trend line (black line in the chart) has been broken.
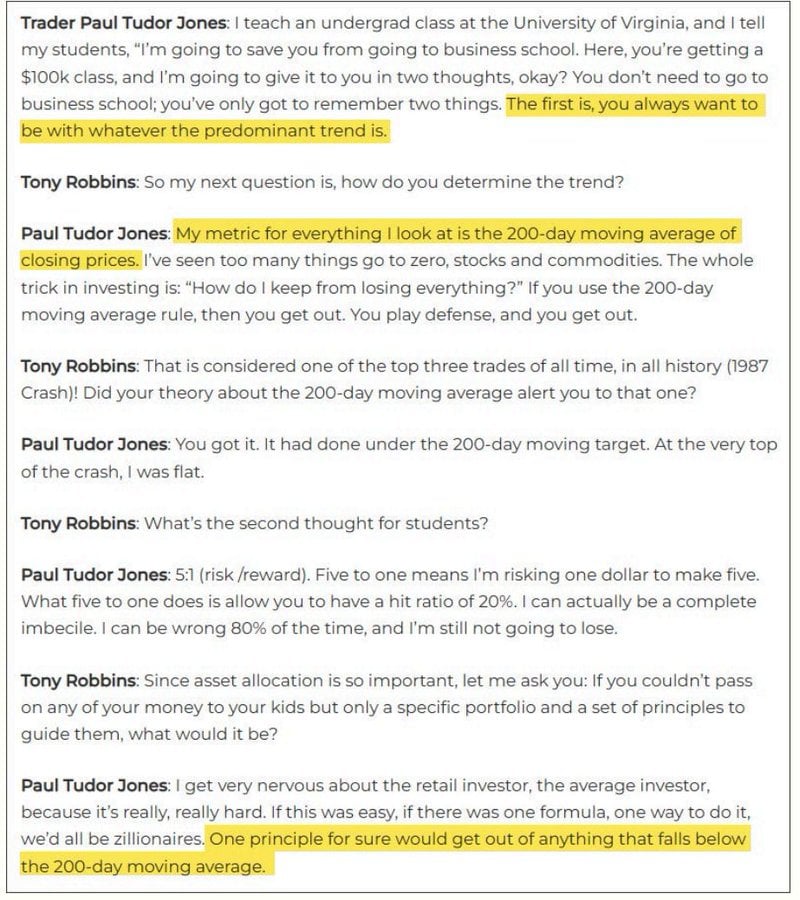
You might think technical analysis is male astrology. But PTJ said, "One certain principle is that anything that breaks below the 200-day moving average needs to be exited." Guess what gold just did?
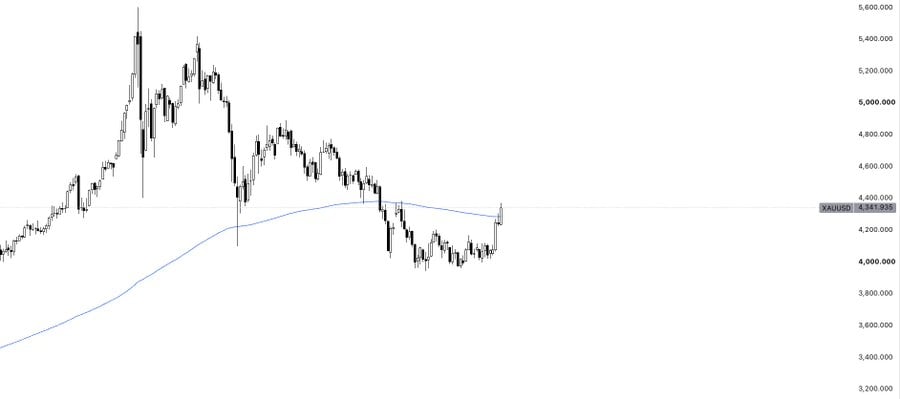
That's right, it has risen above the 200-day EMA. The final point is the RSI. I find the RSI on higher time frames like the weekly and monthly to be strong signals. Gold's weekly RSI has been close to oversold for several weeks. Each time it reaches this position, it seems to initiate a new upward trend.
Now, the gold price has rebounded. The structure looks very nice. It has basically broken through all EMAs. The short-term EMAs are also crossing, which is a bullish indicator. EMA 10 crossed above EMA 21.
One thing to note. Gold has triggered a sell signal on my (20/3) Bollinger Bands (20-day EMA, 3 standard deviations). This signal is almost always a sell. So I expect a short-term pullback. I will aggressively build positions on the pullback. As I have said, gold can be traded with large positions because intraday volatility is not that large (unlike stocks, which can fluctuate 10%).
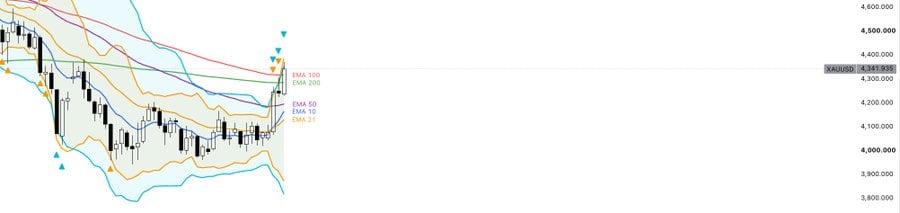
In the range of 4341 USD to 4191 USD (daily EMA 50), it may be very suitable to set limit buy orders.
The invalidation point for the entire trade is around 4170 USD. If it closes below this level, it is basically at the top of the range. A close below signifies a return to range-bound trading.
免责声明:本文章仅代表作者个人观点,不代表本平台的立场和观点。本文章仅供信息分享,不构成对任何人的任何投资建议。用户与作者之间的任何争议,与本平台无关。如网页中刊载的文章或图片涉及侵权,请提供相关的权利证明和身份证明发送邮件到support@aicoin.com,本平台相关工作人员将会进行核查。


