Author: Jim Paulsen
Translation: Deep Tides TechFlow
Deep Tides Introduction: The proportion of defensive stocks in the S&P 500 has dropped to 17%, close to a historic low—what does this mean? Veteran strategist Jim Paulsen tells you with over 60 years of data: whenever investors throw "risk aversion" out the window, the market is often not far from trouble. If your portfolio is filled with AI and tech stocks, this article is worth your serious reading.
Sometimes in the stock market, investors gather around a common theme or simultaneously avoid an important sector. This "herd" behavior often provides important information that should not be overlooked—but it doesn't necessarily need to be followed. Now may be one of those moments.
For most of this bull market, investors have poured into new era stocks and achieved great success. This bull market has been continuously boosted by several star sectors, including Mag7, quantum computing, hyperscale computing power, artificial intelligence, micro-cap stocks, IPOs, and cryptocurrencies. Amid all this excitement, investors are increasingly allowing the level of "risk aversion" in their portfolios to fade, which might be understandable.
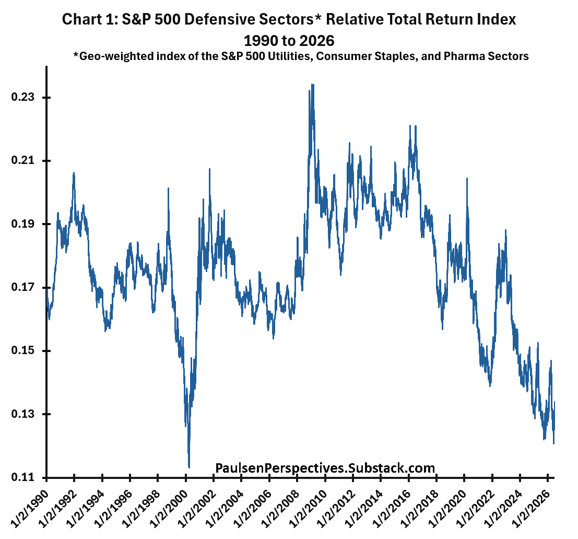
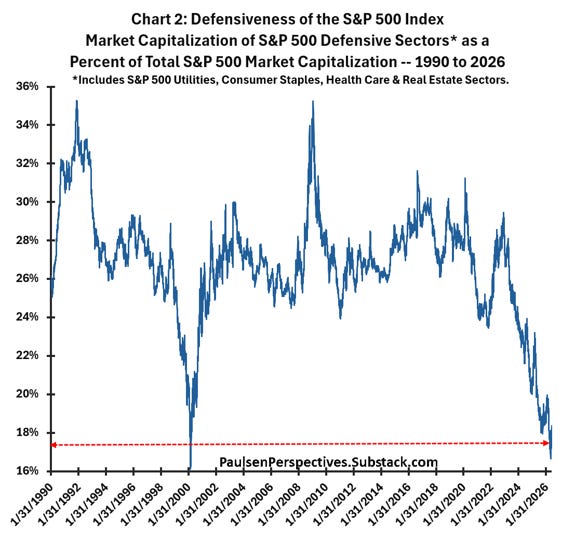
Chart 1 shows that "defensive stocks" have consistently underperformed in the contemporary bull market and have lagged behind the broader market for most of the past decade. Chart 2 indicates that risk aversion within the S&P 500 is slowly disappearing. Defensive stocks currently account for about 17% of the total market capitalization of the S&P 500. This is close to a historical low, nearly half of the peaks during the early 1990s and the 2009 market bottom—when defensive stocks accounted for nearly 36% of the overall market. No one knows how long the current tech craze will last, or how high the market will rise under the leadership of new era stocks. Nobody knows!
Despite this, it is becoming increasingly clear that the S&P 500 index—possibly also most portfolios—is becoming riskier. With "defense" now occupying such a small proportion of market capitalization, market volatility is expected to intensify during the remaining period of this bull market. Running purely on high octane without defensive buffers may still be successful, but it might also be much more nerve-wracking. Furthermore, as risk aversion continues to fade, the likelihood of disappointing outcomes also increases.
Stock Market Risk Aversion
A good indicator of the level of risk aversion in the stock market may be the relative performance of low beta stocks compared to high beta stocks. Chart 3 shows the total return performance of the lowest quintile price beta stocks relative to the highest quintile price beta stocks since 1963. The data comes from the Kenneth R. French database, including all U.S. stocks listed on the NYSE, NASDAQ, and AMEX.
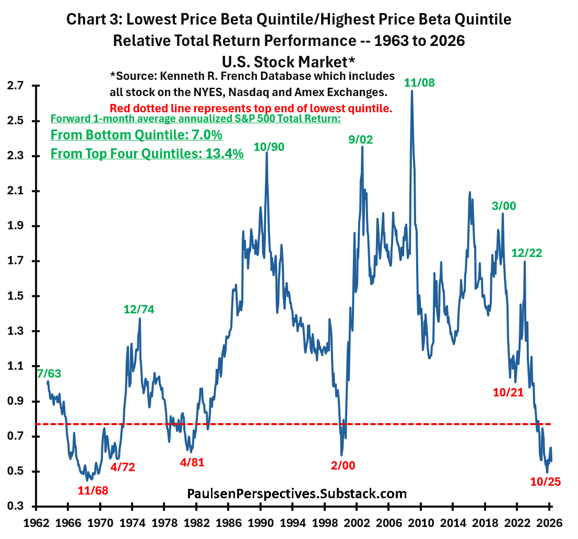
Over the past nearly 65 years, there has been a significant performance gap between the most defensive stocks and the most aggressive stocks. The relative total return index between low beta and high beta stocks ranges from about 0.4 to 2.7. Periods of extreme defensiveness are marked by the highest relative values, while extreme bullishness (or lack of defensiveness) is indicated by the lowest relative readings.
The dates shown on the chart clearly indicate that the degree of defensiveness is closely related to the future risk of the overall stock market. Major peaks in the relative performance of low beta to high beta stocks (marked in green on the chart)—typically characterized by excessive pessimism and caution driving the outperformance of the most defensive stocks—often represent very good buying opportunities. For example, buying into the market in July 1963, after the Cuban Missile Crisis sell-off, saw the market rise nearly 60% from July 1963 to the peak of the S&P 500 in 1968! December 1974 marked the market bottom for the Nifty Fifty, October 1990 represented the "beginning" of the tremendous bull market of the 1990s, September 2002 marked the bottom of the internet bubble bear market, November 2008 was just months before the early 2009 Great Recession bear market, March 2000 was the bottom of the pandemic bear market, and lastly, December 2022 was very close to the bottom of the 2022 bear market.
This major low point of the relative total return index—when low beta stocks significantly underperformed high beta for a period—usually indicates widespread optimism and very low defensiveness in the stock market (dates marked in red on Chart 3)—historically proven to be periods when investors should be cautious about investing in the stock market. November 1968 marked the beginning of the 1969-70 bear market, April 1972 was a few months before the start of the Nifty Fifty's market crash, April 1981 marked the beginning of the bear market after Volcker's tightening, February 2000 nearly precisely marked the peak of the internet bubble bull market, and October 2021 was just weeks before the start of the 2022 bear market.
Last October, this defensive indicator approached its lowest level since 1963. Although the S&P 500 index did indeed suffer a nearly 10% pullback earlier this year—hitting the low in March—it has since rebounded to new historical highs. Nevertheless, the low/high beta relative performance of the U.S. stock market remains severely depressed, still signaling potential difficulties for the overall stock market in the coming months.
The red dashed line represents the lowest quintile of this indicator since 1963. As shown in the chart, when the low/high beta relative index is in the lowest quintile, the S&P 500 index's average annualized total return over the next month is only 7% (below the average return), while the average future annualized return at other times is 13.4%. That is to say, historically, when defensiveness is in the lowest quintile, the S&P 500's average annualized total return over the next month has been roughly "half" of what the stock market provides at other times. When defensiveness disappears, it is best for investors to advise "caution."
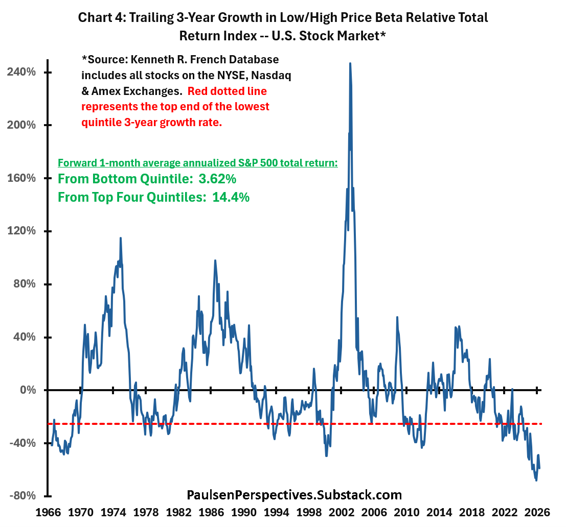
Chart 4 illustrates this more clearly, showing the growth of the low/high beta relative total return index over the past 3 years (i.e., growth of the series shown in Chart 3 over the past 3 years). While the level of low/high beta relative performance is important for future stock market returns, the degree of sustained underperformance is also very significant. Today, not only is the relative total return of low/high beta stocks close to historical lows, but low beta stocks have significantly underperformed for at least the past 3 years. As shown in Chart 4, historically, whenever the past 3 years' relative total return of low/high beta stocks has been in the lowest quintile since 1963 (i.e., below the red dashed line, indicating that low beta stocks are severely and consistently underperforming, just like today), the average annualized total return of the S&P 500 over the next month has been very disappointing, at only 3.62%, while the average annualized total return at other times has been 14.4%. Low beta stocks are underperforming, but the degree of sustained underperformance over recent years—indicating that investors have thrown caution to the wind—means that the S&P 500 may face a tough road in the coming months. Historically, when this caution signal flashes red like today, the average annualized total return of the S&P 500 over the next month is nearly 4 times less than at other times since 1963.
Consider Overweighting Broad Market Exposures
While downward volatility for the overall stock market may affect all stocks, I suspect any sell-off will be concentrated in the highly favored (high beta) new era stock sectors. Therefore, rebalancing the portfolio to reduce these overly held sectors and increase exposure to broader market targets, such as small-cap stocks, value stocks, defensive and cyclical sectors, and international stocks, may outperform the overall S&P 500 for the remainder of this year.
Chart 5 shows the relative total return index of "broad market" proxy indicators since 1950. There are a few points worth noting. First, since around 2011, broader market stocks have mostly underperformed the overall S&P 500 index—similar to the sustained underperformance during the period from 1983 to the late 1990s. In fact, since 2011, the relative total return of broad market targets has fallen from the highest quintile to the lowest quintile. Using its relative total return index as an attractiveness guide, it has shifted from massive overweights and excessive popularity in 2011 to today's extreme underweight and cheapness.
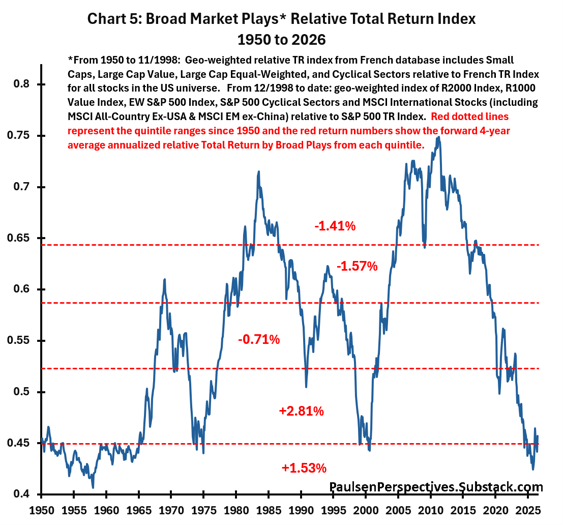
Second, historically, the relative performance of broad market targets often undergoes "long-term" cycles. It significantly outperformed from 1958 to 1969, underperformed from 1969 to 1975, again led the market from 1975 to nearly 1984 for almost a decade, suffered a nearly 15-year underperformance from 1985 to 2000, led again in the decade before 2010, and has mostly underperformed in the past 15 years. Long, sustained cycles of relative performance are not uncommon. Importantly, if the relative performance low reached last October can hold, this period of underperformance for broad market stocks will represent one of the longest sustained underperformance periods of the post-war era. The recent era of broad market underperformance has been both lengthy and significant, and crucially, it seems overdue for a turnaround.
Third, broad market targets have once again surpassed the overall market since October 2025, marking the "first" time during the contemporary bull market. Interestingly, while most people still focus on how AI and other "tech stocks" are leading the market, "broad market targets" have quietly outperformed the broad market by one of the largest margins in the past 15 years.
Finally, as shown in Chart 5, since 1950, when the relative broad market total return index is in the lowest two quintiles (like today), the future 1-month average annualized performance of broad market targets surpasses that of the overall S&P 500 index by 1.53% to 2.81%. If broad market targets finally turn the corner, they may continue to outperform the overall S&P 500 for a time.
Final Comments
I am concerned that "defensiveness" in the U.S. stock market seems to have disappeared. Most investors are still more worried about "missing" the next stage of this new era bull market—allegedly led by AI stocks—rather than fearing any significant setbacks in the stock market.
Investors' temporary "intuition test" may be coming soon, led by new era stocks but not necessarily limited to them. My guess is that even if new era stocks do pull back over 20%, a bear market will be avoided. I am not suggesting that investors should sell all tech stocks. I do not expect the upcoming potential volatility to replicate the internet bubble crash. But I would tilt the overall portfolio to a lower exposure position in new era stocks and increase exposure to "broad market targets." Given that broad market targets have been outperforming since last October, even if new era stocks and the overall stock market continue to rise in the coming months, trimming new era stocks may still benefit your overall relative performance.
Thank you for reading! Jimp
Any financial instruments mentioned in this article are speculative in nature and may involve risks to principal and interest. Any prices or levels displayed are historical data or purely indicative data. This material does not consider the specific investment objectives or financial situations, goals, or needs of any specific investor and does not constitute recommendations for specific securities, investment products, or other financial products or strategies. The securities, investment products, other financial products, or strategies discussed in this article may not be suitable for all investors. Recipients of this report must make independent decisions regarding any securities, investment products, or other financial products.
免责声明:本文章仅代表作者个人观点,不代表本平台的立场和观点。本文章仅供信息分享,不构成对任何人的任何投资建议。用户与作者之间的任何争议,与本平台无关。如网页中刊载的文章或图片涉及侵权,请提供相关的权利证明和身份证明发送邮件到support@aicoin.com,本平台相关工作人员将会进行核查。


