Recently, the roller coaster performances of "meme coins" like $MYX, $AIA, and $COAI have not only caused massive losses for countless traders but have also pointed fingers at the clearing mechanisms and risk control capabilities of exchanges. The drastic "pump and dump" tactics reveal a contradiction: exchanges rely on volatility to earn transaction fees, but uncontrolled volatility can deplete insurance funds and even undermine market trust.
This article attempts to speculate from the "first perspective" of exchange risk control, exploring how they maintain a balance between market activity and system solvency. We will analyze how exchanges isolate manipulative behaviors in advance through a tiered monitoring system and advanced quantitative algorithms, such as Open Interest Concentration Ratio (OICR) and Order Flow Toxicity Index (OTSI).
Secondly, for professional traders who wish to survive and profit within this framework, we provide some self-avoidance guidelines: how to monitor their own ADL priority and individual position ratios in real-time to avoid being marked by the risk control system as a "potential liquidator" or "market manipulator" that poses a threat to the exchange. In the wild west of the crypto derivatives market, the secret to survival lies in understanding the rules—and that untouchable bottom line.
Note: This article only speculates on the algorithms of exchanges from an external perspective, without any internal information, for reference purposes only, and is intended for academic exchange, bearing no responsibility.
Part One: The Core Strategic Needs of Exchanges: Balancing Volatility and Solvency
As financial infrastructure providing trading venues and clearing services, the core goal of exchanges is to seek a dynamic balance: maximizing transaction fee income without strictly limiting market volatility, while absolutely ensuring that such volatility does not threaten their solvency and market reputation.
1.1 The "Dual Constraints" and Commercial Demands of Exchanges
1.1.1 Maximizing Transaction Fee Income and Allowing Volatility:
Increased trading volume directly drives transaction fee income. Severe price fluctuations, even those caused by pump and dump (P&D) schemes, attract a large number of speculators, thereby boosting trading volume. Therefore, exchanges do not reject all volatility; they even require a certain degree of speculative activity to maintain market activity.
1.1.2 Avoiding Self-Loss and Systemic Risk:
The insurance fund of an exchange is a safety net for perpetual contract trading. This fund absorbs losses incurred from high-leverage trading liquidations (i.e., when the liquidation price falls below zero or below the bankruptcy price of the counterparty). Once these losses deplete the insurance fund, the exchange will be forced to activate the Auto Deleveraging (ADL) mechanism. The ADL mechanism, due to its nature of punishing winners and closing hedged positions, is a reluctant "democratized" profit and loss balancing model. It is worth noting that the frequent activation of ADL not only affects the reputation of the exchange but also signifies that the insurance fund has been exhausted, as ADL serves as the last line of defense.
1.1.3 Public Pressure and Market Integrity:
P&D events, especially severe crashes occurring in low liquidity assets, can cause significant losses for users, leading to immense public pressure and damaging the exchange's brand reputation. Therefore, exchanges need to proactively isolate manipulative behaviors that could lead to systemic failure, even if they allow a certain degree of speculative volatility.
Conclusion
The bottom line for exchanges is to allow free market play without incurring losses themselves. The goal of the risk control system is not to eliminate all P&Ds but to proactively identify and intervene before P&Ds evolve into a systemic crisis that depletes the insurance fund. Once risk control is triggered, the consequences can range from inquiries and order restrictions to account bans, fund freezes, or even judicial intervention.
1.2 Risk Tiering and Monitoring Weight
In traditional exchange models, we speculate that exchanges should also adopt a tiered governance model to ensure that risk control measures align with the inherent vulnerabilities of contracts. Risk tiering management of contracts should focus monitoring resources on "high-risk contracts" (Tier 1), as manipulators can exert disproportionate influence on prices with relatively little capital in these contracts.
Tiering logic and monitoring weight distribution: (Example)
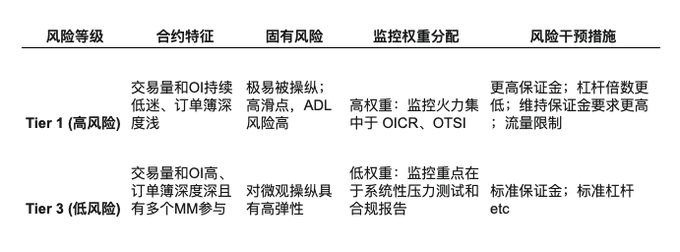
Risk control logic: The higher the risk level of a contract (such as MYX, AIA, COAI, etc.), the greater the likelihood of being targeted by P&D strategies, and once liquidation occurs, the probability of the insurance fund absorbing the liquidation losses due to lack of liquidity is also higher. Therefore, exchanges generally adopt a "high-pressure" monitoring mode for Tier 1 contracts, increasing margin requirements, reducing leverage, and lowering individual account position sizes to mitigate leverage risk, while using high-frequency algorithms and other indicators (such as OTSI) to quickly identify manipulative behaviors, triggering interventions during the risk accumulation period.
Part Two: Monitoring Indicators and Quantitative Algorithms of Exchanges (Risk Control System)
To proactively intervene and curb manipulative behaviors, the risk control system of exchanges deploys multi-layered, high-dimensional algorithms to monitor market behavior. This article will explore three fundamental perspectives: Open Interest Concentration Ratio (OICR) during the accumulation phase of P&D, Basis Anomalies (Structural Pressure), and Order Flow Toxicity (High-Frequency Manipulation).
2.1 Algorithm Indicator 1: Open Interest Concentration Ratio and Accumulation Detection (OICR)
The core concern of exchanges is "disproportionate control of the market by a single entity." Therefore, monitoring the concentration of open contracts is crucial.
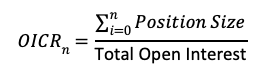
Indicator: Open Interest Concentration Ratio (OICR)
OICR measures the total position of top trading entities (e.g., the top 5 or top 10 accounts) as a percentage of the total open interest (OI) of that contract.
Quantitative alert example (Tier 1 contract):
Scenario: The total open interest (OI) for a certain Tier 1 contract is 1 million contracts. After identifying related accounts, it is found that the top three accounts quietly accumulated 750,000 contracts in the past 24 hours.
Calculation and alert: OICR = 75%. If the internal alert threshold set by the exchange for this contract is OICR > 60%, the system will immediately trigger a "concentration accumulation" alert. This marks the end of the P&D accumulation phase, and potential pump behavior is about to begin.
It is worth noting that even dispersed account holdings can be flagged if they exhibit similar trading tactics, funding sources, etc.
2.2 Algorithm Indicator 2: Order Flow Toxicity Detection (OTSI)
Spoofing is one of the core tactics during the execution phase of P&D, where large orders are submitted with the intention of canceling them before execution, creating false liquidity and demand. The exchange's system identifies this "toxicity" by analyzing the efficiency of order flow.
Indicator: Order to Trade Ratio (OTR)
OTR measures the total number of submitted and canceled orders against the actual executed trades. An excessively high OTR is one of the key indicators of spoofing.
OTR = Total Order Submissions and Cancellations / Total Executed Trades
It is important to note that spoofing is generally accompanied by a large amount of wash trading, creating a trend of inflated prices and trading volumes.
Quantitative alert example (high-frequency account):
Scenario: Within one minute during a period of high volatility, a high-frequency trading account submitted and canceled 400,000 orders but executed only 80 trades.
Calculation and alert: OTR = 400,000 / 80 = 5,000. If the average OTR for legitimate market makers of that contract is below 500, the system will trigger a "toxic order flow" alert for that account, as its OTR far exceeds the average. This may lead to the system immediately imposing traffic restrictions on the order submission rate of that account. (Data is for example only, do not take seriously)
2.3 Algorithm Indicator 3: Spot-Futures Basis Anomaly Detector (SFBAD)
Exchanges need to prevent extreme price dislocations from triggering large-scale liquidations. The basis (Futures Price - Spot Price) reflects market sentiment and arbitrage efficiency.
Indicator: Standardized Basis Deviation (SBD)
Calculates how many standard deviations the current basis deviates from its long-term (e.g., 30-day rolling) average.
Quantitative alert example:
Scenario: The average basis (Premium) for a certain Tier 1 contract is +0.2%. However, during a pump, due to manipulators concentrating their buying in the futures market, the basis suddenly spikes to +6.0% (extremely high premium).
Calculation and alert: If this 6% basis statistically corresponds to a deviation of 5 standard deviations from the average (SBD > 3.0), and this deviation persists for 15 minutes, the system will issue a "structural pressure" alert. This indicates that price dislocation (usually driven by speculation or manipulation) may lead to significant liquidations and signals the risk of a crash. (Data is for example only, do not take seriously)
Part Three: Self-Avoidance Strategies for Project Traders: Quantitative Indicators and the Path to Survival
For professional traders or project teams, the most important thing is to avoid being marked by the exchange's risk control system as a threat to system solvency and market integrity. This requires traders to master a set of "anti-risk control" self-monitoring indicators, with a few common indicators explained below.
3.1 Core Risk 1: Systemic Solvency Risk (Insurance Fund and ADL)
The exchange's insurance fund is a buffer covering liquidation losses. Traders must view the health of the insurance fund as a systemic risk affecting their trading safety.
Trader's quantitative avoidance strategies:
3.1.1 Monitor ADL Priority: This is the most direct risk indicator for traders. Exchanges typically provide real-time levels for this indicator (e.g., Level 5). The higher the level, the greater the risk of forced liquidation when ADL is activated, which should be avoided from the perspective of who profits being the biggest suspect.
ADL Priority = Profit Percentage / Effective Leverage
Avoidance action: Traders must proactively partially liquidate positions when the ADL level reaches a high point (e.g., 4/5 or 5/5). This will lower the "profit percentage," thereby bringing their ADL priority down to a safe zone (e.g., 2/5).
3.1.2 Pay attention to insurance fund dynamics: Monitor the balance of the insurance fund for the trading pair and the exchange announcements for similar trading pairs to gauge policy direction. Traders should view this as a macro indicator of systemic pressure. Any sharp decline in fund balance should be seen as a systemic risk alert, indicating that ADL risk is rising.
3.1.3 Avoid high leverage: Exchanges have higher margin and risk control requirements for low liquidity contracts (Tier 1). Traders should increase margin to dilute effective leverage, reducing the risk of being targeted by the system during severe market fluctuations.
3.2 Core Risk 2: Concentrated Control and Manipulation Risk (IOIR)
Traders must avoid allowing any single or related account's position size to exert dominant influence over the contract, especially in low liquidity contracts.
Trader's quantitative avoidance strategies:
Self-Calculating IOIR: Individual Open Interest Ratio
IOIR = Your Position Size / Total Contract Open Interest (OI)
Avoidance Goal: In high-risk (Tier 1) contracts, strive to keep the account's IOIR below n% to avoid triggering the exchange's internal "Large Trader Report / Concentration Alert." If the capital amount is large, positions should be diversified to avoid rapid, concentrated accumulation of OI within a short period.
3.3 Core Risk 3: Order Flow Toxicity (OTR)
Traders must ensure that their algorithms and trading patterns align with legitimate market maker behavior, rather than matching the characteristics of spoofing manipulation.
Trader's Quantitative Avoidance Strategies:
- Monitor OTR: Continuously monitor the OTR of your own account. While legitimate market makers (providing liquidity) may have a high OTR, their order submission and cancellation patterns are often balanced and bidirectional.
- Avoidance Patterns: Strictly prohibit executing the following patterns that are marked as manipulative:
- One-Sided Spikes: OTR shows one-sided, extreme spikes, such as submitting a large number of orders on the buy side but immediately canceling buy orders after trading on the sell side.
- Liquidity Vacuum: Avoid operations that cause one side of the order book to collapse rapidly within seconds (depth collapse exceeding 70%). This will be flagged by the system as creating a "liquidity vacuum," which is a strong signal of manipulation.
It is important to note that the above indicators are just some conventional quantitative metrics. If you have not yet established the above self-monitoring, please think twice.
I forgot where I heard this joke:
Since you are doing something as risky as snatching food from a tiger's mouth, you must be prepared to return it perfectly.
In the end, I suggest you take a look, but I do not recommend you to operate.
May we always hold a heart of reverence for the market.
免责声明:本文章仅代表作者个人观点,不代表本平台的立场和观点。本文章仅供信息分享,不构成对任何人的任何投资建议。用户与作者之间的任何争议,与本平台无关。如网页中刊载的文章或图片涉及侵权,请提供相关的权利证明和身份证明发送邮件到support@aicoin.com,本平台相关工作人员将会进行核查。


