Author: RootData Research

Research Scope and Statistical Methods: The exchange sample includes Binance, OKX, Bitget, Bybit, Gate, MEXC, KuCoin, and HTX. The subjects of the study are stock and ETF perpetual contracts priced or settled in stablecoins such as USDT and USDC. The sample of tokenized issuers includes Ondo, xStocks, bStocks, Reality, and Robinhood Stock Tokens.
Core Conclusions
From August to October 2026, the trading volume of stock derivatives on mainstream platforms initially fell and then rose, while open interest and market depth continued to expand. The average daily trading volume decreased from $23.36 billion in August to $17.04 billion in September, then rebounded to $19.81 billion in October, still not recovering to August levels.
Binance led in trading and open interest scale but did not establish an absolute advantage in trading quality across multiple dimensions, while other mainstream trading platforms showed different advantages: OKX ranked second in both trading scale and price difference, and Bitget had the highest ±2% depth. Market competition is differentiating around scale, product coverage, and liquidity.
Tokenized stock spot trading shows significant product differences in trading channels, dividend processing, and information disclosure. The positioning of the five issuers varies: Ondo, bStocks, and xStocks lead in asset scale, while Reality has the broadest product coverage and most diversified execution methods. Industry competition is shifting from expanding coverage to continuous conversion of holding and transaction.
Market Overview and Demand Structure
In the third quarter of 2026, the global stock market repeatedly adjusted between profit growth and macro tightening. The Federal Reserve raised interest rates by 25 basis points to 3.75% to 4.00% in September, maintained the interest rate in October, but there were still expectations for another rate hike in December, making the interest rate path a core variable in the fourth quarter. At the industry level, AI storage demand and product price increases supported the market for storage stocks like SNDK and MU; however, concerns over AI capital expenditure returns intensified after October, leading to increased volatility in tech stocks.
Looking ahead to the fourth quarter, the U.S. midterm elections, the Anthropic IPO, and OpenAI's postponed listing expectations until 2027 may continue to affect tech stock valuations and trading hotspots.
In this context, it is necessary to outline the trading scale, competitive landscape, and liquidity of crypto trading platform stock derivatives and tokenized stock spots, assessing the ability of each platform to accommodate new asset and event-driven trading demands.
Stock Derivative Market
1.1 Trading Volume Scale and Peak
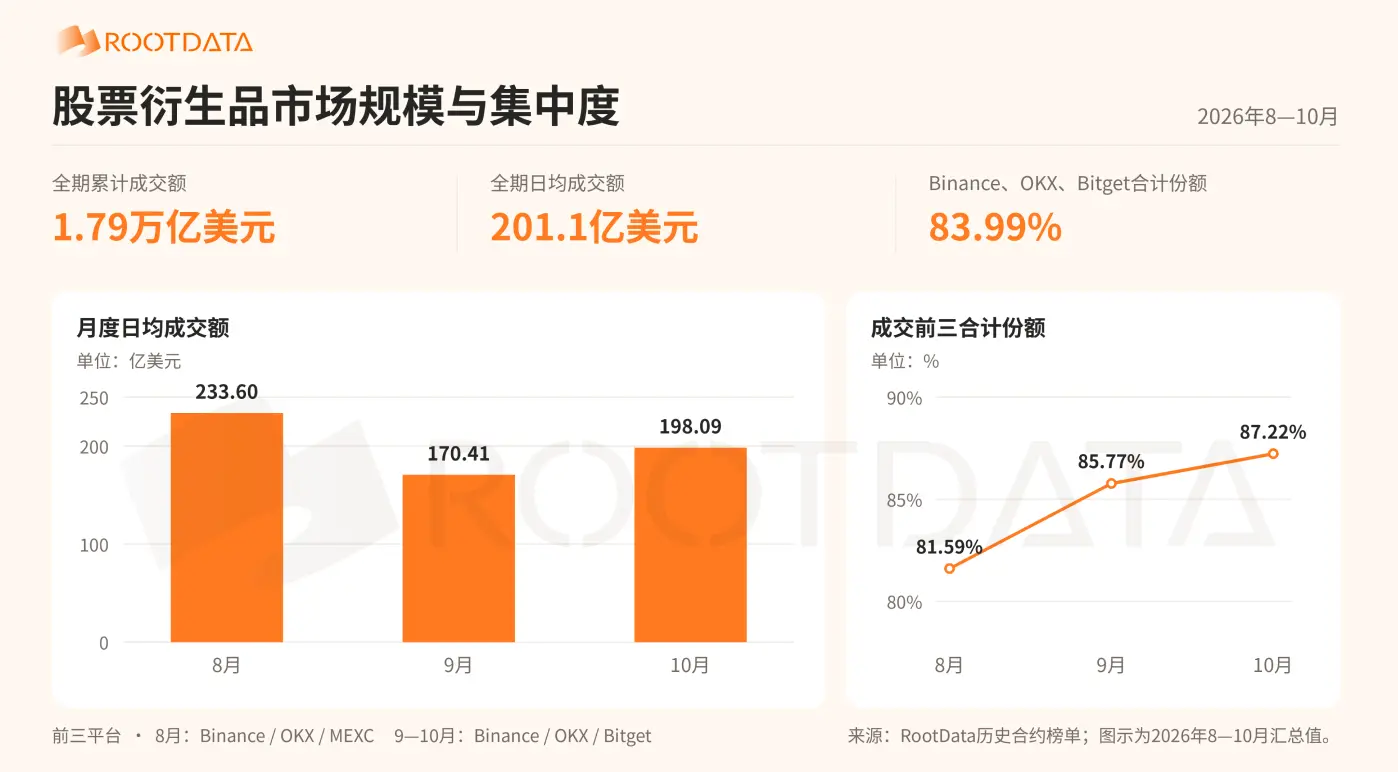
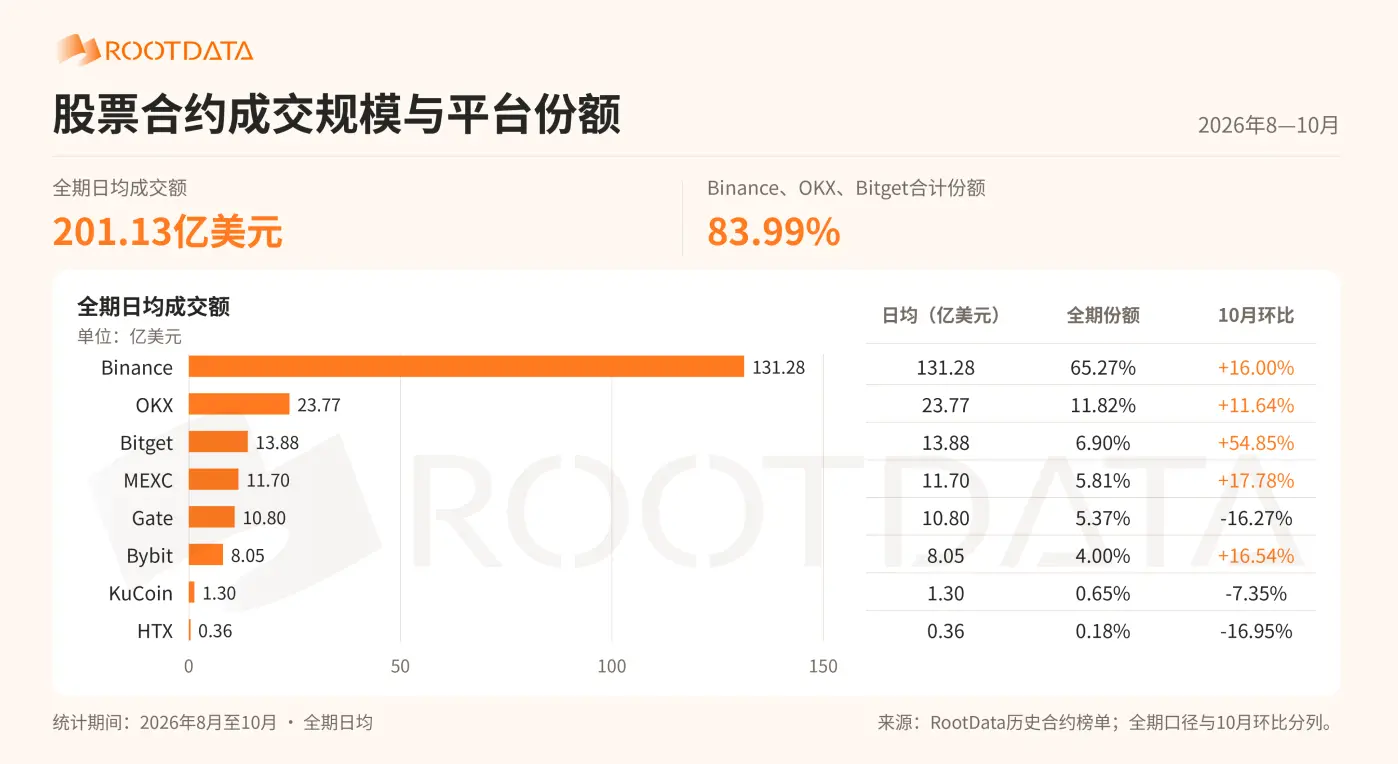
From August to October 2026, the trading volume of stock derivatives on eight mainstream platforms was approximately $1.79 trillion, with an average daily trading volume of $20.11 billion. Trading was primarily concentrated on leading platforms, with Binance, OKX, and Bitget collectively accounting for 83.99% of the trading share.
From a monthly trend perspective, the market trading scale contracted in September and recovered in October, with an increase of 16.24% in the average daily trading volume in October compared to September, though it still remained below August levels. From a concentration trend perspective, the combined trading share of the top three platforms increased from 81.59% to 87.22%, indicating further concentration of trading towards leading platforms.
1.2 Open Interest Scale, ±2% Depth and Peaks
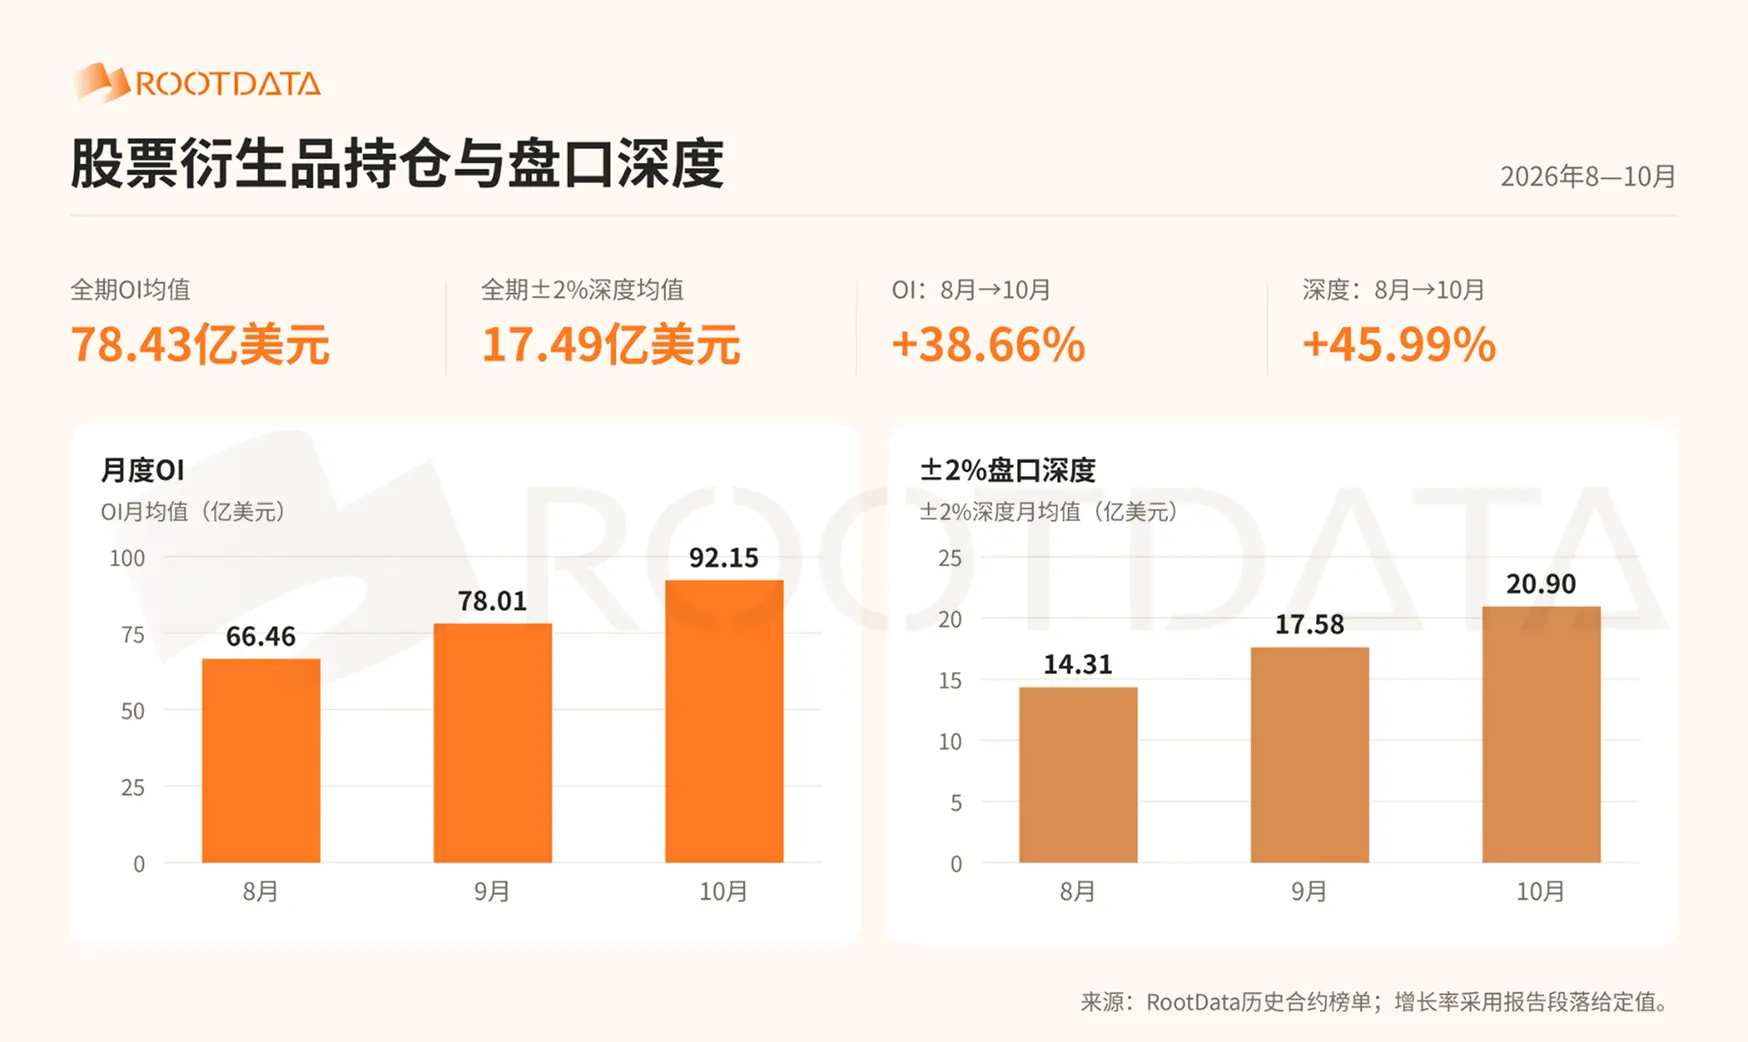
From August to October, the average daily open interest (OI) for the eight mainstream platforms was approximately $7.84 billion, with a total average of ±2% market depth measuring $1.75 billion. Compared with the initial decrease and subsequent increase in trading volume, the open interest and market depth consistently grew, showing more sustained expansion.
In October, the average daily OI reached $9.21 billion, an increase of 38.66% compared to August; the daily average of ±2% market depth reached $2.09 billion, an increase of 45.99%. During the trading contraction in September, open interest and pending orders still increased, indicating that funds did not leave the market en masse, with traders shifting more from short-term turnover to holding positions, and market-making and order supply also maintained expansion, ensuring that the liquidity foundation on the platforms was not affected by the trading contraction, potentially supporting the trading recovery in October.
1.3 Popular Stocks and ETF Contracts
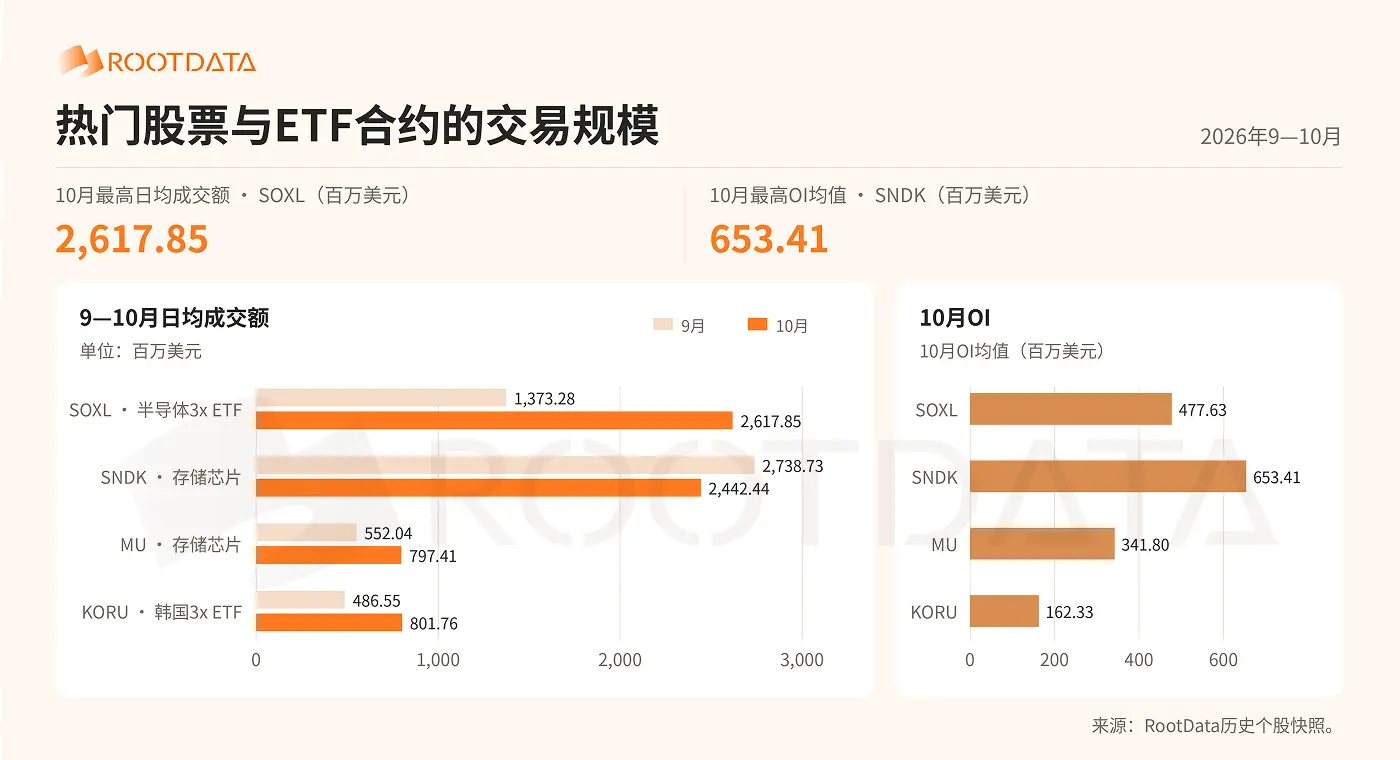
From September to October, trading in individual stocks was mainly concentrated in semiconductors, storage, and leveraged ETFs. SOXL and SNDK had average daily trading volumes of approximately $2.618 billion and $2.442 billion, making them the most popular stock assets on the eight sample platforms.
Tokenized Stock Spot Market
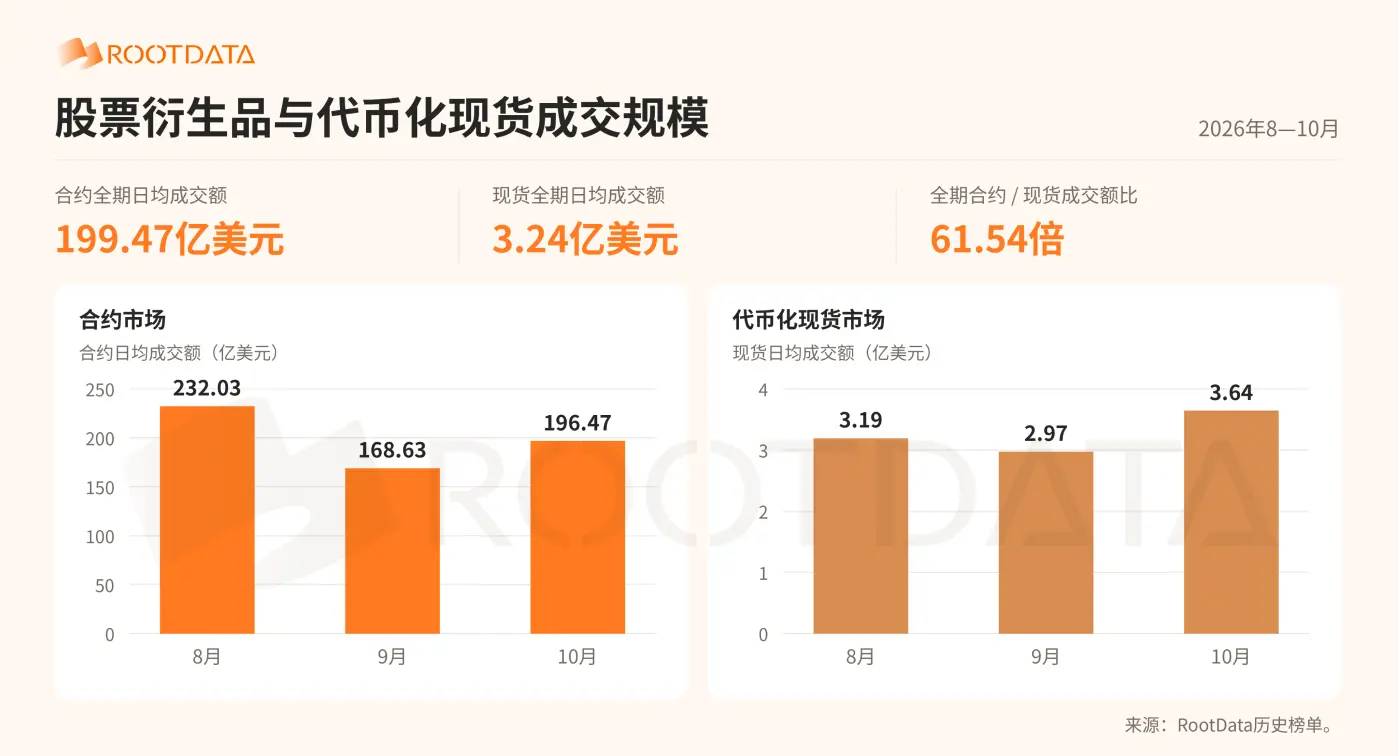
From August to October, the five mainstream tokenized stock issuance platforms had an average daily trading volume of roughly $324 million in spot trading, while the average daily trading volume of stock derivatives on the same platforms was approximately $19.947 billion, about 61.5 times that of the spot trading. Stock derivatives remain the main trading market.
Moreover, the concentration of contract trading was higher. The top three platforms for contract trading—Binance, OKX, and Bitget—accounted for 83.99% collectively; the top three platforms for spot trading—Binance, OKX, and Gate—accounted for 78.25%, indicating a relatively dispersed trading distribution.
However, in October, the average daily trading volume of spot trading reached $364 million, reflecting a 22.72% month-over-month increase, with a recovery speed higher than that of the contract market, narrowing the gap in trading scale between contracts and spots.
Exchange Competitive Landscape
Stock Derivatives
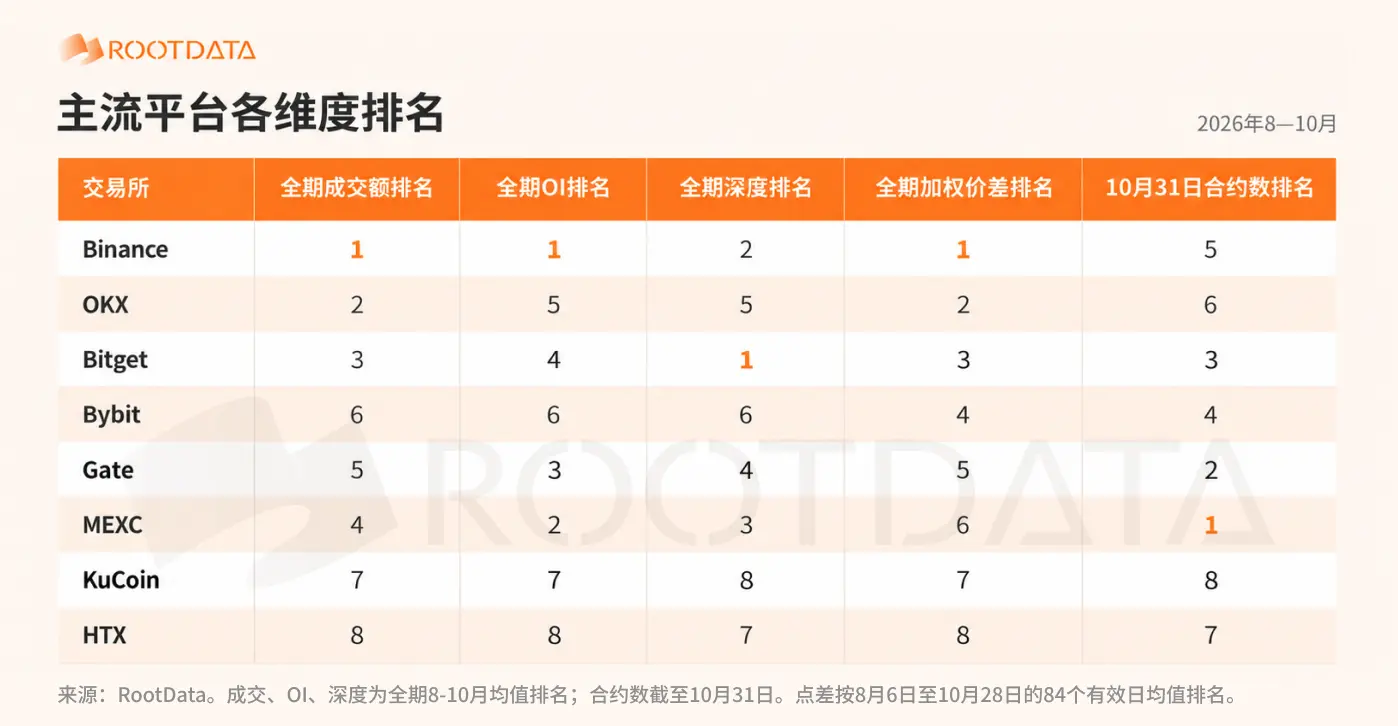
From August to October, the leading positions of mainstream platforms varied across different dimensions. Binance ranked first in both average daily trading volume and OI; Bitget had the highest average ±2% depth; OKX maintained second place in trading scale and weighted price difference; MEXC ranked second in OI scale and had the most stock derivative listings.
Trading volume, open interest, product coverage, and trading quality each exhibit different competitive landscapes. The following section will analyze the scale, growth, and liquidity performance of each platform based on overall rankings and monthly changes.
1.1 Trading Scale: Trading Volume and Market Share
The trading scale shows a clear concentration among the top players. From August to October, Binance had an average daily trading volume of $13.128 billion, claiming a market share of 65.27%; OKX and Bitget ranked second and third with $2.377 billion and $1.388 billion, respectively. MEXC, Gate, and Bybit ranked fourth to sixth, while KuCoin and HTX accounted for less than 1% of the market share.
The recovery pace among platforms in October varied. Bitget had the highest month-over-month growth rate in trading volume at 54.85%, with MEXC and Bybit also showing a rebound. Binance not only maintained the largest scale in trading volume but also further increased its market share.
Open Interest Scale and Share
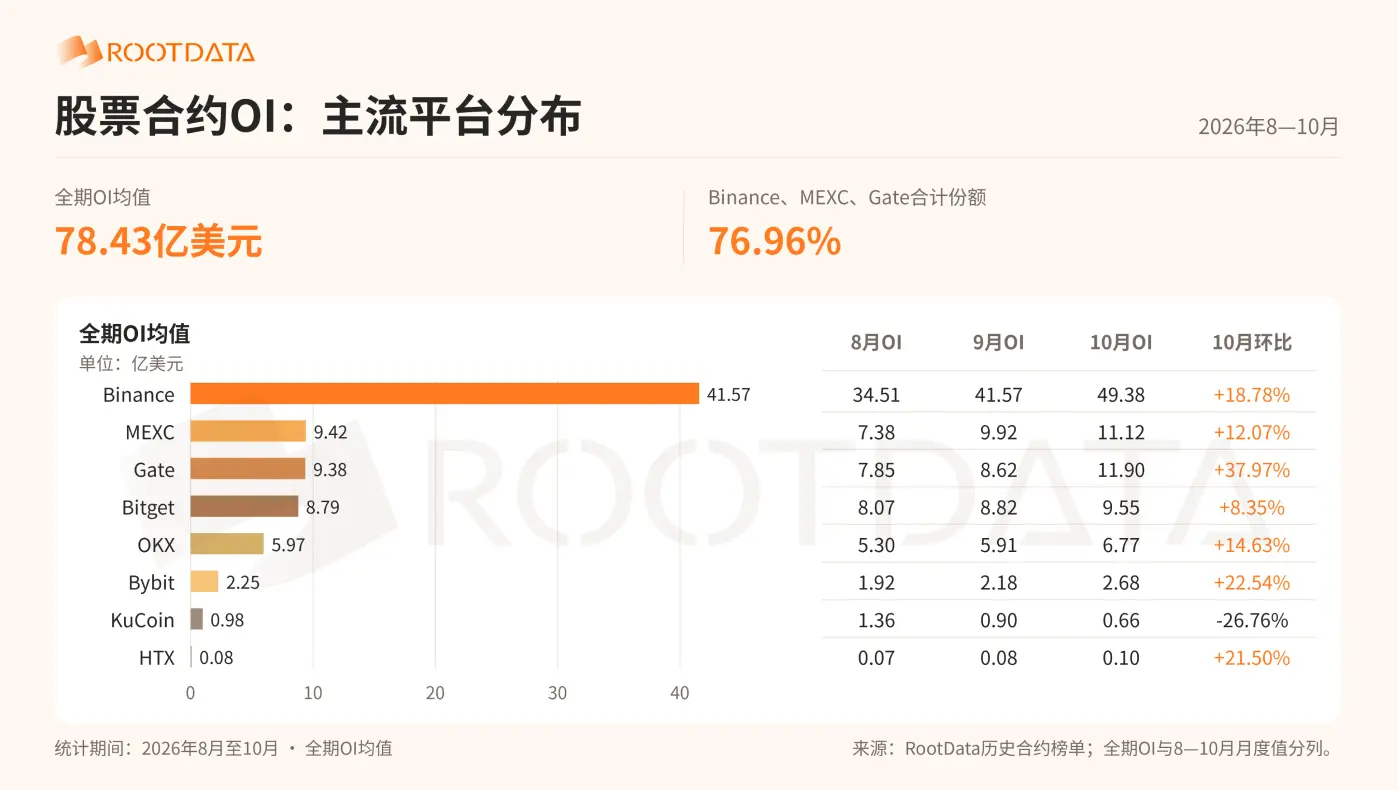
The open interest data in stock derivatives is dominated by Binance. From August to October, Binance's average OI was $4.157 billion, capturing over half of the market share. Bitget, Gate, and MEXC had OI shares close to each other, all in the range of 11% to 12%; OKX stood at 7.61%, in the mid-range; while Bybit, KuCoin, and HTX had relatively low OI shares, ranging from 0.1% to 3%.
1.2 Trading Quality: Market Depth
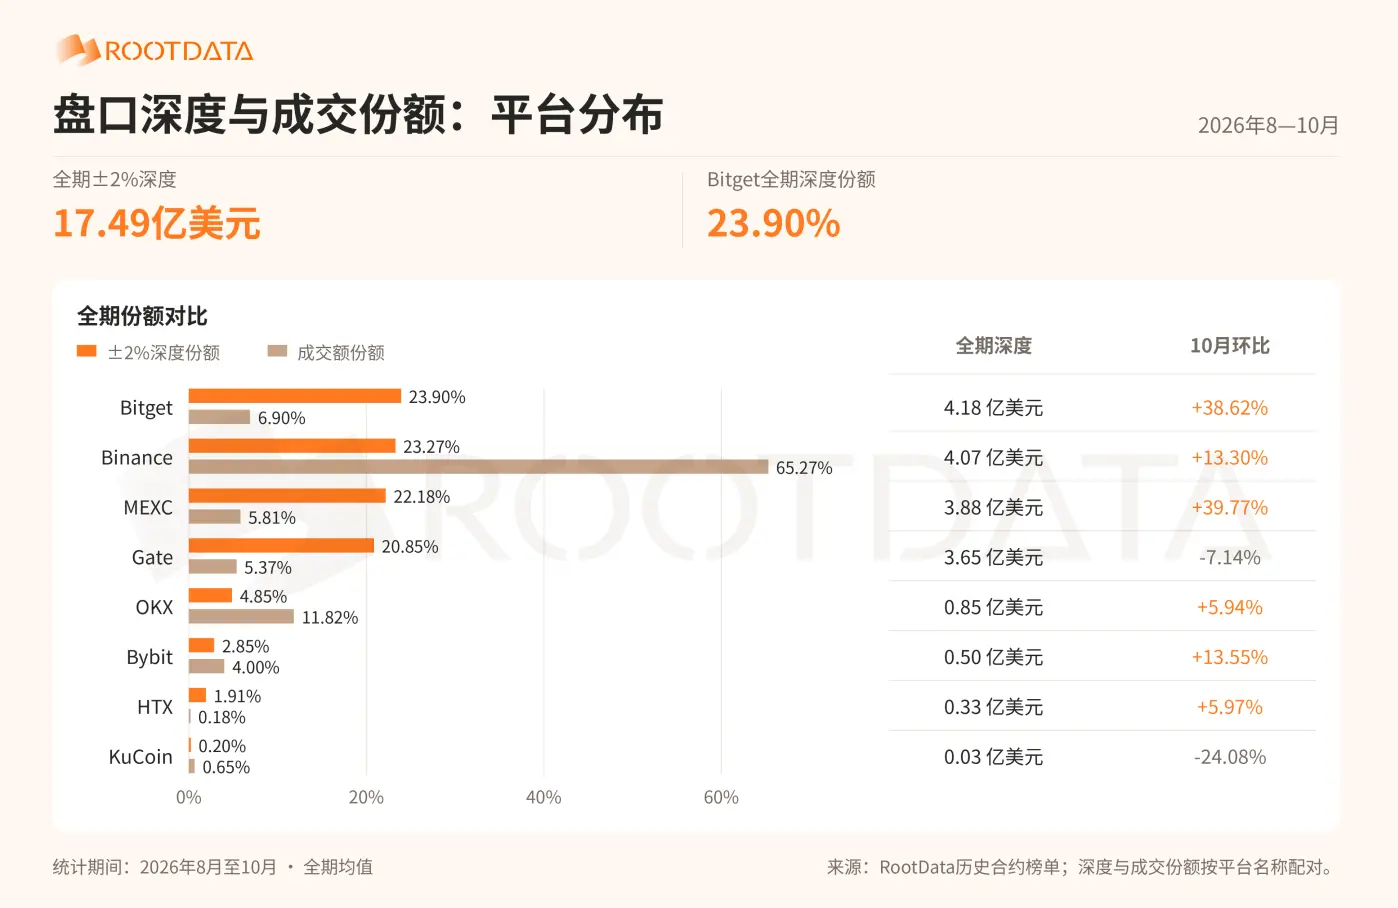
From August to October, while both trading volume and OI scale were lower than Binance, Bitget's average ±2% depth reached $418 million, slightly exceeding Binance's $407 million, ranking first among the eight platforms. Additionally, Bitget had a depth share of 23.90%, indicating a larger visible order volume within the ±2% range, showcasing its strong competitiveness in providing market liquidity.
Weighted Price Difference
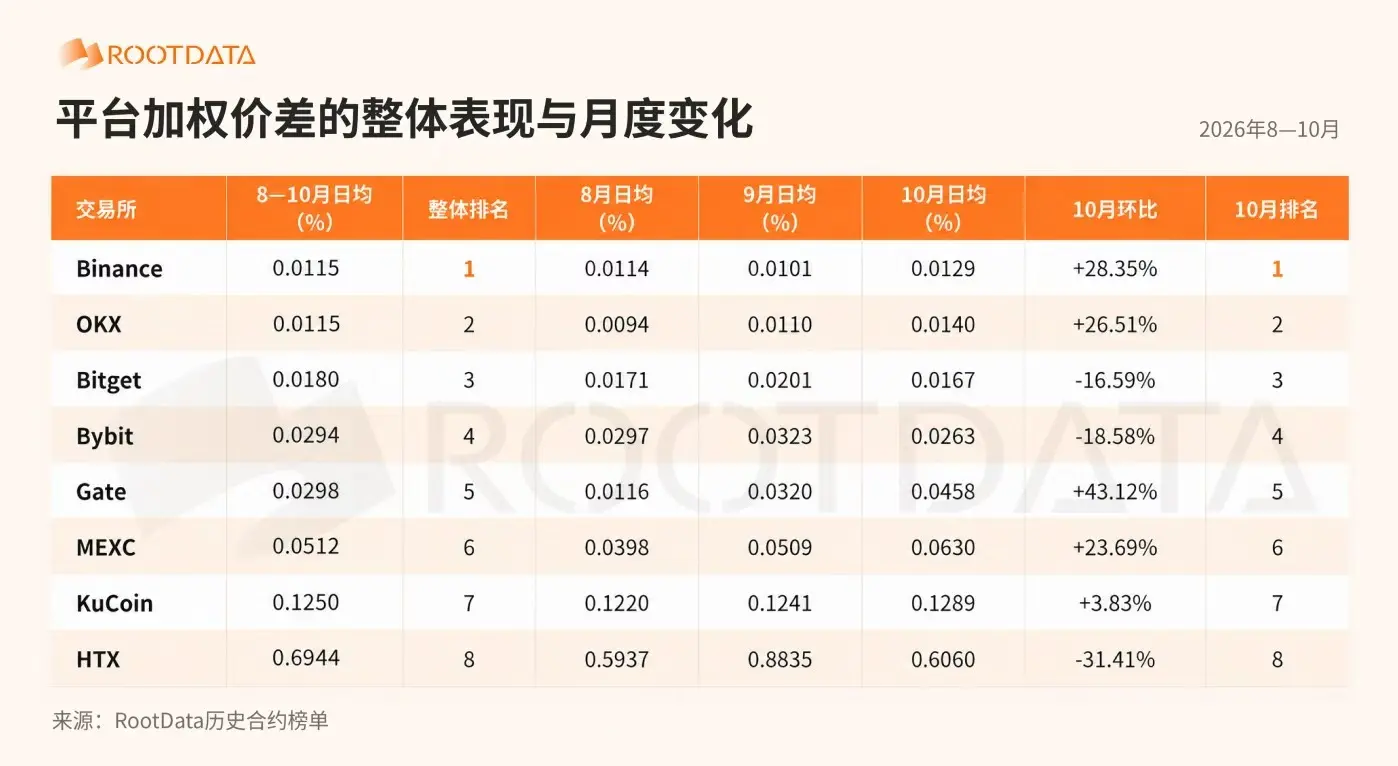
Binance and OKX maintain a leading position in terms of price difference. From August to October, both had an average daily weighted price difference of 0.0115%, with Bitget ranking third at 0.018% and Bybit fourth.
In October, the price differences for Bitget and Bybit narrowed by 16.59% and 18.58%, respectively, indicating an improvement in platform trading costs. Although Binance and OKX saw an increase compared to September, they still maintained the smallest price differences. HTX had the largest narrowing, but its absolute price difference remained significantly higher than other platforms.
Tokenized Stock Spot
In the tokenized stock products, AUM (assets under management) reflects the scale of issued assets, while the number of products reflects coverage. This section compares the product information of Ondo, bStocks, xStocks, Reality, and Robinhood Stocks across coverage, asset scale, trading mechanisms, and corporate governance.
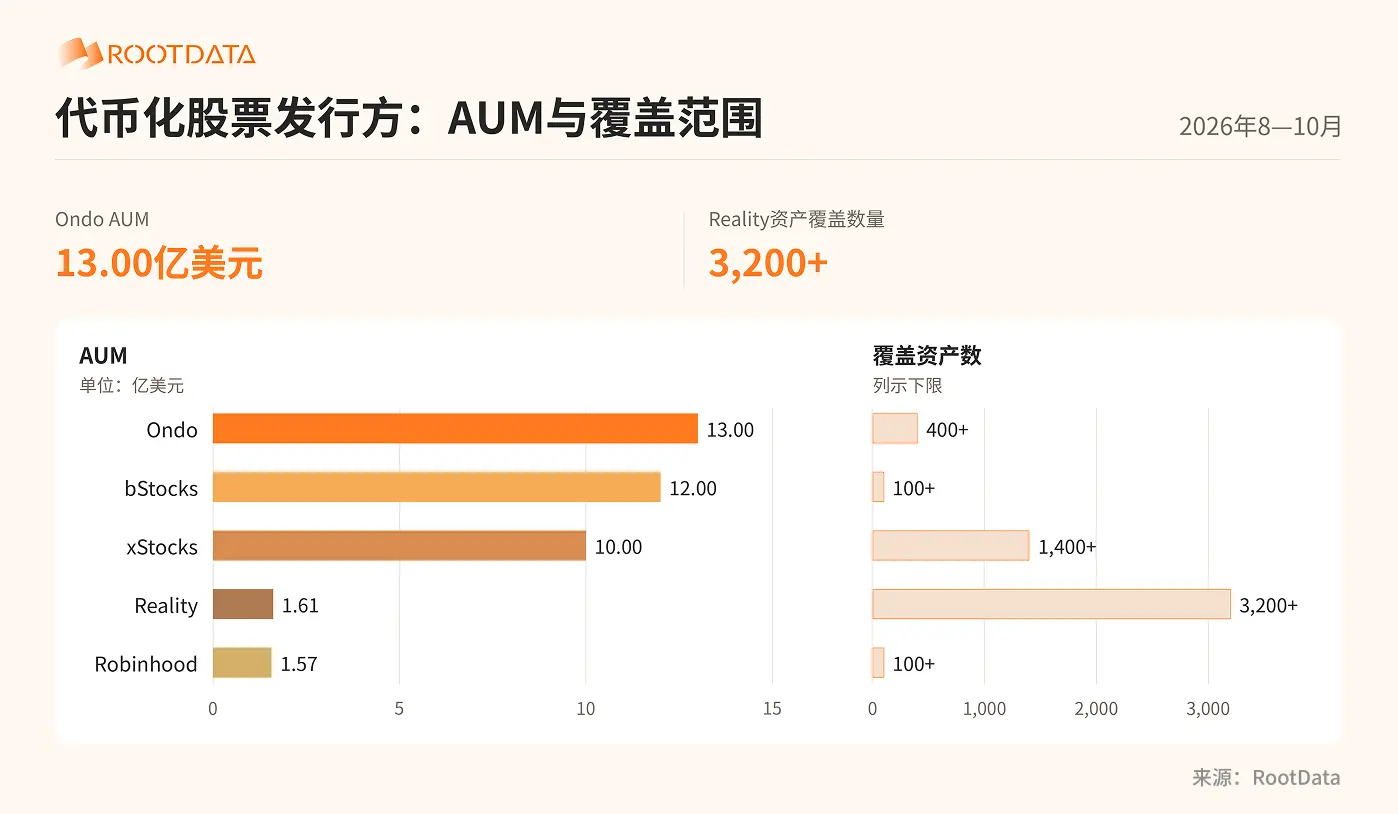
The five products each emphasize different aspects of asset scale and coverage. According to the listed data, Ondo, bStocks, and xStocks have AUMs of $1.3 billion, $1.2 billion, and $1 billion, leading in fund scale; Reality and Robinhood have AUMs of $161 million and $157 million, closely following behind. Among them, Reality is characterized by its broader coverage, with assets covering over 3,200 items, significantly higher than the other four; Robinhood mainly relies on its user base for distribution.
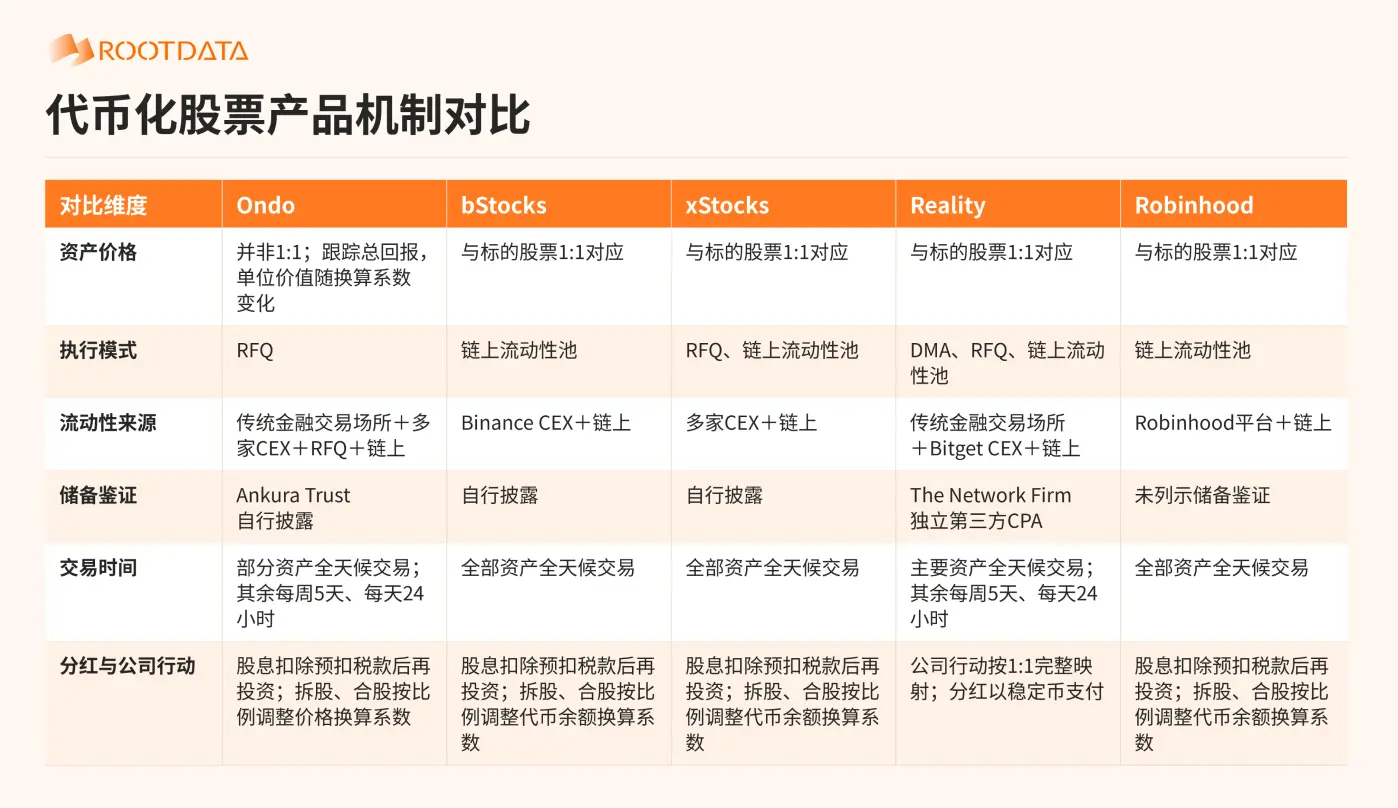
Trading channels are also an important distinction. Reality simultaneously provides three execution methods: DMA (direct market access, where orders directly enter traditional financial trading venues for matching), RFQ (request for quote, where traders receive quotes from market makers before execution), and on-chain liquidity pools, with liquidity sourced from traditional financial trading venues, Bitget CEX, and on-chain; Ondo and xStocks distribute through multiple CEX and on-chain channels, while bStocks and Robinhood respectively rely on Binance and Robinhood platforms, along with on-chain channels. The liquidity sources of the five range from “traditional trading venues + CEX + on-chain” to single platforms, with channel structures directly impacting the range of accessible funds.
In terms of dividend processing, the five have formed two holding experiences: “cash dividends” and “automatic reinvestment.” Reality directly pays dividends in stablecoins to holders, allowing investors to freely manage cash flow. The other four automatically reinvest after-tax dividends, eliminating manual operations but lacking direct cash distribution, making the former more favorable to investors needing cash distribution.
Regarding information disclosure, Reality provides reserve verification issued by independent third-party CPAs, ensuring reserve transparency is externally validated; Ondo, xStocks, and bStocks mainly rely on self-disclosure, while Robinhood has not listed any reserve verification arrangements.
As for trading times, xStocks, bStocks, and Robinhood support all-day trading for all assets; Reality and Ondo's main assets support 7x24 hours trading, while other assets are available for trading 24 hours a day, five days a week, with trading hours needing to be differentiated based on specific assets.
Overall, no single product is comprehensively leading across all dimensions; the differences essentially stem from varying product routes: Ondo, bStocks, and xStocks focus on asset scale, deepening stock through multiple CEX or channels like Binance; Reality, on the other hand, has chosen a different path, making discernible distinctions from counterparts in coverage breadth and mechanism design, with asset coverage exceeding 3,200 items, parallel DMA and RFQ methodologies, cash payments of dividends in stablecoins, and providing independent third-party CPA verification. For Reality, it has initially accumulated market share via the Bitget exchange channel, aligning closely with the actual U.S. stock trading experience, creating its own recognizability; yet whether this product breadth can ultimately translate into sustained trading and open interest still requires further data validation.
Q4 Outlook and Competitive Evolution
The U.S. midterm elections are an important observation point for subsequent policy expectations. More closely monitored will be how post-election taxation, trade, and tech regulation arrangements advance, and whether businesses adjust their investment and profit guidance accordingly. For crypto stock platforms, the ability to maintain quotes and reasonable price differences during events will be more distinguishing than liquidity rankings during stable periods.
The stock derivative market has formed different competitive advantages. Binance dominates trading and open interest scale, with OKX ranking second in trading volume and price difference. Bitget ranks first in market depth and is generally among the top three across most comparison indicators, demonstrating relatively balanced performance.
Platforms expanding products quickly also face different challenges regarding trading quality. MEXC has the highest number of contracts and ranks second in OI but is sixth in price difference; Gate ranks second and third in contract quantity and OI respectively, but saw a decrease in trading volume in October. Bybit had the highest increase in contract numbers during the period, yet still ranks sixth in trading volume, OI, and depth. Currently, KuCoin and HTX have relatively small trading shares and larger price differences, and their changes in product coverage and trading activity should be noted moving forward.
In the next phase, the competitive focus may shift from the quantity of new listings to the sustained trading of new assets and quoting capability during market fluctuations. MEXC, Gate, and Bybit need to observe whether product expansions can drive growth in trading and open interest; Bitget needs to watch if depth advantages can translate into higher trading shares; while Binance and OKX need to ensure they can maintain scale and quoting advantages during trading of popular stocks and during non-U.S. stock trading hours. Future monitoring should focus on trading of new assets, OI retention, and changes in depth and price differences during events.
Data Explanation and References
The data covers the period from August 1 to October 31, 2026, sourced from RootData contracts, spot rankings, and historical snapshots. Monthly averages and overall period averages are calculated by summing the effective daily values for each platform and dividing by the number of effective days, without filling in absent dates with zeros; cross-platform averages for markets and individual stocks are the sum of platform averages. The trading volume reflects the rolling value for each day over 24 hours, with October representing the average within the month up to the 31st, rounded figures may result in discrepancies.
[S1] Ondo Stocks product operation and reserve verification explanation
[S2] xStocks official FAQ and company action explanation
[S3] Binance bStocks official FAQ
[S4] Bitget rToken FAQ and trading time and company action explanation
[S5] Bitget Reality product and development documentation
[S6] Robinhood Chain Stock Tokens documentation and Classic product description
[S6a] Robinhood Classic Stock Tokens product description
[S7] FEC 2026 U.S. federal election dates
This report is for research reference only and does not constitute investment advice.
免责声明:本文章仅代表作者个人观点,不代表本平台的立场和观点。本文章仅供信息分享,不构成对任何人的任何投资建议。用户与作者之间的任何争议,与本平台无关。如网页中刊载的文章或图片涉及侵权,请提供相关的权利证明和身份证明发送邮件到[email protected],本平台相关工作人员将会进行核查。


