Author: BIT Securities Channel

CoreWeave’s revenue skyrocketed by 168% in the third quarter, with adjusted operating profit margin rising to 10%, and its stock price surged 24.7% in a single day; however, the yield on unsecured bonds once approached 15%. From renewing old GPUs, customer prepayments to project financing, let's see how much of the $133 billion in orders can actually translate into shareholder cash flow.
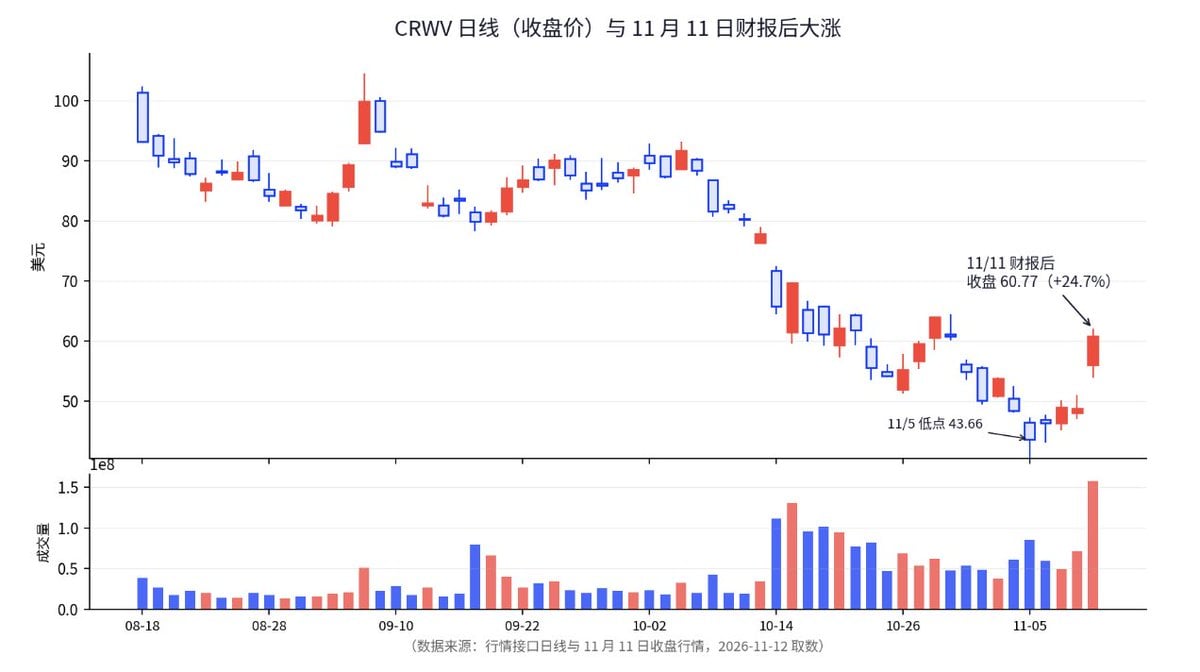
The $133 billion in orders and around 15% bond yield are both associated with the same company.
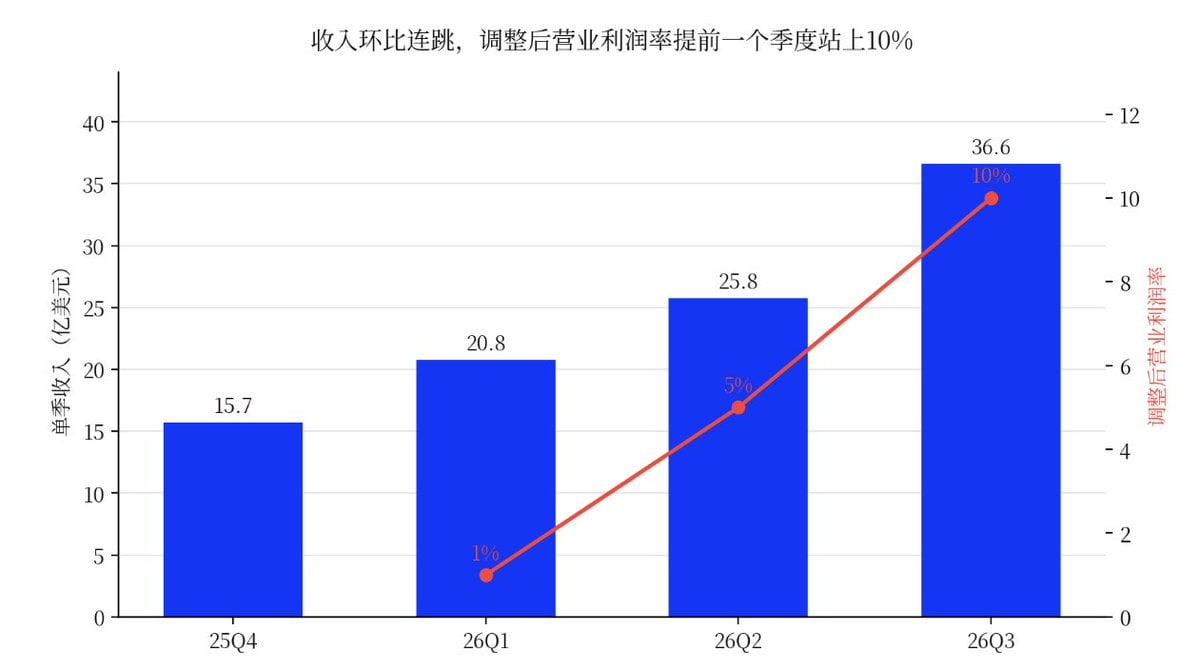
After the market closed on November 10, CoreWeave delivered its strongest quarterly report since going public, with third-quarter revenue of $3.661 billion, up 168% year-on-year, exceeding the upper guidance.
On November 11, the stock closed at $60.77, up 24.7% from the previous close, reaching a high of $62.03 during the day, with a trading volume of 158 million shares, nearly four times the average daily trading volume for the previous three months.
As of the evening of November 11, Eastern Time, it fell back to around $57. But just a month before this earnings report was released, the company’s unsecured bonds had dropped to 79.5 cents, with a yield approaching 15.2% (according to public reports).
The market in the past month has highlighted this disparity to the extreme.
From the early October closing high of $91.72 to the November 5 low of $43.66, there was more than a 50% retracement, with a single-day drop of about 15% on October 14, followed by another drop of about 12% the next day, during which unsecured bonds fell to 79.5 cents.
On the first trading day after the earnings report on November 11, it closed at $60.77, up 24.7% in a single day, with trading volume expanding to nearly four times the average of the past three months. Stocks and bonds gave two directions at the same time; the following content aims to disentangle these two directions and see what they are pricing individually.
A 15% bond yield simply means that the market is worried about three things: First, I don't really believe you can comfortably make it through the debt maturity in 2027. Second, even if you do make it, I'm worried you won't be able to borrow cheap money by then.
Third, if you really fail, I am last in line and getting back three or four points would be good. Altogether, these three statements equate to 15%.
The stock is up because of good performance; the bond is not rising because even with good performance, it can’t save you from lacking money before 2027.
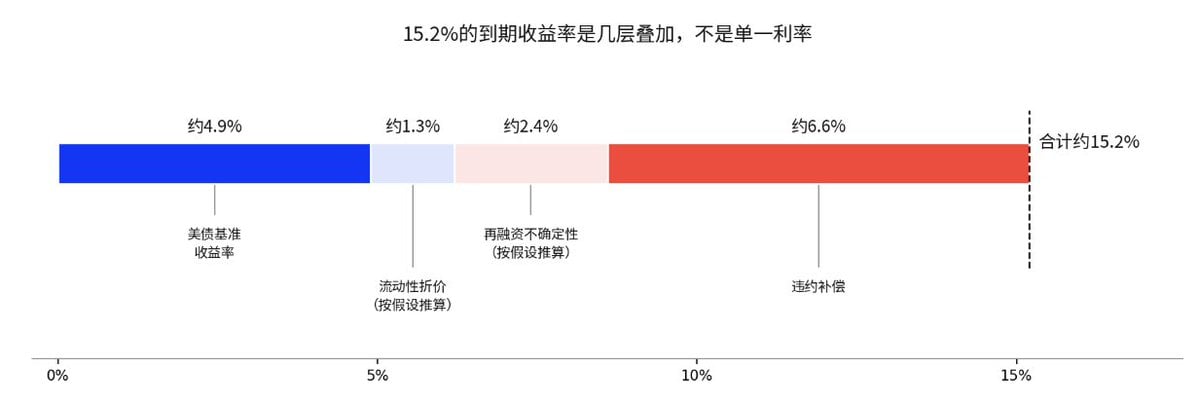
In detail, 15.2% is not just a rate; it is a combination of several factors. At the bottom is the benchmark yield on U.S. treasuries, which on November 10 briefly exceeded 5% for 10-year notes (according to public reports).
On top of that is the credit spread, totaling approximately 10.3 percentage points, with default compensation making up the majority, while uncertainty around refinancing and liquidity discounts account for a smaller portion (the hierarchy is broken down based on hypothetical calculations).
The bond market expresses with this 15% something unrelated to the profit margin: when those debts due around 2027 are refinanced, who holds the pricing power.
This is also the reason Nebius's quarterly report deserves to be looked at in advance. Both companies are selling AI computing power, but one relies more on self-financing to buy GPUs, while the other emphasizes customer prepayments and commitments from investment-grade clients. Nebius’s earnings report just happens to fall on the same day this article is published; it serves as a direct experimental comparison for everyone.
CoreWeave Delivers Impressive Results: Revenue Skyrockets, Profit Margin Hits 10%
Third-quarter revenue of $3.661 billion, up 168% year-on-year, but what really changed market expectations was the profit margin.
Adjusted operating profit margin rose from about 1% in Q1 and 5% in Q2 to 10%. Management stated that a low double-digit profit margin was achieved one quarter ahead of initial plans.
Pricing has increased simultaneously, with an approximate 25% price hike across all products in July, and an additional increase of about 10% within the quarter. Long-term contracts for four to five years have new signed prices up to $20 million to $25 million per megawatt per year, with short contracts exceeding $40 million.
The rise in profit margin has two sources: one is the price increase of new contracts, the other, often overlooked, is the renewal of old computing power.
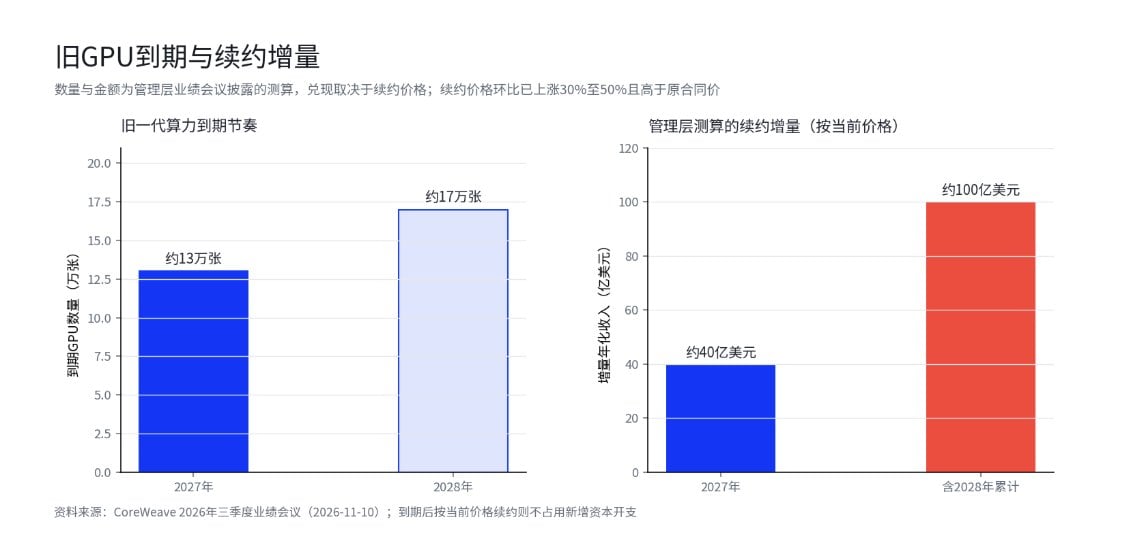
Management disclosed that the renewal prices for the previous generation of computing power increased 30% to 50% sequentially, which is higher than the original contract prices. With over 130,000 GPUs expiring in 2027 and another 170,000 in 2028, based on current prices for renewal, management expects nearly $4 billion in incremental annualized revenue in 2027, approaching $10 billion including 2028, without needing additional capital expenditure.
New GPUs require new money, while renewing old cards means monetizing previously invested assets again; this segment is the most valuable part of the profit and loss statement.
The rent for old cards has been rising, which needs explanation: the cost-performance ratio for GPUs has been improving, with new cards getting cheaper per dollar of computing power, thus one would expect the rent for old cards to decrease. Now there are three explanations:
- Supply bottleneck: Power, facilities, and advanced packaging restrictions limit new capacity, and customers can't find fast enough alternatives.
- Extended economic life: AI demand has made GPU residual value higher than traditional depreciation assumptions.
- Instant delivery premium: Customers are paying a premium for immediate access to computing power. After new capacity comes online and waiting times decrease, renewal prices might drop rapidly. The first two support the continuation of the premium, while the third implies a retraction of the premium.
To distinguish these, observe renewal prices, the rent price difference between old and new GPUs, delivery waiting times, and old card utilization rates. If renewal prices in 2027 are lower than the original contract prices, this bullish logic will be overturned for the first time.
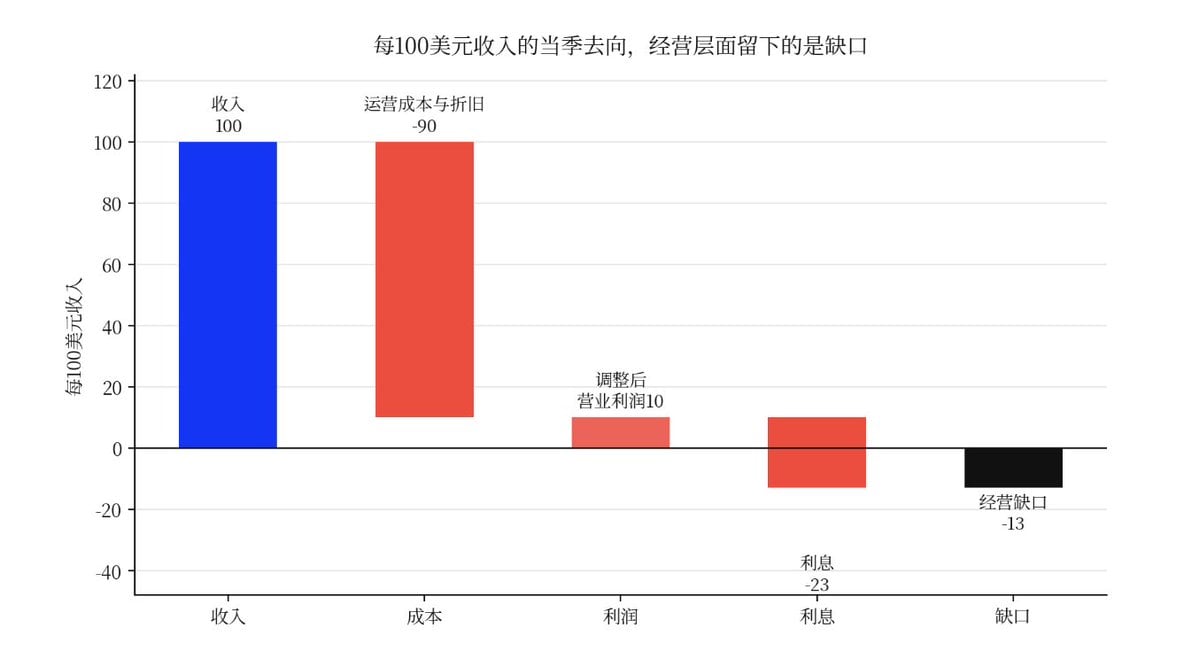
Interest always takes precedence over shareholders.
Adjusted operating profit in Q3 was $379 million, while interest expenses were $846 million, with interest accounting for about 23% of revenue; operating profit cannot cover interest. Based on full-year guidance, interest is expected to be around $3.1 billion, accounting for 23% to 24% of revenue between $13 billion and $13.3 billion.
Management expects significant narrowing of losses in 2027 and turning positive in 2028, and the market is trading on whether “profit growth can outpace interest growth”; otherwise, the valuation logic will reverse. The biggest change in the earnings report is that backlogged orders increased by about $29 billion in just one quarter.
$133 Billion in Orders Looks Tempting, But Orders Are Not Cash: The Real Problem is How to Liquidate It
By the end of Q3, CoreWeave’s backlog increased from about $104 billion at the end of Q2 to $133 billion, with over half expected to start delivery before the end of the year. Management further indicated that capacity would be sold out by 2027, with some remaining for 2028. Order growth resolves the demand issue but does not address the financing problem.
A long-term computing power contract does not become cash on the day it is signed. CoreWeave must first build the facilities, purchase GPUs, and pay electricity and infrastructure costs, then recognize revenue over the contract period.
With a five to six-year delivery cycle, the $133 billion in contracts corresponds to an average annual recognized revenue of about $22 billion to $27 billion, which roughly aligns with the company’s $20 billion to $21 billion exit annualized revenue guidance for 2026.
Meanwhile, the company’s 2026 cash capital expenditure guidance reaches $37 billion to $39 billion. The sooner orders are delivered, the more capital must be invested upfront.
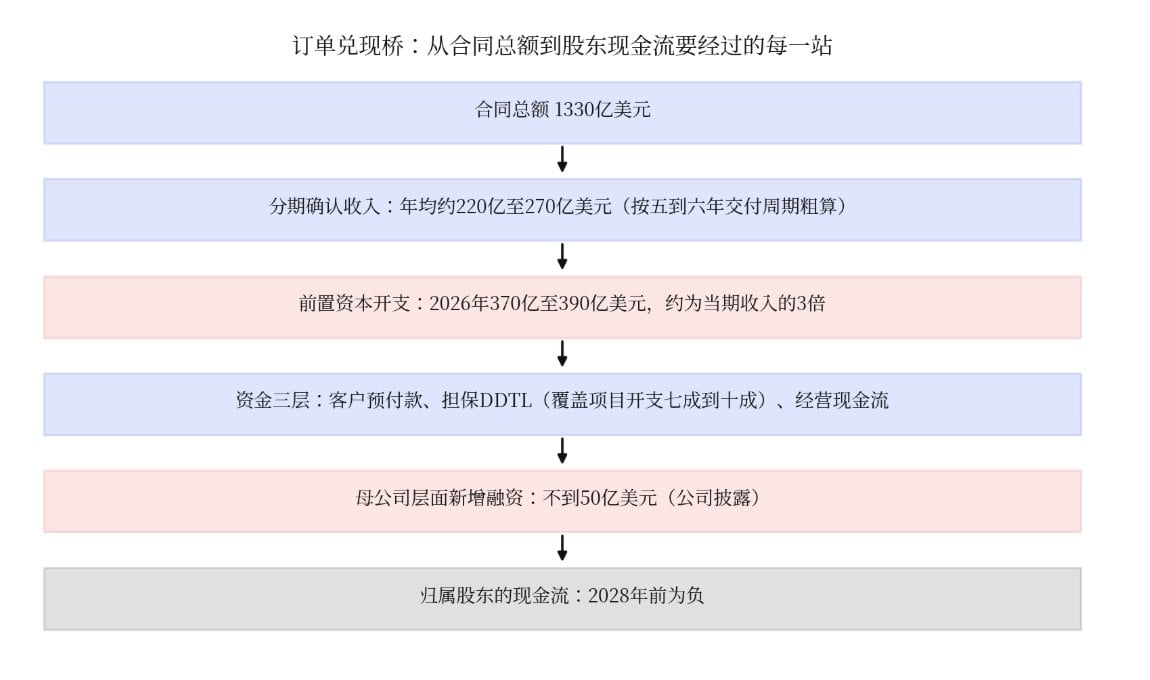
Therefore, one cannot simply value orders by dividing them by revenue. Orders represent the total future cash flow, while revenue recognition has a time lag; capital expenditures occur before revenue, and interest continuously siphons off cash throughout the process.
What CoreWeave needs to focus on now is not how many orders to sign but how easily existing signed orders can be converted to cash.
For the same $10 billion order, if the customer pays upfront, the contract is rigid, and the customer’s credit is strong, the risk to shareholders may be very low. If the company must borrow money to build, and the customer has strong renegotiation power while financing costs are high, larger contracts can create more upfront financial pressure.
CoreWeave’s priority is not signing more orders but determining how much of its own capital is required to fulfill these signed orders and how stable the cash returns will be.Going further down, $133 billion is a range, not a number:
To turn orders into valuation, one must examine the contracts internally: Customer quality determines financing costs and bad debt risks, how much investment-grade clients versus AI labs contribute is crucial; terms must match, as company-guaranteed loans are about 5 years, while some client contracts average about 3 years, and lenders still bear renewal risks;
The rigidity of contracts depends on whether they are ironclad or have cancellation clauses and renegotiation mechanisms, determining how firm the orders are; regarding prepayments, about 70% of contracts this year involve prepayments, with some potentially paying in full upfront, which reduces the company’s financing needs and transfers some financial risk to customers in advance;
Finally, pricing power is key, as fixed-price contracts lock in profits when costs rise, while contracts that allow for market adjustment are protective.
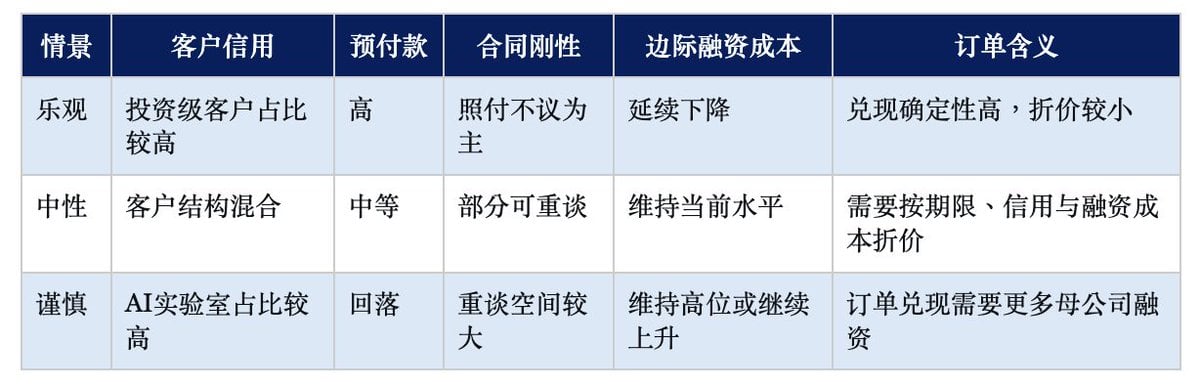
Conference call insights can roughly locate three scenarios: There are four pieces of optimistic evidence: 70% of new contracts involve prepayments, the renewal prices of old computing power surged 30% to 50% quarter-on-quarter and are higher than original contracts, capacity will be essentially sold out by 2027, WACD dropped to 7.9%, down about 250 basis points year-on-year;
Cautious evidence exists as well; there is a mismatch between the 5-year guaranteed loans and the 3-year underlying contracts, cancellation and renewal rates remain undisclosed, and the proportion of AI lab contracts is unclear.
Balancing these, the current stance may be closer to neutral, with order pricing sorted by duration and credit temporarily in the lead. Future attention should be on tonight's Nebius prepayments and cash flow data, as well as the renewal prices of the first batch of old GPUs in 2027. The market's discussions of 30%-40%, or 50% order discounts are merely rough references and should not be treated as precise valuations.
Why Have Profits Already Increased, But the Bond Market is Still Uneasy?
The complexity of CoreWeave’s financing structure arises from its not solely relying on the parent company to issue bonds to buy GPUs. Total capital expenditure in Q3 was about $14.5 billion, of which about $9.441 billion was for cash purchases of equipment, while the rest included equipment acquired through financing arrangements.
The annual cash capital expenditure guidance of $37 billion to $39 billion is based on different calculation foundations and cannot be directly extrapolated by multiplying the quarterly total capital expenditure by four.
By checking the pace in cash purchase numbers, total for the first three quarters was about $23.6 billion, with an additional investment of about $13.5 billion to $15.5 billion needed in Q4 to fall within the annual guidance range.
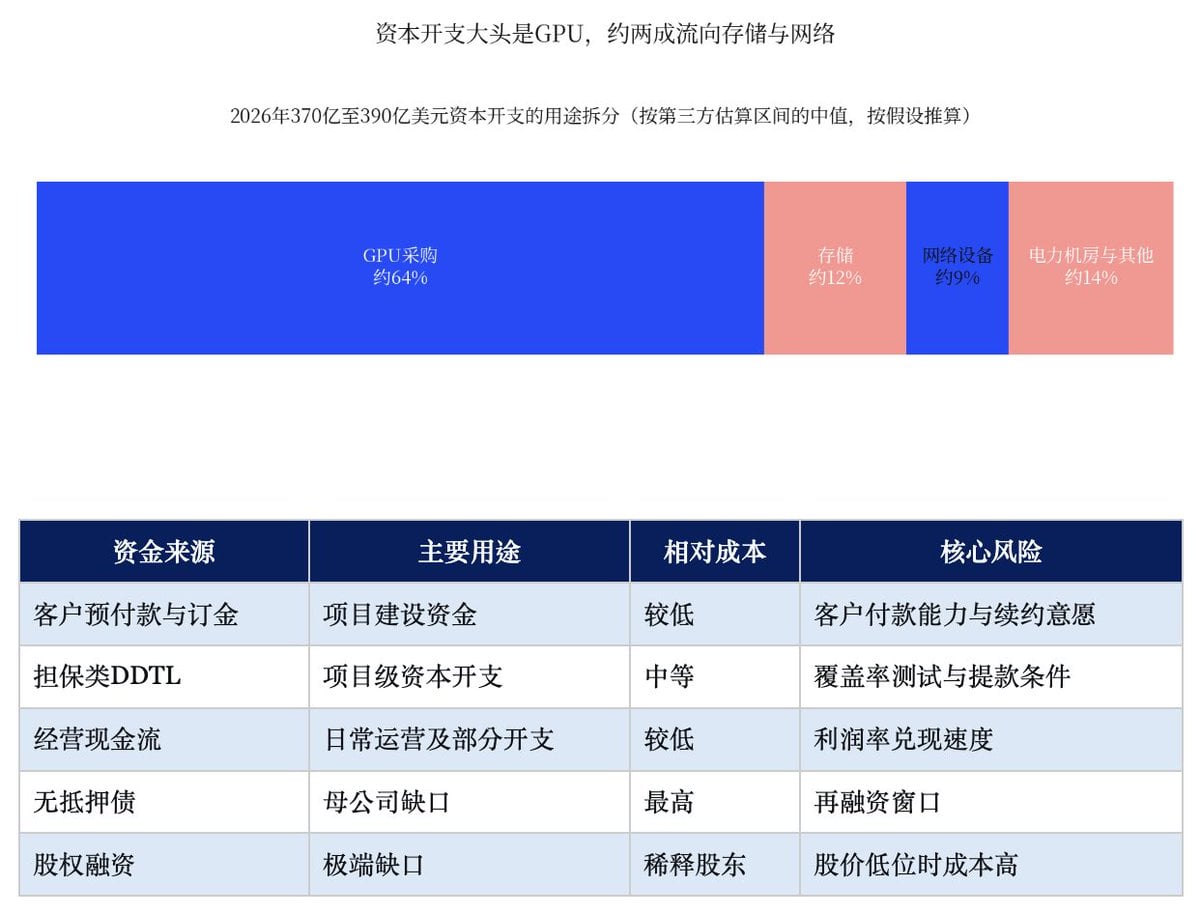
The company is clearly prioritizing the first three funding sources. Prepayments have covered about 70% of signed contracts, and approximately $9 billion is expected to arrive within the next three months, with over $3 billion coming from the premium renewals of old computing power. Project-level DDTL can cover a considerable percentage of project expenses, and operating cash flow, as profit margins improve, is also enhancing the capacity to bear costs. These three legs determine whether CoreWeave can continue rapid expansion.
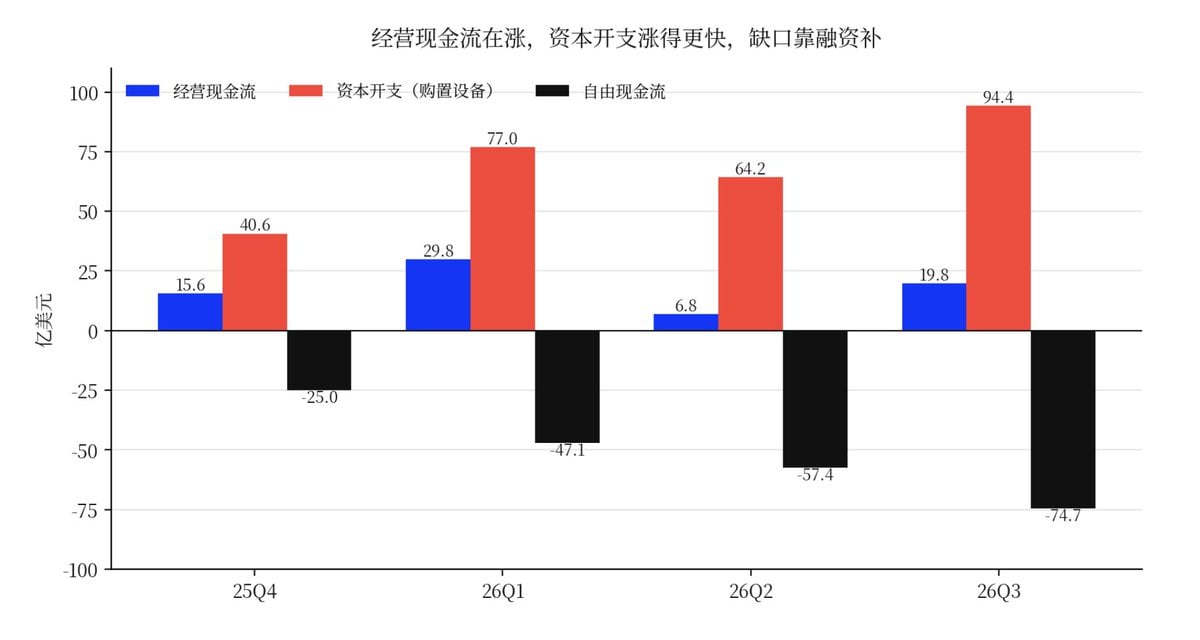
The true stress test is not whether the company has money, but rather whether, after any single leg thins, the other two can compensate. Hypothetically, if prepayments are $2 billion short, this gap can be buffered by undrawn DDTL capacity, with a nearly zero cost but consuming future capacity.
If available DDTL capacity falls short by another $3 billion, the shortfall begins to translate to the parent company level. If filled with unsecured bonds at around a 15% yield, the annual interest would amount to approximately $450 million, equivalent to a third of the full-year adjusted operating profit guidance. If profit margins take two quarters longer to climb, and operating cash flow falls short by another $1.5 billion, the gap would further widen.
When all three worsen simultaneously, the combined gap would expand by about $6.5 billion, which would truly push the company into expensive unsecured debt or even equity financing.
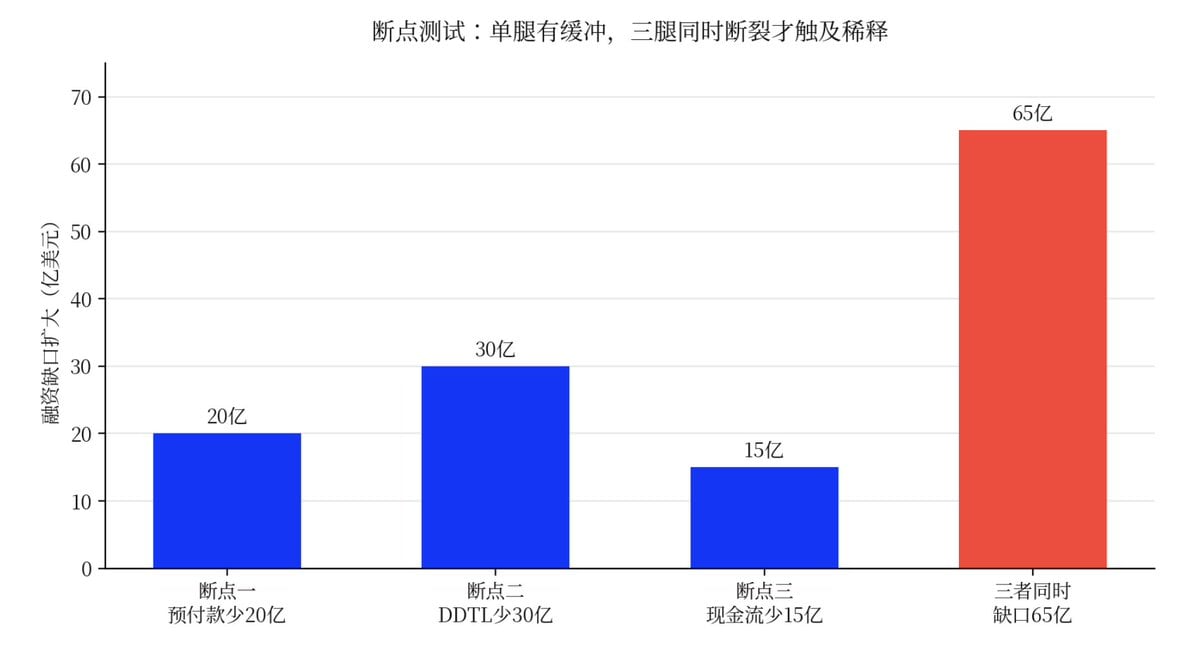
Based on the Q3 report information, let’s list these breaking points from nearest to farthest:
- Nearest: Prepayment breaking point. The fourth quarter and the annual report in February will reveal the annual cash receipts; this is the only thing that may be proven or disproven within the next three months.
- Middle: Operating cash flow breaking point. The trigger condition is the delay in profit margin improvement, which can only be verified with the Q1 2027 report.
- Farthest: DDTL breaking point. Coverage testing will happen around October 31, 2027.
- Farthest and most critical: Three legs breaking at once. Trigger conditions involve issues with large customer payments or a general downturn in industry demand, which there is currently no public evidence pointing to.
The current focus should be on the prepayment aspect. The bond market reacts before the stock market does, and that’s the crux. Equity investors look at future profit margins, while bond investors examine where the next dollar of cash will come from. Whether the next dollar can be borrowed cheaply depends on how the parent company’s credit and project credit balance out.
The adjusted operating profit in Q3 was $379 million against interest expenses of $846 million, covering about 0.45 times.
Looking solely at the consolidated financial statements, this is not a comfortable number, and Q4 interest guidance needs to rise to $1.05 billion to $1.15 billion.
However, CoreWeave’s debt structure cannot only be understood through the parent company’s profit statement: corporate credit looks at the entire company's profits, cash flow, and capital structure, while project financing considers the cash flow of a specific project, collateral, and customer credit.
A fair amount of guaranteed loans correspond to specific projects, typically backed by customer contracts, equipment collateral, and cash buffers formed by prepayments; the company discloses that these types of loans can cover a significant portion of the corresponding project expenses.
Thus, 0.45 times does not equate to an immediate inability to repay debt, it actually indicates that the parent company level cash flow for shareholders has not formed sufficient debt carrying capacity, hence the company must allocate as much financing as possible at the project level.
This is also the most vulnerable link in the entire financing model: projects can borrow based on contracts and collateral, and if the parent company’s credit is slightly lower, it won’t drag down every new expenditure; but once project financing requires the parent to back it, the financing system will shift from tiered pricing to overall pricing. At that point, the 15% yield on unsecured debt will truly become a cost for shareholders.
CoreWeave's Most Critical Bet: Can Prepayments and Project Financing Cover Capital Expenditures?
CoreWeave's debt isn't unified across a single interest rate.
Taking the second-quarter debt breakdown organized by a third party as an example, floating rate guaranteed debt stood at about $14.2 billion, with different DDTLs’ interest rates potentially varying by hundreds of basis points. The same tool called DDTL can see rate differences of over 300 basis points; the variability does not lie in the tool itself but in the underlying contract credits.
Cash flows from investment-grade customer contracts are more easily accepted by loan institutions, leading to relatively low financing costs. In contrast, AI lab contracts face credit uncertainties and shorter renewal terms, prompting lenders to demand higher risk compensation.
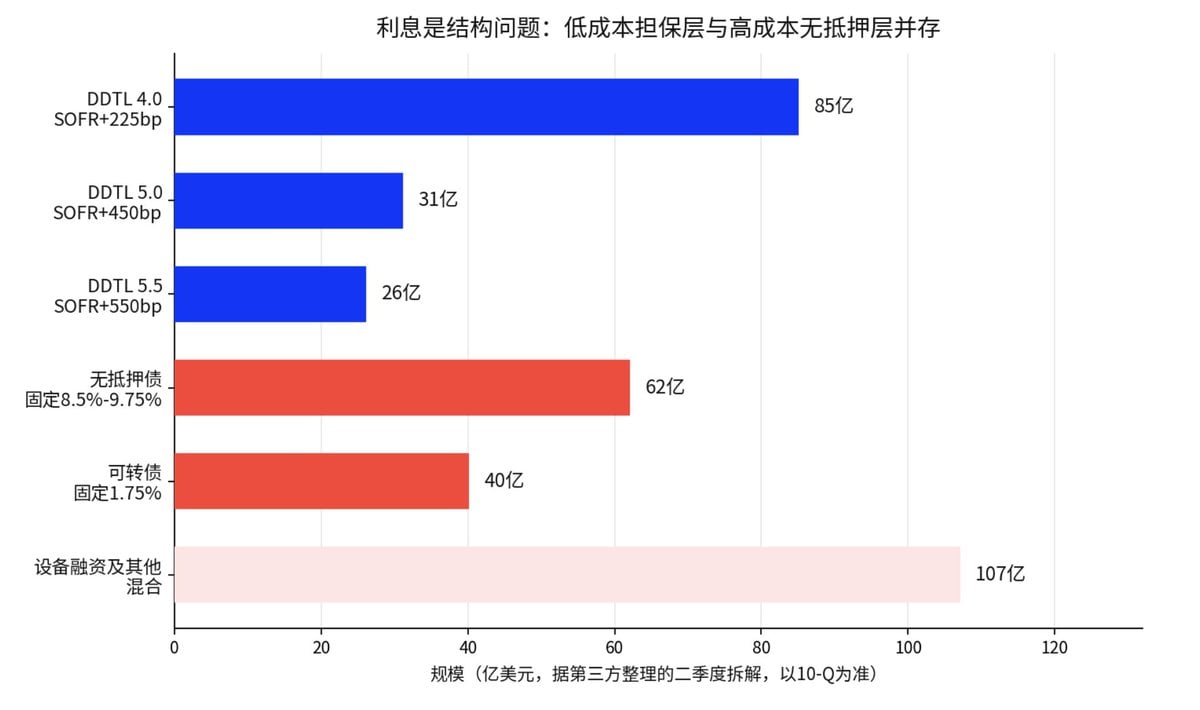
The company has disclosed that its WACD has already dropped to 7.9%, down about 250 basis points year-on-year. In Q3, they prepaid over $4 billion, including some higher-cost DDTLs.
This is a positive signal because every reduction in financing costs adds another layer of buffer to the cash flow left for shareholders after order fulfillment.
However, WACD may conversely amplify risks; credit deterioration could push new financing into higher interest rate categories, rising interest pressures free cash flow, and worsening cash flow may necessitate additional external financing. Increased financing demand drives bond yields up, making the next financing more expensive and in turn feedbacking into WACD.
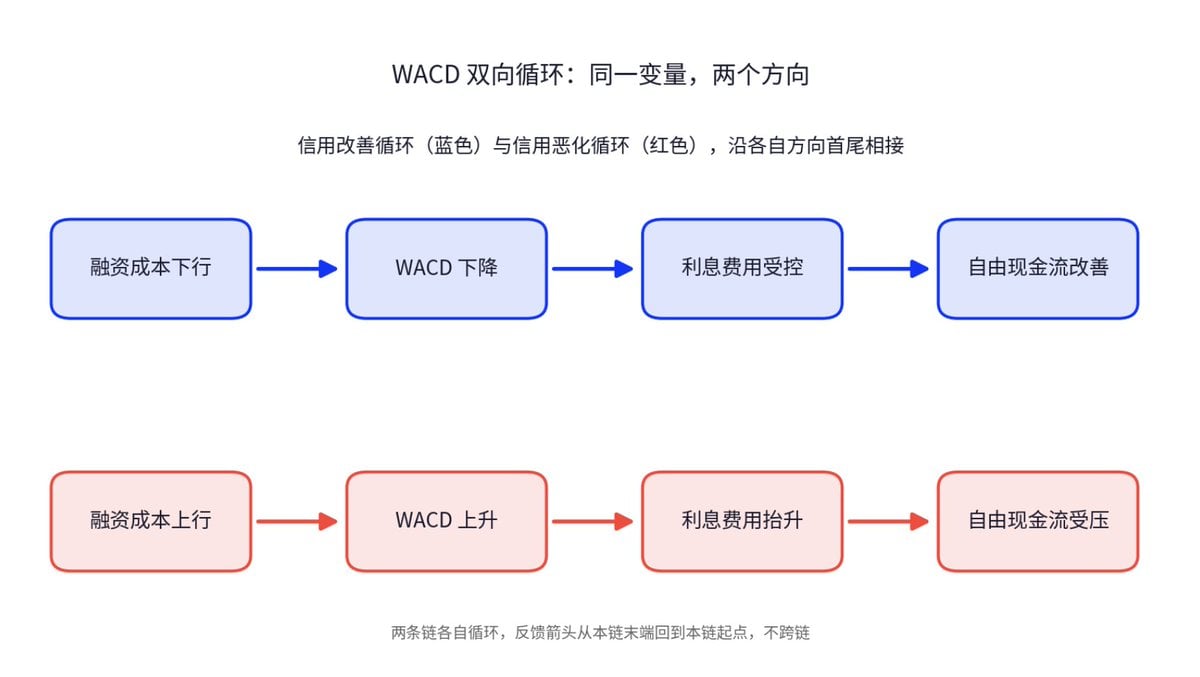
Quantitatively examining this chain: estimating that around $14.2 billion of floating rate guaranteed debt, every 100 basis point increase in SOFR results in an annual interest rise of about $140 million, and about $35 million for every 25 basis points.
If the gap were to be filled with unsecured debt at a 15% yield, every $140 million gap would generate another $20 million in interest annually.
This calculation is more meaningful than the “every 100 basis points across all debts increases $500 million,” as fixed rate debt does not change in tandem with SOFR.
Looking ahead at CoreWeave, there’s no need to guess stock prices daily. What’s more pressing to monitor are three things: Whether WACD can continue to decline, whether new financing remains in the secured low-interest categories, whether interest expenses begin to outpace adjusted operating profits. If all three deteriorate simultaneously, worries in the bond market will enter the profit and loss statement. Meanwhile, aside from financing costs, there’s another market variable that has not been priced in much: downstream capital expenditures.
Tonight Look to NBIS: Who is Paying First for AI Computing Power?
Nebius’s earnings report conveniently coincides with the release of this article. CoreWeave and Nebius’s business models seem quite similar, but their financing paths differ; AI computing power infrastructure can be roughly divided into four categories.
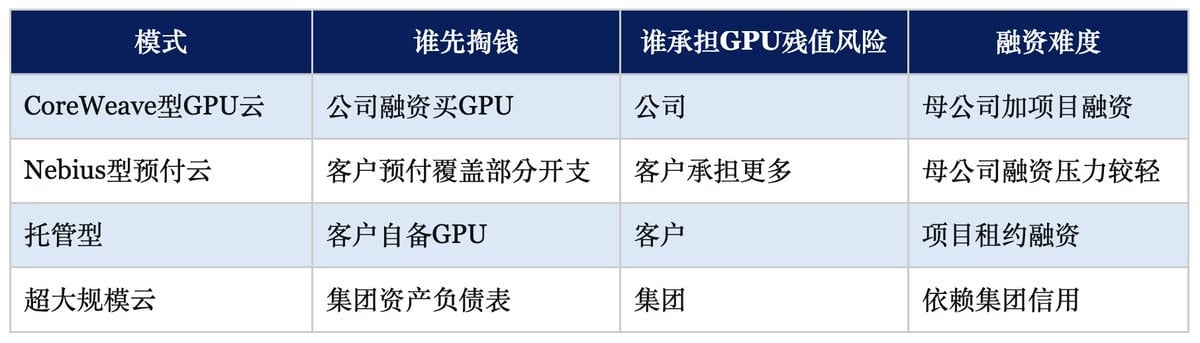
The central question behind this table is singular: who pays first?
As of the closing stock market on November 11, Nebius had a market value of about $37.1 billion, with commitments from investment-grade clients like Microsoft and Meta exceeding $40 billion; CoreWeave has a market value of about $33.5 billion but carries $133 billion in orders.
Both companies are demonstrating strong demand for AI computing power, and on the same day, Nebius also rose by 15.4% alongside CoreWeave; however, the valuation disparity from the market is significant: according to prior data providers, Nebius has approximately a 16x forward sales ratio, while CoreWeave is around 5x.
This gap cannot simply be attributed to the market favoring Nebius more; it’s more telling to observe where the risks of capital expenditure lie.
A high proportion of customer prepayments allows the company not to have to borrow all expenditures upfront; strong customer credit means lower project financing costs; longer contract coverage allows lenders to convert future cash flows into financing capabilities more easily.
In contrast, CoreWeave finances the purchase of GPUs itself and bears the residual value risk, hence the market demands higher risk compensation.
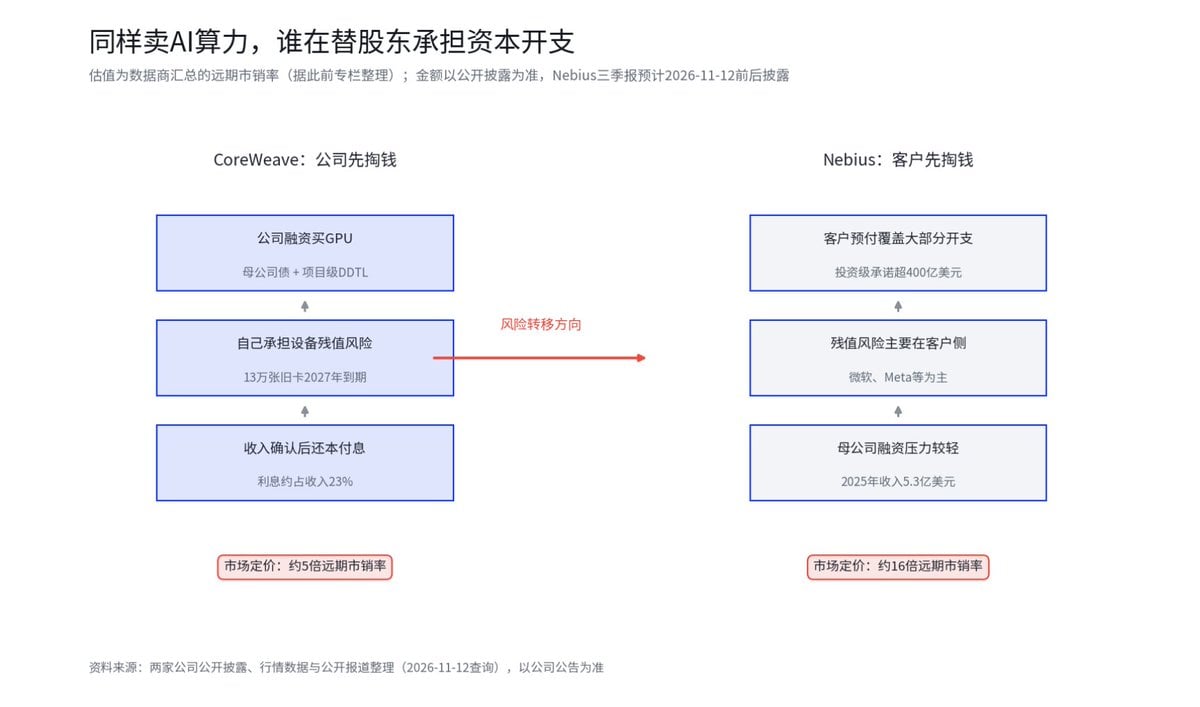
Nebius’s earnings report shouldn’t just be about how much it makes; it will serve more as a test of whether CoreWeave’s valuation discounts are justified.
Regular investors don’t need to calculate EPS, nor do they need to build tables item by item; they just need to focus on the three outcomes the market cares about most: are customers paying upfront, are the commitments from big clients like Microsoft and Meta actually materializing, and is the company borrowing excessively for expansion?
If Nebius expands rapidly but isn’t borrowing much, CoreWeave’s valuation discount will have a solid commercial explanation; conversely, if Nebius also relies on heavy external financing to support its expansion, the valuation difference between the two would be more a difference in market sentiment. The earnings report will be released tonight, and the media and conference call will focus on these three points for answers.
AI Cloud’s Money Circulating Downstream: $37 Billion in Capital Expenditures, Who Will Benefit from Storage Price Increases First?
CoreWeave’s capital expenditures are not just an issue for its balance sheet; they circulate outward along the supply chain.
The transmission path is that GPU orders from AI cloud companies turn into income and cash flow for suppliers, suppliers’ capacity plans turn into demand for HBM and DRAM, and strained demand ultimately reflects in storage prices.
Breaking down the $37 billion to $39 billion cash expenditure for 2026, the bulk is for GPU integrated systems and networking, while storage is embedded in every server, following the whole machinery procurement. The company has not separately disclosed the proportion of storage, but what can be confirmed is that purchasing scales will expand alongside the deployment of cards.
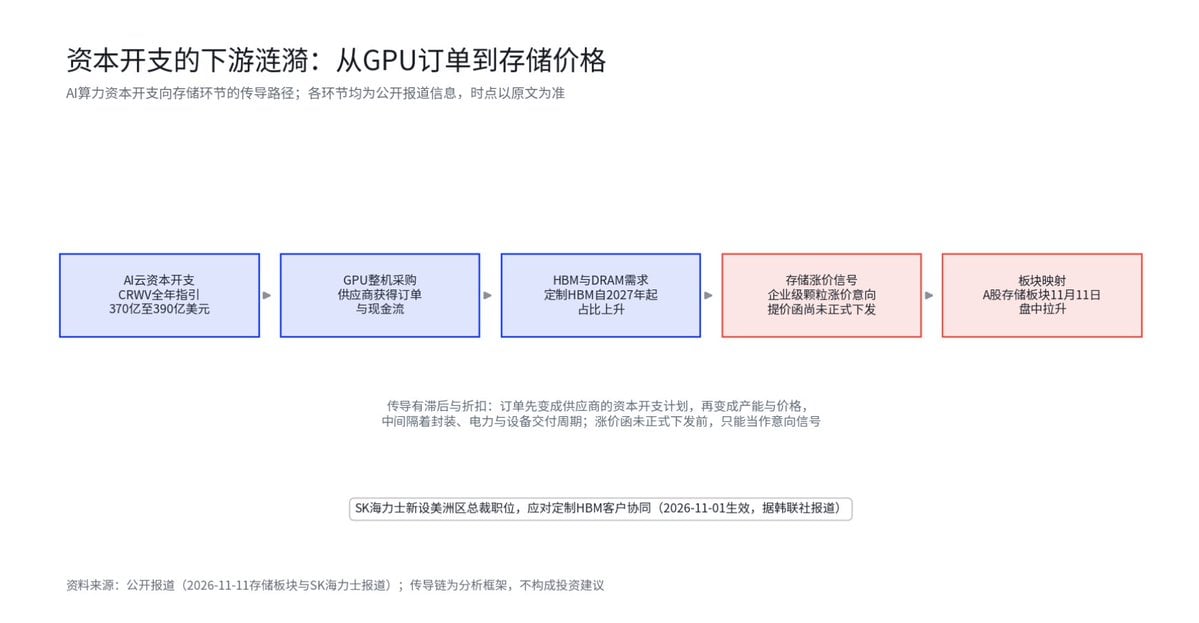
HBM is a part of this chain with high certainty.
The information disclosed by the company carries weight: The proportion of GPU cloud service revenue dropped to 72% in Q3, and GPU purchases have been embedded in the financial statements through purchase commitments made to suppliers like NVIDIA; management clarified on the call that old cards expiring next year are mainly being renewed, with renewal prices increasing 30% to 50% quarter-on-quarter. This part represents real orders with agreed prices and doesn't require further estimation.
On the supply side, there are public judgments as well. According to TrendForce industry analysis from Q4 2026, HBM consumption is expected to double, with supply and demand approaching balance, and the launch of HBM4 and tight supply is expected to drive prices up in 2027, shifting bargaining power toward suppliers, with storage manufacturers restructuring client relationships around customized HBM.
There are renewal orders disclosed by the company on the demand side and an industry balance judgment on the supply side; if both sides meet, that is sufficient direction.
As for the proportion of this company’s procurement in the global HBM landscape, this article maintains a directional assessment: the demand of a single AI cloud company relative to the global market mainly serves to verify the authenticity of AI demand rather than directly sway storage pricing.
Recent public signals seem to hinge on this chain. Reports indicate that on November 11, the storage chip sector in the A-share market surged in the afternoon, with some leading firms verbally notifying channel vendors of their intentions to increase enterprise-grade chip prices, although price letters have not yet been formally issued.
SK Hynix appointed a new president for the Americas on October 30 during a reorganization—Ahn Hyun, who was previously in charge of HBM research and development, took office on November 1. The background is that AI chip vendors are increasingly deeply involved in memory design, and customized HBM is expected to become more important starting in 2027.
To validate this chain, one must follow the signals of price emergence in order: verbal price increase intentions are merely the first step, followed sequentially by the formal issuance of price letters, contract price adjustments, and spot price increases. With each successive step, the judgment of strong AI computing demand gains more confirmation.
Transmission has delays and discounts; orders first turn into suppliers' capital expenditure plans, then into capacity and price adjustments, separated by packaging, electricity, and equipment delivery cycles.
Without specific disclosures from companies regarding the rhythm at each stage, a rough ordering based on past experiences in storage industry price increase cycles is suggested, with specific timing to be based on company announcements and third-party quotes.
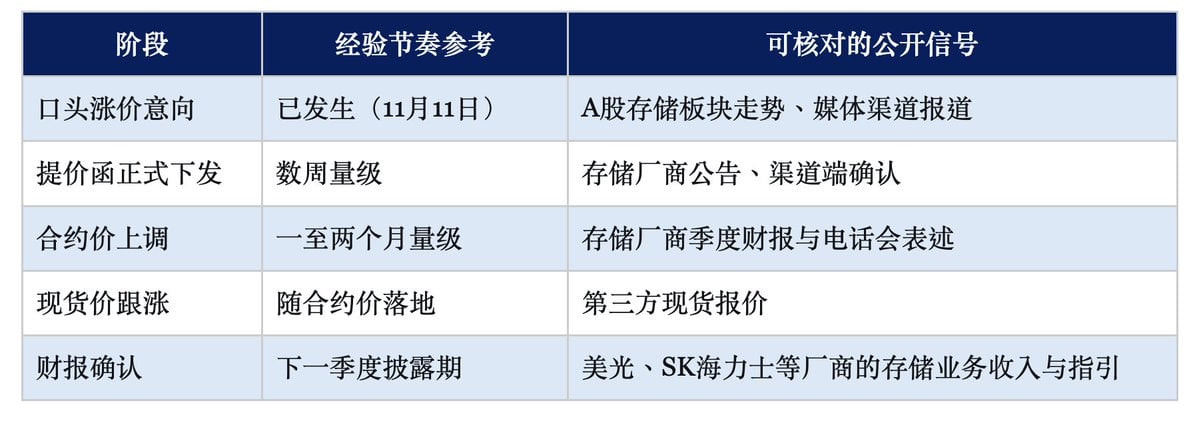
If the price letters are not officially issued within several weeks as expected, this indicates that verbal intentions may have merely been a probe by the channels, putting the evidence for storage price increases on shaky ground, and the quality of CoreWeave's order fulfillment would require re-evaluation. For those reading about CoreWeave, the chain’s utility remains to cross-verify; if storage prices decline, the quality of order fulfillment should also be reassessed.
From NBIS to CoreWeave, These Cash Flow Signals are Worth Watching
The pressures facing CoreWeave can be divided into three transmission chains.
Falling stock prices alongside stable bond prices often indicate a risk appetite issue; simultaneous declines in both stocks and bonds suggest the market is beginning to reprice the company’s credit and refinancing ability. Rising interest expenses while bond prices stabilize at low levels reflects pressure directly entering the profit and loss statement.
The worst-case scenario is if all three chains activate simultaneously; an interest rate environment drives up floating financing costs, bond yields approach 15% again making parent company financing more expensive, and a reduced risk appetite narrows equity financing windows; at that point, customer prepayments, project-level financing, and operating cash flow will come under pressure together.
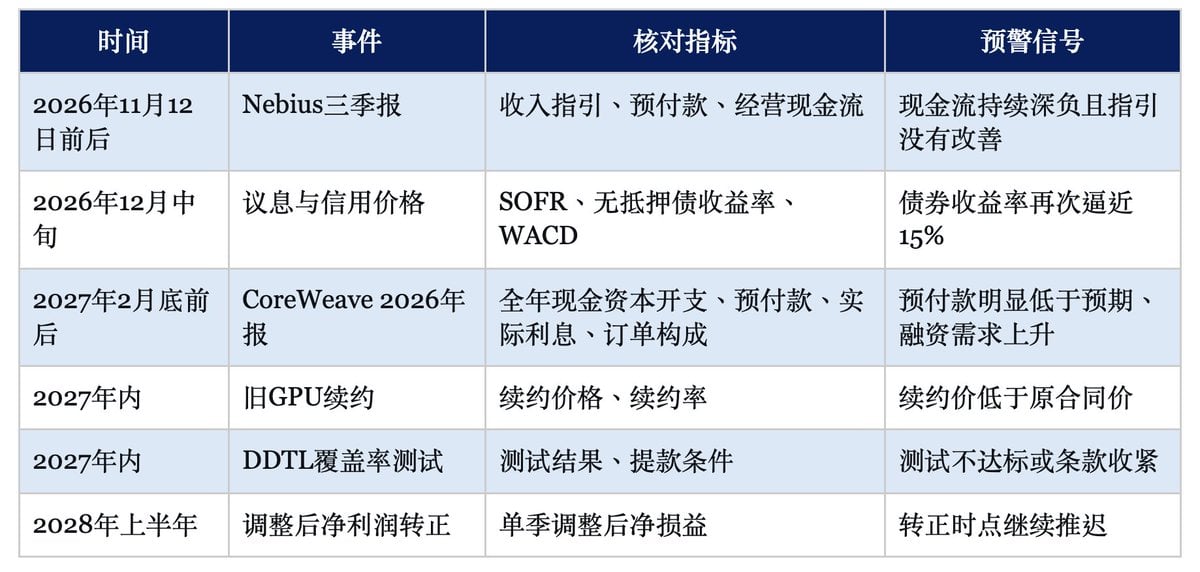
If credit prices fall back, WACD continues to drop, and old GPU renewal prices remain high, this rebound will gain more cash flow validation.
Conversely, if there’s a simultaneous drop in prepayments, rising financing costs, and retreating old GPU renewal prices, the $133 billion order may turn into pressure: the company must invest more capital upfront for more orders, yet cash left per dollar of order may be decreasing. The above is merely a tracking framework and does not constitute investment advice; single indicators are insufficient for directional judgment.
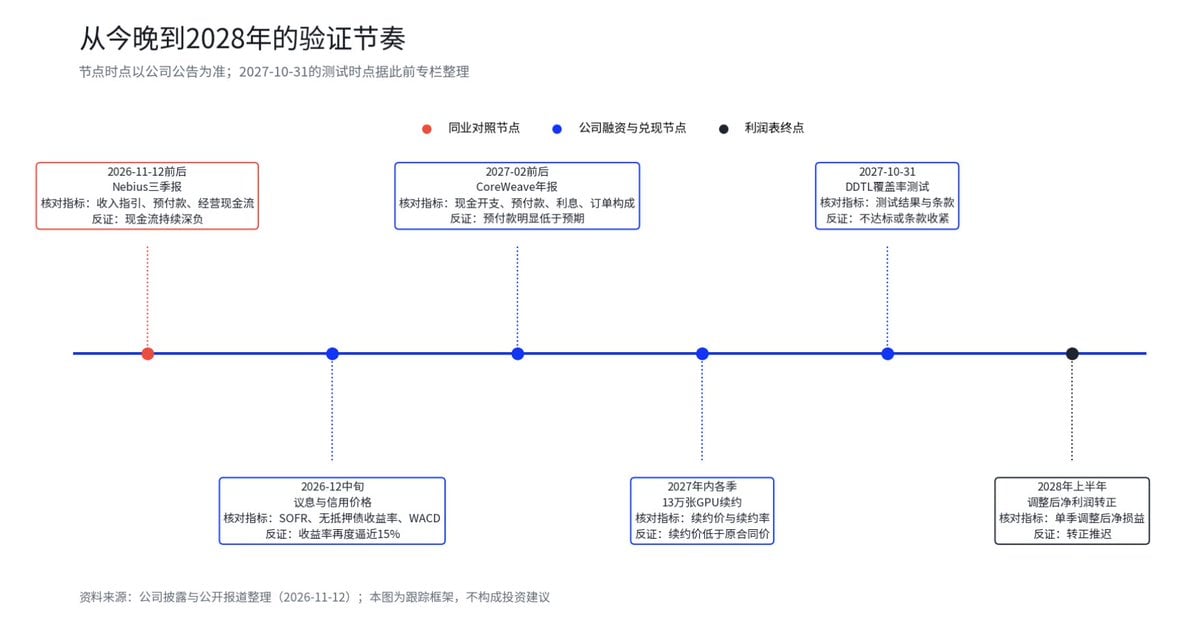
In Conclusion: The $133 Billion is Not the Problem, Who Will Foot the Bill is the Issue
CoreWeave’s Q3 report demonstrates that computing power can rise in price and profit margins can climb quickly; however, it has not yet proven that orders can translate into shareholder cash flow without heavy asset burdens. The achievement of 10% profit margin ahead of schedule is the reason for the stock market’s revaluation, while high interest and enormous capital expenditure are why the bond market remains cautious.
The $133 billion does not represent cash in CoreWeave’s hands, but rather a total contract amount that needs capital investments upfront, along with financing costs, before gradually being liquidated. What should truly determine valuation is not the nominal order amounts but how much free cash flow is left after orders are fulfilled. For this company, the growth of orders itself isn’t the largest variable; the real question is which grows faster—order growth or financing capability.
Tonight’s Nebius earnings report will further push this question onto the entire AI cloud sector: if customer prepayments, investment-grade contracts, and a lighter financing structure truly allow Nebius to expand rapidly while occupying less shareholder capital, then the valuation discount on CoreWeave is not merely market sentiment;
Conversely, if Nebius also needs constant financing to fulfill its orders, then what the market ultimately exchanges is not “who has more orders,” but who has the greater capacity to transform AI demand into real free cash flow.
Data Statement
- Company Disclosures: CoreWeave Q3 2026 financial report and earnings meeting (2026-11-10), 10-Q (filed on 2026-11-10). Financial data, pricing, orders, financing structures, and guidance are based on the original company documents, with financial details aggregated by data vendors. Market data is based on NASDAQ closing figures (queried on 2026-11-12), with November 9 close at $48.98, November 10 close at $48.73, November 11 close at $60.77 (up 24.7% on the day, with a trading volume of 158 million shares), and it fell back to around $57 afterwards (snapshot taken during the evening of November 11 Eastern Time). Total capital expenditure for Q3 of $14.5 billion included equipment acquired through financing arrangements, differing in calculation base from cash purchases of equipment at $9.441 billion, based on the 10-Q document.
- Third Party Organizing and Public Reports: Debt layering, floating rate guaranteed debt of about $14.2 billion, customer concentration rates, depreciation policies, per gigawatt investment amounts, renewal and lease prices of old computing power, yields on unsecured debt, etc., some derived from previous column aggregation (2026-11-04) and public reports; prior to official release, it is recommended that each item be reviewed against the original disclosure for verification. Interest rate environment (October CPI, statements from Federal Reserve officials, interest rate hike pricing probabilities) is based on publicly reported data (from 2026-11-10 to 11-11). Nebius closing market data (closing at $154.69 on November 11, up 15.4% that day) and quarterly financial reports are calculated from trading data and vendor aggregation, with the expected disclosure timing of the Q3 report based on public reports. HBM industry judgments cited from TrendForce industry analysis reports (2026-11-05). Storage chain information (A-share storage sector’s surge on November 11 and enterprise-level chip price increase intentions, SK Hynix’s appointment for the Americas) is based on new articles and reports cited by Yonhap News from (2026-11-07 to 11-11).
- This Article's Calculative Explanation: Profit and interest comparisons for every $100 of revenue, average recognized annual revenue from orders, three levels of order value scenarios, capital expenditure stress tests, SOFR’s impact on floating rate debt interest estimates, unit economics return cycles, tiered yield breakdowns, and sector transmission chains, all constitute an analytical framework and do not represent company guidance or precise valuations.
Disclaimer
The content of this article is for general information and market commentary purposes only, organized based on publicly available information as of the time mentioned. Related market data, expectations, and probabilities may change with market situations. The opinions and investment strategies of the third-party institutions, analysts, or other individuals quoted in this article only reflect their views at specific times and do not represent the views or recommendations of BIT.
This article does not constitute investment advice, investment research, invitation, solicitation, or recommendations regarding any securities, investment products, or trading strategies, nor should it be used as a basis for any investment decisions. Financial markets involve risks, and security prices and market performance may fluctuate, past performance and historical market trends do not assure or guarantee future results. Investors should independently evaluate the associated risks based on their own circumstances and seek professional advice when necessary.
免责声明:本文章仅代表作者个人观点,不代表本平台的立场和观点。本文章仅供信息分享,不构成对任何人的任何投资建议。用户与作者之间的任何争议,与本平台无关。如网页中刊载的文章或图片涉及侵权,请提供相关的权利证明和身份证明发送邮件到[email protected],本平台相关工作人员将会进行核查。


