The one-year return over three complete cycles was positive, but all initially experienced further declines.
Written by: IOSG Ventures
Since 1950, the United States has held 19 midterm elections. According to our statistics, in each post-election year, the S&P 500 index was above the level on election day. Bitcoin has gone through three complete midterm election cycles, and its price was higher a year later, but it dropped for a period in the weeks following each election.
When voting takes place on November 3 this year, the positions of the two markets are quite different. U.S. stocks are near historical highs, while Bitcoin is still recovering from a significant sell-off in the previous period. Historically, the performance of both can be somewhat optimistic a year later, but the interim trends may vary greatly.
However, how much reference value these historical data have for 2026 remains in question. In the year before past midterm elections, the median maximum drawdown for U.S. stocks was 16%, and this year it was only about 9%, meaning there isn’t much decline to recover. Bitcoin has only three samples, and each midterm election occurred between two to two and a half years post-halving, making it difficult to determine how closely related the price increase is to the election itself.
Core Views
- U.S. Stocks: Historically, post-midterm performance has been quite strong, but this year's pre-election market performance is also stronger than in previous years. Therefore, directly assuming that historical average gains will be repeated is not prudent.
- Bitcoin: The one-year returns over three complete cycles are all positive, but all initially experienced further declines. Based on only three samples, it is not yet possible to confirm the existence of a reliable "election effect."
- Policy: Congressional control will impact legislation and regulation within the crypto industry. However, the core factors that determine market direction remain corporate earnings, interest rates, and capital flows.
U.S. Stocks: Historical Performance Shines, But This Year's Starting Point Is Different
From 1950 to 2022, there were 19 midterm elections. In the 12 months following each election, the S&P 500 index recorded an increase, with an average gain of 15.1% and a median of 14.5%, even the weakest performance recorded a rise of 1.1%.
In contrast, during non-midterm election years, using early November as a starting point, the average return over the following year was 7.2%, with about 70% of samples recording gains.

▲ Source: IOSG, calculated based on daily closing prices
Historically, declines mostly occurred before elections. In the year prior to midterm elections, the median maximum drawdown of the market was 16%. Within the six-month observation window set around voting day, the market low occurred before the voting day in 17 out of the 19 elections studied.
Increases also often begin before the voting concludes. Analysis by BlackRock shows that, as election results gradually become clear, U.S. stocks usually start to rise about a month before midterms. In late October this year, the predictive market estimated about a 93% probability of the Democratic Party controlling the House of Representatives and about a 68% probability of controlling the Senate. This suggests that the division of the presidency and Congress between different parties has been widely anticipated by the market and may not be a surprise on election day.
This does not mean that all policy impacts have been reflected in prices, but expected outcomes may provoke less immediate market reaction than surprising results. Therefore, voting day can serve as a reference time for observing market conditions but may not be the turning point of the market.
This year’s market starting point is also different. In late October, the S&P 500 index was only about 3% away from the historical closing high set on October 6, and the maximum drawdown in the previous year was about 9%. In other words, there isn't much ground for the market to recover.
Historically, there have been five midterm elections that met two conditions: an increase of over 10% before the election and a drawdown of less than 10%. These occurred in 1954, 1958, 1986, 2006, and 2014. The following year's returns ranged from 1.1% to 33.2%, with a median of 6.7%.
Compared to the seemingly precise median numbers, this broad range is worth noting. These cases illustrate that a strong market can continue to rise after elections, but it is insufficient to set reliable return targets for 2027 based on this alone.
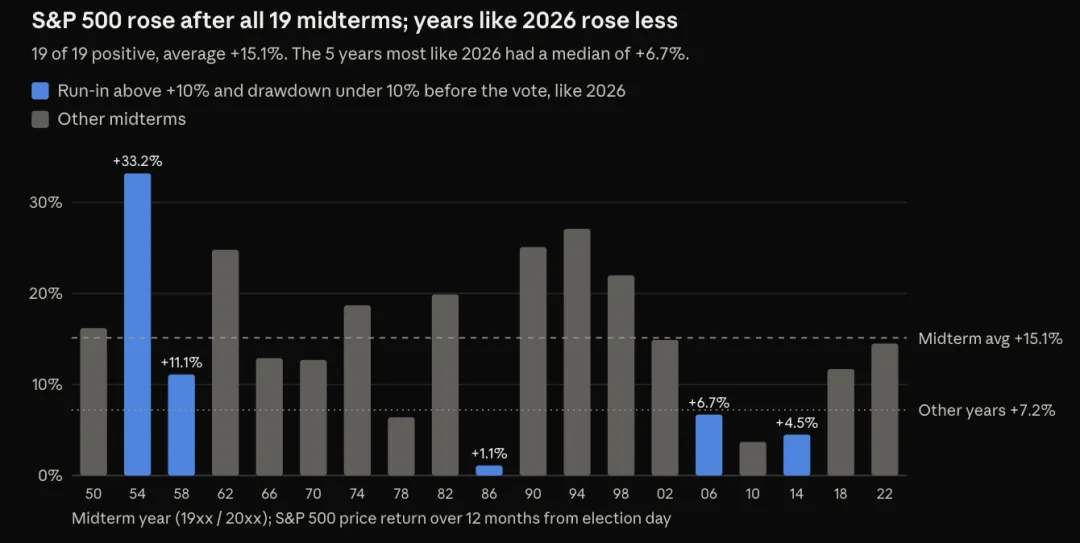
▲ Figure 1. Returns of the S&P 500 index over the 12 months following each midterm election. The blue bars highlight the five historical cases that meet the criteria of "significant pre-election gains and shallow drawdowns" for comparison with 2026.
Historical experience leans towards optimism, but the next wave of increases still requires support from corporate earnings and the interest rate environment.
Bitcoin: Year Later Upsurge Does Not Imply An Easy Recovery Process
Bitcoin has a shorter history and its holding process is also more difficult.
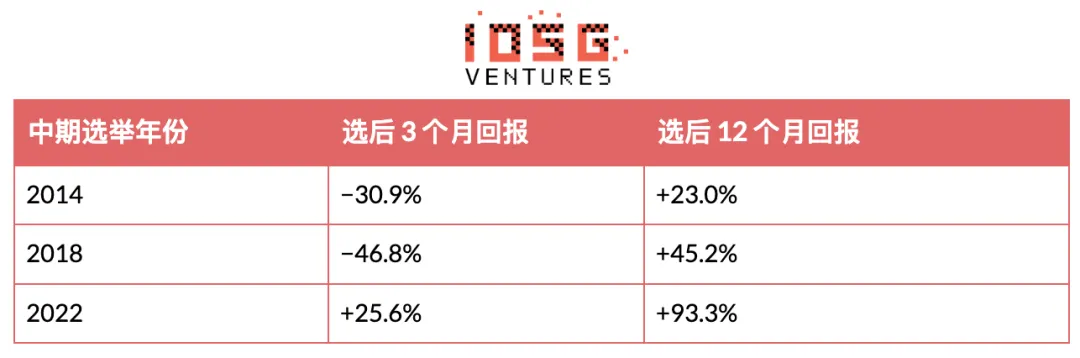
In the three complete midterm election cycles of 2014, 2018, and 2022, BTC experienced declines in the weeks following election day, but its price was higher a year after each election day. The downtrend in 2022 was shorter, with BTC recording an increase by three months after the election. The short-term performance differences among the three cycles are significant.
▲ IOSG, calculated using CoinMetrics BTC PriceUSD data
Binance Research indicates that the average gain of Bitcoin within one year after midterm elections is about 54%, which is consistent with our sample's average gain of 53.8%. However, the process of the increase is equally important: the median return three months post-election is about −31%, and 12 months later, it is about +45%. Even when investors ultimately identify the recovery direction correctly, they may face significant losses before the price increase arrives.
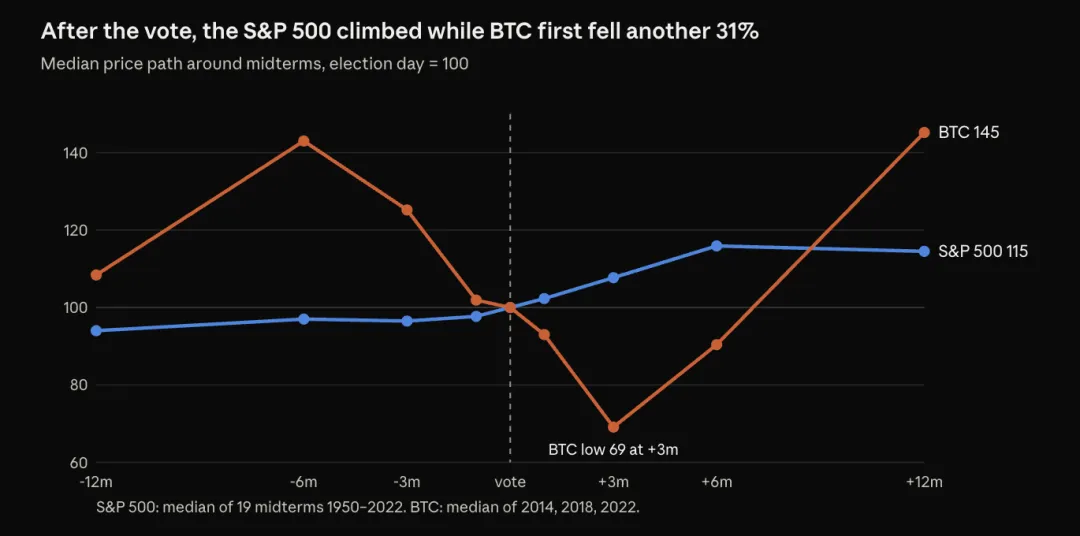
▲ Figure 2. Median performance before and after midterm elections, with election day as the benchmark, set to 100. The S&P 500 sample includes 19 elections from 1950 to 2022; the Bitcoin sample includes three elections from 2014 to 2022. The lines in the figure only connect selected observation points and do not represent predictions.
However, these samples cannot independently identify the impact of the election itself. Each midterm election has coincidentally occurred about two to two and a half years after Bitcoin halving and has been in a bear market phase. The November 2026 election is also about two and a half years from the halving in April 2024.
With only three samples and two overlapping cycles, it is impossible to determine whether or how much the election has materially affected this pattern.
Likewise, the median curve should not be treated as a price forecast. This curve summarizes results from different years and is not a complete market experience that investors have undergone in a particular cycle. Mechanically applying it to today’s prices will only create a sense of precision that the data itself cannot support.
With the entry of spot ETFs and corporate treasury funds, the investor structure of Bitcoin has also changed. These channels can bring demand and may also transmit redemption pressure, financing pressure, and changes in risk preference to the market.
What is worth remembering is that having a positive outlook for the coming year’s performance does not contradict the possibility of still having short-term decline. As for when the decline will end, historical samples offer no answers.
What Changes Can Elections Bring to the Crypto Industry?
For the crypto industry, the most direct impact of the election comes from policy. In a market where there is widespread expectation that the presidency and Congress will belong to different parties, it is essential to pay attention to how the new Congress will adjust legislation, regulatory oversight, and personnel appointments within regulatory agencies.
The progress of the CLARITY Act exemplifies this uncertainty. On September 15, the Senate failed to pass a procedural motion to end debate and advance the bill, with a vote of 49 in favor and 50 against. Subsequently, the Senate proposed a motion to reconsider, so the bill is currently stalled and has not entirely lost the opportunity for revival. However, before the election recess, the Senate did not conduct a second vote, and the only remaining window for this Congress is the "lame duck session" between the election and the swearing-in of the new Congress.
The next Congress will determine the leaders of various committees, legislative priorities, and specific conditions for renegotiation.

▲ The above is a scenario analysis, not a prediction of legislative results
If the Republican Party retains control of the Senate, it may be more favorable for promoting industry-preferred policy proposals, but it does not guarantee that the bill will pass. Similarly, Democratic control of Congress does not mean that bipartisan cooperation in legislation is impossible.
Meanwhile, regulatory agencies can still take action within their existing authority. Developing rules and issuing staff guidance may help address some specific issues, but their applicability and durability may not compare to formal legislation.
The same election result may affect both the U.S. stock market and crypto industry through different channels. If the presidency and Congress belong to different parties, new fiscal spending plans may be constrained, alleviating some upward pressure on bond yields and supporting stock valuations. However, for crypto firms, legislative gridlock may extend the uncertainty period of market structural rules.
This may lead to a divergence: while financial markets welcome constrained fiscal spending, the crypto industry may be disappointed by the delay in obtaining a stable legal framework. Of course, neither outcome is inevitable; even if Congress is gridlocked, the executive branch and regulatory agencies may still push for policy changes.
What Factors Can Support the Market Continuing to Rise Until 2027?
My baseline judgment is that the outlook for U.S. stocks is generally optimistic, but the upward process will have twists and turns; Bitcoin's short-term trend is more challenging to determine. This judgment is made after referencing history, not directly derived from historical data predictions.
For U.S. stocks, continued growth in corporate earnings and alleviation of pressure from bond yields will help the market rise further. If the momentum can spread from large tech companies to more firms, the recovery will be more convincing. Conversely, regardless of which party controls Congress, persistent inflation or disappointing earnings will weaken the bullish argument.
For Bitcoin, I will focus on whether spot ETFs can continue to attract capital, whether liquidity improves, and whether Bitcoin can hold onto its previous gains during overall market downturns. If funds continue to flow out or financing pressure rises again, it would not be prudent to easily assume that the bear market bottom has passed.
The following three changes are particularly worth noting:
- The Federal Reserve's meeting on December 8-9: The Fed maintained interest rates at 3.75%-4.00% on October 28, with two members voting against it; the market is beginning to factor in the possibility of a rate hike in December. New economic forecasts will help assess whether the pressure from bond yields is easing.
- Earnings and breadth of gains: Whether earnings growth and stock price increases can spread from the currently leading companies to more firms.
- Bitcoin capital flows: Whether institutional demand can maintain for several consecutive weeks, rather than just appearing on individual trading days.
The election results should be observed alongside these indicators and cannot replace them.
Conclusion
The most powerful finding in historical data is the high consistency of U.S. stocks rising after midterm elections. However, it should be noted that the stock market before the 2026 voting is already quite strong.
Bitcoin offers a different insight: in all three complete cycles, the price is higher a year later, but investors have all experienced further declines. This helps understand the risks of holding but is insufficient to support clear predictions for the next cycle.
The election on November 3 will impact the future policy environment. Whether the market can maintain recovery into 2027 ultimately depends on subsequent corporate earnings, liquidity, and capital flows.
Main References
BlackRock - How History Views the 2026 Midterm Elections and Market Performance
Edward Jones - Midterm Elections and the Market: Historical Lessons and Current Considerations
Binance Research Weekly Report - Minefields, Midterm Election Cycles, and Asymmetric Opportunities
U.S. Senate - Minutes from September 15, 2026, and Voting on the CLARITY Act
Federal Reserve - Federal Open Market Committee Meeting Schedule
Polymarket - Balance of Power in the 2026 Midterm Elections
Historical tables and charts: IOSG uses Yahoo Finance S&P 500 daily closing prices (^GSPC, excluding dividends) and CoinMetrics BTC PriceUSD data for calculations.
免责声明:本文章仅代表作者个人观点,不代表本平台的立场和观点。本文章仅供信息分享,不构成对任何人的任何投资建议。用户与作者之间的任何争议,与本平台无关。如网页中刊载的文章或图片涉及侵权,请提供相关的权利证明和身份证明发送邮件到[email protected],本平台相关工作人员将会进行核查。


