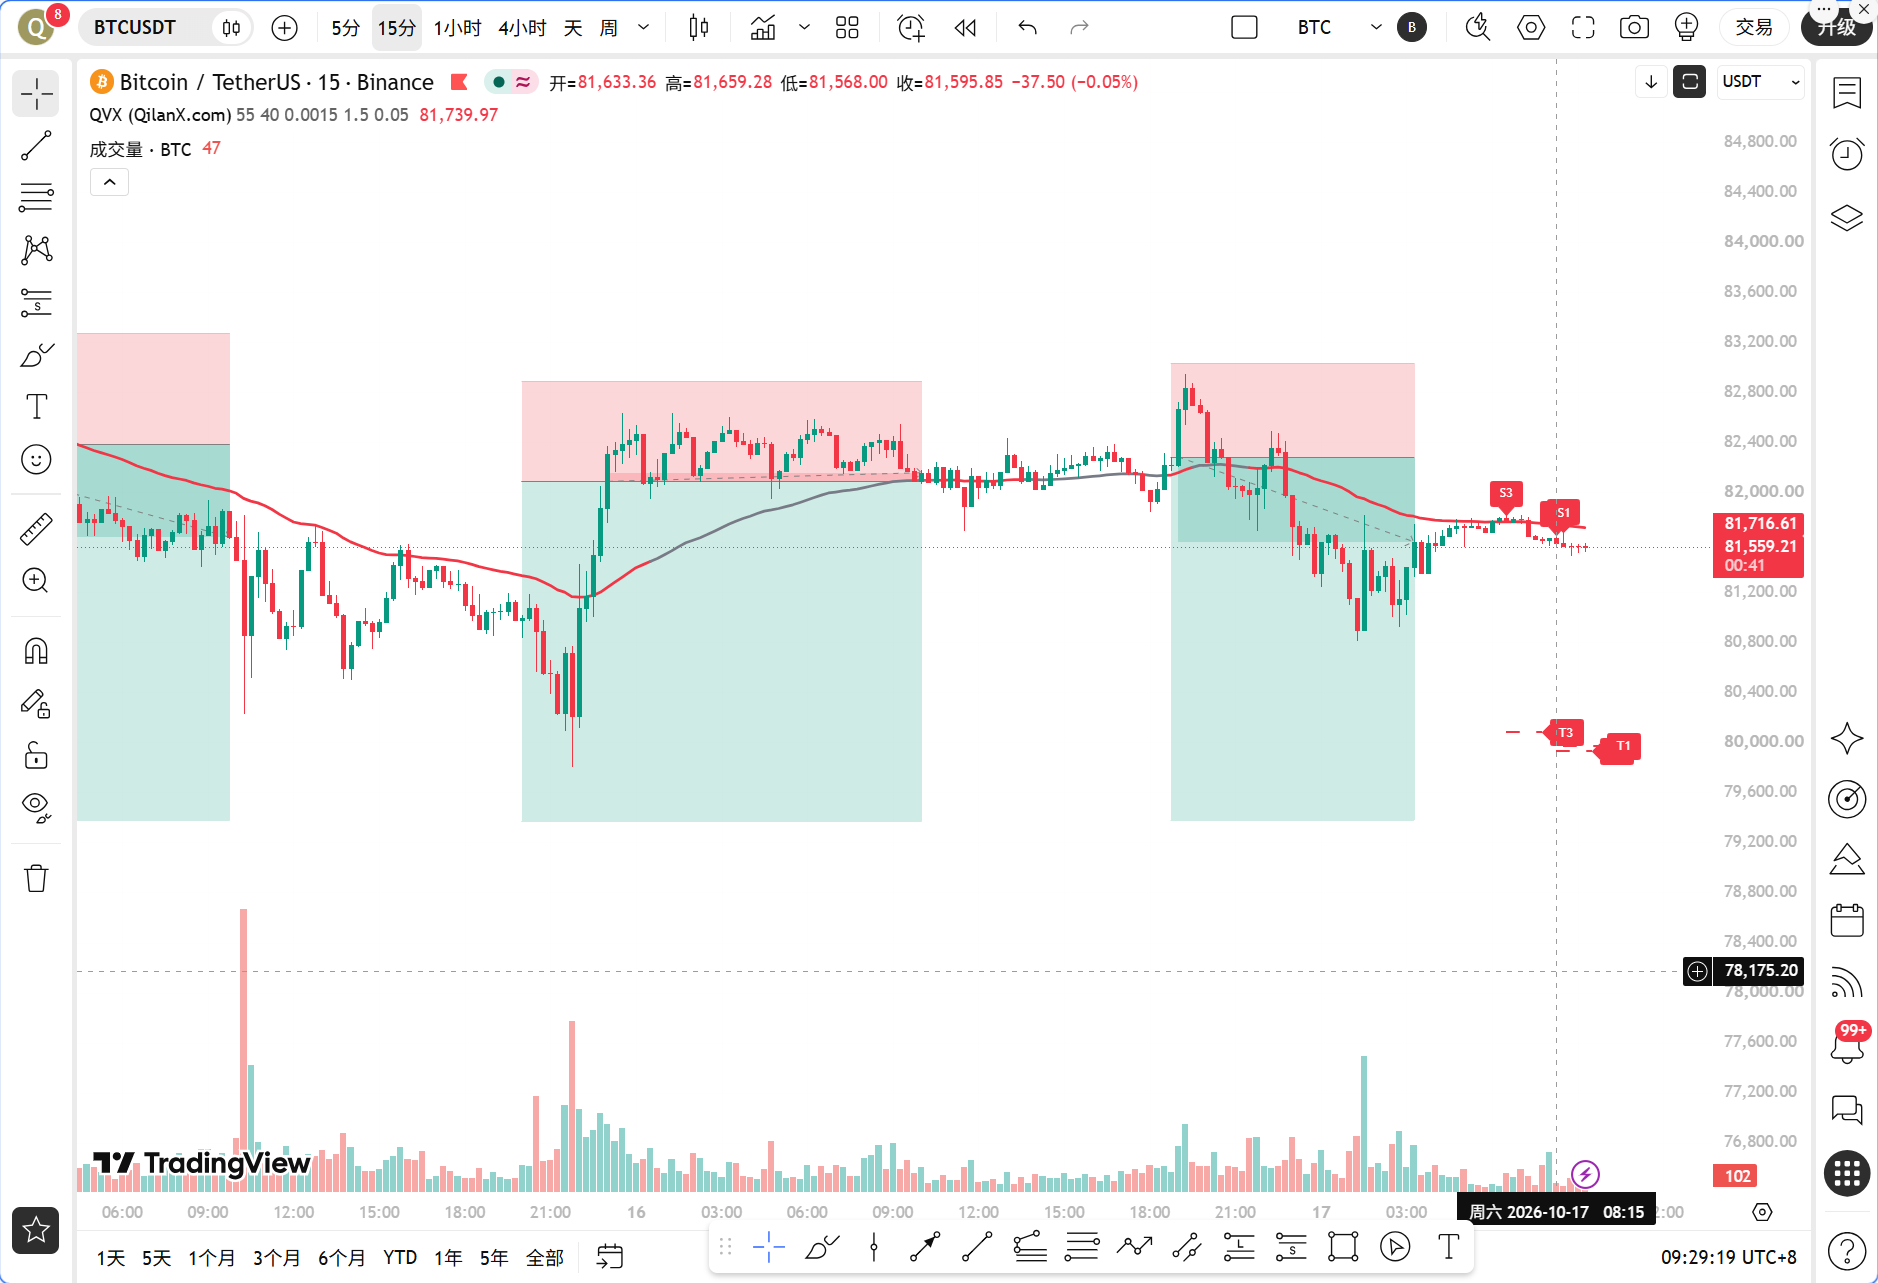
First, let's mention two major points. The first point is that MSTR plummeted 9% in a single day, and new MSCI regulations may lead to its removal from the index. If this happens, it could trigger passive selling pressure at a level of billions, which would be a concrete drag on market sentiment for BTC. The second point is that Brent crude oil has exceeded 112 USDT, rising 3.6% in 24 hours. The surge in oil prices exacerbates inflation concerns, putting pressure on risk assets and interest rate cut expectations. These two negative factors contributed to a gloomy Friday in US stocks, with the Nasdaq dropping over 2%, which also pressured the crypto market. After BTC fell below 81,000 USDT, it is currently struggling around 81,577 USDT. Qinglan has repeatedly emphasized in the Qinglan Crypto Classroom that when macro sentiment and capital flow resonate downwards, one should not hastily catch falling knives.
The current time is October 17, 09:28, with the latest BTC quote at 81,577 USDT. The decline over the past 24 hours is 0.94%, and the fear and greed index is at 55, which is in a neutral range. However, neutral does not mean safe; it only indicates that the market has not yet reached a state of extreme panic selling. If key support is broken, the fear index could still decline significantly. In the past 4 hours, the total liquidation across the network was 157 million USD, with long positions accounting for 141 million. The large-scale liquidation of long positions indicates that short-term selling pressure has been concentrated and released in one wave. However, whether this means the selling pressure has ended needs to be observed in the next few hours regarding volume and price performance.
Now, let’s look at the status of multiple timeframes. On the daily level, MA5 is at 82,057.83, MA10 at 82,329.06, and MA30 at 83,578.38. The current price of 81,577 has dropped below all daily moving averages. The daily MACD bar value is -514.41, with DIF at 109.93 and DEA at 624.34, indicating that bearish momentum continues to expand. The daily RSI is at 39.07, still with space from overselling but already weakening. On the 4-hour level, MA5 is at 81,755.19, MA10 at 82,024.06, and MA30 at 82,496.59, with the price also running below the moving averages. The 4-hour MACD bar value is -19.07, and both DIF and DEA are negative, with an RSI of 47.77, which is in a weak neutral region. The 1-hour level is the core reference period of the Qinglan TPV system, with MA5 at 81,645.81, MA10 at 81,534.57, and MA30 at 81,950.77. The price is entangled near MA5 and MA10 but suppressed by MA30, with the 1-hour EMA55 at 81,959.31, which is the most important boundary between bulls and bears at present. On the 15-minute level, MA5 is at 81,576.71, MA10 at 81,618.07, and MA30 at 81,591.56, with the three lines glued together. The MACD bar value is -13.34, and RSI is at 36.98, again showing a short-term weakness.
Now we will verify the signals one by one using the TPV system. First, the EMA55 condition. The current price is 81,577, and the 1-hour EMA55 is at 81,959.31, which clearly places the price below EMA55. In the past 8 hourly candles, the closing price was greater than EMA55 0/8 times, and crossover occurrences were 0, indicating that the price has closed below EMA55 for 8 consecutive hourly candles, fully meeting the criteria for a bearish trend area. Second, the pattern condition. From the recent candle structure, there has been some rebound after the price touched a low, but the rebound strength is limited, and no effective bottom formation or volume stagnation signal has emerged. Instead, multiple upper shadows have appeared during the rebound, indicating heavy selling pressure above. Third, the momentum condition. The 1-hour MACD bar value is -14.25, with DIF at -118.07 and DEA at -103.82. DIF has crossed below DEA, forming a dead cross. Although there are no obvious signs of a shortening bar value, the RSI is at 29.52 and has entered the oversold area. Here, Qinglan wants to particularly remind that RSI overselling does not equal an immediate reversal; in a one-sided downward trend, the RSI can remain in the oversold area for a long time. The TPV system requires that RSI rises from below 30, and currently, it has just touched 29.52, with no clear upward movement seen. In summary, the EMA55 condition is fully satisfied, the pattern condition is not satisfied, and the momentum condition is partially satisfied but lacks confirmation signals. Therefore, the current TPV system indicates a determination in the bearish trend area, but all three complete conditions for shorting have not yet triggered, and confirmation signals must wait for rebounds to meet resistance.
Next, let’s look at on-chain and capital flow. The fear and greed index is at 55, neutral. BTC has dropped 0.94% in 24 hours, which is not a large drop, but the downtrend pattern is evident. Short-term holders hold 4.08 million BTC, a new high since June, with short-term holder costs around 74,900 USDT. This position is crucial; if the price continues to decline and approaches this area, it may trigger concentrated selling pressure from short-term holders. In the past 4 hours, there was a liquidation of 157 million USD, with long positions accounting for 141 million, and long positions have been wiped out. However, Qinglan's experience is that after a large-scale liquidation once, there are often aftershocks; do not rush to catch the bottom. If expectations for MSTR's removal from the index continue to ferment, the anticipated billions in passive selling pressure will continue to suppress market sentiment. In terms of oil prices, Brent has broken 112 USDT, inflation concerns are intensifying, and expectations for Fed interest rate cuts are suppressed, which is overall unfavorable for risk assets. ETH has fallen below 2,400 USDT, down 2.22% in 24 hours, showing a weak downward trend along with BTC, with no signs of independent strength.
Key attack and defense levels sorted. The first resistance level above is at the 1-hour EMA55 of 81,959.31, which is the boundary of the TPV system between bulls and bears. The price must close above this position for two consecutive hourly candles to consider a possible trend change. The second resistance level above is near the 1-hour MA30 of 81,950.77, which almost coincides with EMA55, forming a pressure resonance. Further up are the 4-hour MA5 at 81,755.19 and the daily MA5 at 82,057.83. The first support level below is near the intraday low at the integer mark of 81,000 USDT; this position has already been broken once. If it tests again and cannot hold, we will look at the short-term holder cost area of 74,900 USDT. There is also a psychological support at the integer mark of 80,000 USDT in between.
Trading thoughts. The direction is clearly in a bearish trend, and the TPV system determines it to be in a bearish area, so we will prioritize short opportunities and not actively go long. Entry condition: Wait for the price to rebound to near the 1-hour EMA55, around 81,950 to 81,960 USDT, and then observe long upper shadows or peak formation encountering resistance and similar shapes while the 1-hour MACD bars shorten for two consecutive periods or the RSI retreats from high positions; enter a short position when all three resonate. If the price descends directly without providing a rebound opportunity, do not chase shorts; wait for a confirmation after a pullback before acting. Stop-loss setting: After entering a short position, set the stop-loss about 1% above the 1-hour EMA55, approximately around 82,800 USDT; if the price closes above EMA55 for two consecutive hourly candles, the bearish logic is invalid, and one must exit. Target levels: The first target is the integer level of 81,000 USDT, the second target is the psychological level of 80,000 USDT, and the third target is the short-term holder cost area of 74,900 USDT. In terms of risk-to-reward ratio, based on an entry at 81,950, stop-loss at 82,800, and target at 80,000, the risk is about 850 USDT, with a reward of about 1,950 USDT, yielding a risk-to-reward ratio exceeding 2 to 1, aligning with the trading principles emphasized continuously in the Qinglan Crypto Classroom to act in accordance with the trend and strictly control risks.
Risk warning: The expectation of MSTR’s removal from the index and the surge in oil prices belong to the bearish side of macro sentiment. If there is an unexpected positive event that reverses sentiment, shorts should exit decisively and not hold onto positions.
Follow the Qinglan Crypto Classroom for more trading opportunities! Visit our official website at www.qinglan.org
📊 Qinglan TPV Trading Strategy Backtest Reference
🕒 Last backtest time 10-17 07:00:02
Total analysis: 4462 Backtests: 4454 Accuracy: 77.7% (3460/4454)
免责声明:本文章仅代表作者个人观点,不代表本平台的立场和观点。本文章仅供信息分享,不构成对任何人的任何投资建议。用户与作者之间的任何争议,与本平台无关。如网页中刊载的文章或图片涉及侵权,请提供相关的权利证明和身份证明发送邮件到[email protected],本平台相关工作人员将会进行核查。