Written by: Rita
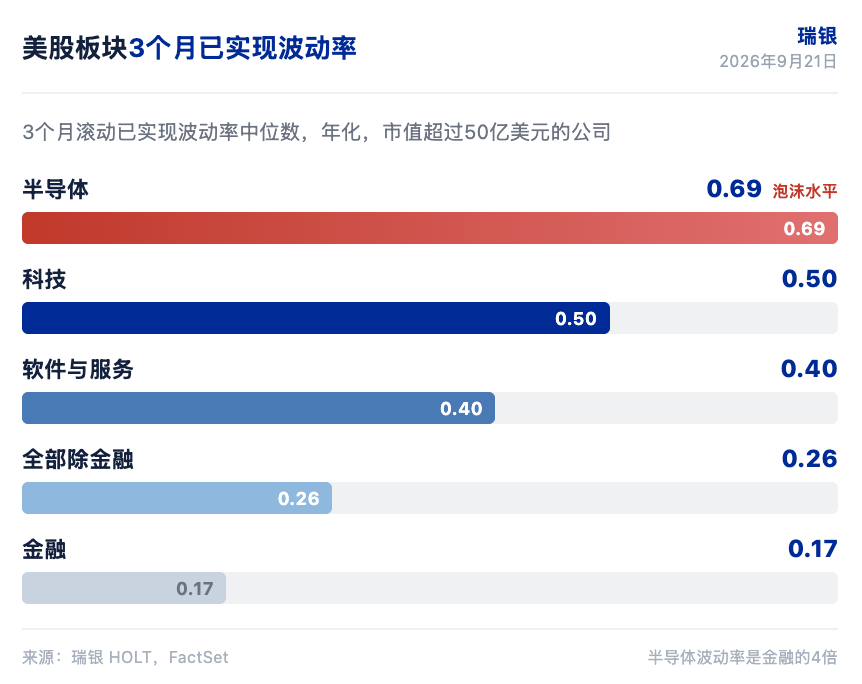
The market is still concentrated on betting on US tech stocks, but UBS has marked tech volatility at levels seen during the internet bubble. In the HOLT Global Overview report released by UBS on September 21, 2026, it stated that the median realized rolling volatility for semiconductors has reached 0.69 over three months, 0.5 for the tech sector, and 0.4 for software and services. The high capital expenditures of major firms are increasing the dilution risk for cash flow return on investment (CFROI, which measures the efficiency of a company in generating cash returns from capital). In a high interest rate environment, the concentration of US tech stocks has become a major risk, and defensive sectors as well as low volatility stocks provide alternative opportunities.
UBS's core judgment is that the tailwind of a loose monetary environment has disappeared, and companies relying on external financing are facing stricter scrutiny. The concentration of US tech stocks and growth stocks is the highest and carries the greatest risk. Value stocks, defensive sectors, and low volatility stocks each have limitations, but their relative attractiveness is rising.
Tech volatility returns to bubble levels
Semiconductor volatility is significantly higher than other sectors. The median realized rolling volatility for the financial sector is only 0.17, while the rest excluding financials is 0.26. The tech sector's 0.5 and semiconductor sector's 0.69 indicate that the market's questioning of the long-term profitability potential of AI-related companies is intensifying.
Capital expenditures by major firms have significantly increased. In 2015, they accounted for less than 5% of total capital expenditures in the US, but are expected to exceed 30% by 2026, with absolute amounts rising from less than $100 billion to over $1.2 trillion. UBS noted that the surge in capital expenditures presents a downside risk to CFROI dilution, as rising yields exacerbate this risk.
CFROI improving across all regions
North America has the highest forecasted CFROI at about 12%, while emerging markets, Asia-Pacific excluding Japan, the UK, and Europe excluding the UK and Japan are all showing improvement trends. At the industry level, information technology, healthcare, financials, consumer staples, and communication services have forecasted CFROI values above the 10-year median.
CFROI improvements combined with price fluctuations have led to compressed valuation multiples. The emerging market index performed strongest, but the CFROI improvement over 12 months was also the largest. The price increases in the US and Japan have outpaced the CFROI improvements, resulting in relatively smaller valuation compressions. UBS believes that the high valuations and tech concentration in the US market make it more sensitive to rising interest rates.
Value stock opportunities in Europe and the UK
Value stocks in the US and Japan are no longer cheap compared to historical levels, with forecasted CFROI often at cyclical peaks. Value stocks in Europe and the UK are relatively more attractive. Among European value stocks, those with significant CFROI improvements include AstraZeneca, BNP Paribas, Axa, Prysmian, BASF, and Munich Re.
UBS's screening criteria for European value stocks include: a market capitalization of over $5 billion, positive CFROI changes, valuation rankings in the top 60%, historical valuation rankings in the top 50%, and positive fixed charge coverage ratios. For US investors, this portion can serve as a reference to diversify tech concentration, but care must be taken with the currency and liquidity differences in regional allocations.
Defensive sector valuations are cheap
High-quality defensive sectors, particularly consumer staples and healthcare, are cheap compared to historical valuations. These sectors have relatively high CFROI, but valuation premiums have disappeared. The high-quality consumer staples and healthcare stocks screened by UBS include UnitedHealth, Nestlé, Amgen, Novo Nordisk, Anheuser-Busch InBev, Unilever, Colgate, Kimberly-Clark, General Mills, and Kroger.
Screening criteria include: market capitalization over $10 billion, quality rankings in the top 60%, momentum rankings in the top 40%, and HOLT P/B relative to historical rankings in the top 50%. These stocks provide defensiveness, but companies facing structural pressure in CFROI outlook should be avoided. For US investors, quality targets in healthcare and consumer staples are a direct choice to reduce tech exposure.
Highly leveraged US stocks are more sensitive to interest rates
Companies with fixed charge coverage ratios below 1 are at the highest risk in a rising interest rate environment. The list of US stocks screened by UBS includes Alphabet, Microsoft, Amazon, SpaceX, Tesla, Oracle, Blackstone, Cloudflare, Snowflake, and Air Products. These companies rely on external financing and high capital expenditures, with fixed charge coverage ratios below 1, indicating that operating cash flows are insufficient to cover fixed expenses such as interest and lease payments.
UBS also provided a list of US stocks with contradictory CFROI and harsh valuations, including Microsoft, Berkshire Hathaway, Qualcomm, Northrop Grumman, Sensata Technologies, and ECI. These stocks face downward pressure on CFROI and have high valuation demands, requiring cautious handling. There is overlap between the two lists, with Microsoft appearing on both, indicating that its valuation and cash flow structure are under dual pressure in a rising interest rate environment.
If inflation data continues to exceed expectations, forcing central banks to tighten further, whether the concentration of US tech can continue to support valuations will be a key test of the resilience of this cycle.

Disclaimer
This article is a compilation and interpretation by Chao Xiang Research of third-party brokerage research reports (UBS, September 21, 2026), combined with public market information. The ratings, target prices, earnings forecasts, and related judgments cited in this article are the views of the analysts at the brokerage and represent the position of their respective institutions, and do not represent the views of Chao Xiang Research, nor do they constitute any investment advice.
Markets carry risks, and decisions must be made independently. This article should not be used as a basis for buying or selling any securities.
免责声明:本文章仅代表作者个人观点,不代表本平台的立场和观点。本文章仅供信息分享,不构成对任何人的任何投资建议。用户与作者之间的任何争议,与本平台无关。如网页中刊载的文章或图片涉及侵权,请提供相关的权利证明和身份证明发送邮件到support@aicoin.com,本平台相关工作人员将会进行核查。


