Author: Jake Pahor
Translation: Deep Tide TechFlow
Deep Tide Guide: Bitcoin surged against the trend as everyone awaited the September low, regaining its position above the 50-week moving average. This article dissects the historical data from six similar signals since 2012, revealing which four sparked a bull market, which two were traps, and which side this signal is closer to. For investors contemplating whether to bottom fish, this is a key reference backed by data.
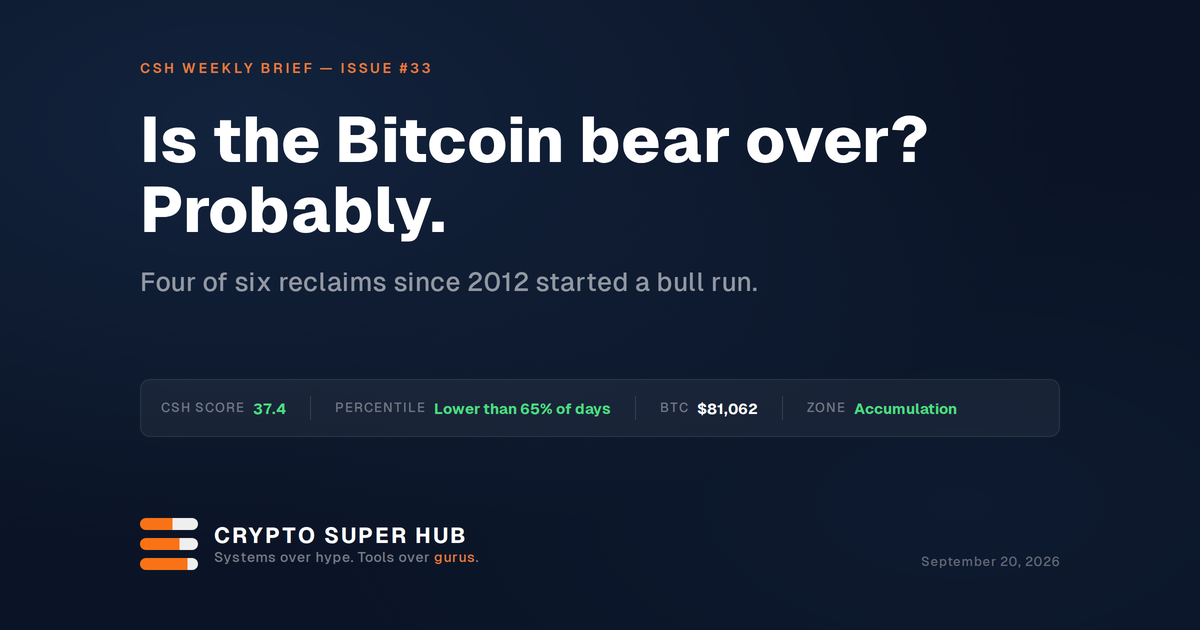
Six times above the moving average, four times sparked a bull market
Everyone I spoke to this month is waiting for the September low. Bitcoin is moving in the opposite direction.
It has ample reasons to drop. At midnight on Thursday Beijing time, the Federal Reserve raised interest rates for the first time since 2023. The next day, the Bank of Japan raised its rates to a 31-year high. The U.S. Senate nearly failed to pass the cryptocurrency market structure bill by just one vote. Bitcoin saw the largest single-day outflow since June from spot ETFs. Then, on Friday Beijing time, Bitcoin rose over 5% in one day, liquidating about $190 million worth of short positions in an hour, and by Sunday it had regained the 50-week moving average: the first time since last November.
What people overlook is what happened every time it crossed this line in the past. So I reviewed our scoring history, pulling out all instances since 2012 where "Bitcoin first closed a weekly candle above the moving average after spending a decent time below the 50-week moving average." There were six occurrences in total. Four ignited a bull market. Two were traps. The signals distinguishing them are below, along with this case.
I also changed my plans this week. The reason is detailed at the end of the article.
CSH Risk Dashboard
The CSH score closed this week at 37.4, compared to 36.8 last Sunday. It is lower than 65% of days in history.
Bitcoin: The historical Sunday price was $81,062, approximately $113,800 AUD. It rose 4.9% this week.
The 50-week moving average is around $78,800 (TradingView, Bitstamp weekly, Sunday). Bitcoin is currently 3% above the moving average. The weekly candle closes at 10 AM Beijing time on Monday.
Support below: Bull market support band, approximately $70,200 to $72,600 on the same chart. Today, a CSH score of 30 corresponds to around $69,700, so the support band and score 30 have overlapped again.
My plan: Keep waiting, but widen the net. The current buy-in range is CSH scores from 10 to 35 (previously it was 10 to 30 before Tuesday). A score of 35 corresponds to about $76,800 now. I have not placed any orders since August.
What this adjustment means: It is 4 points away from the next buying opportunity, about $4,000. If we wait for the support band that many are anticipating to retest, that corresponds to a score of about 30, and the plan would be to buy on Monday. If that doesn't happen, I'll follow the planned pace with the cash I set aside for September lows and enter when scores allow. I will not declare the bear market over with just one closing. Continuous weekly candles closing above the 50-week moving average is the signal; that is the real test. But this week I stopped betting on lower lows, and the reasons follow.
Six times crossing above the moving average, four times were bottoms
I still remember the feeling in March 2013. Bitcoin just closed a weekly candle at around $27,000, back above the 50-week moving average, and I was very frustrated with myself. My self-managed pension missed the low of $15,700 on November 2022 due to sluggish processes, and now the price was already up 70%. I thought I was too late. Later, Bitcoin almost quintupled.
This is the trap of "crossing back above the moving average." It always appears after a rebound, making one feel perpetually late. So I wanted to clarify what this historically means.
The setup is simple. Weekly candles closing since 2012. Crossing back above the moving average means: Bitcoin first closes a weekly candle above the moving average after spending at least a month below the 50-week moving average. I then measured what happened next.
In October 2015, the CSH score was 19.5. It maintained above the moving average for 134 weeks. It increased 2.3 times a year later.
In May 2019, the score was 47.5. It maintained for 31 weeks. It increased 1.5 times a year later.
In January 2020, the score was 39.9. It dropped back below the moving average within 8 weeks, and then the COVID crash brought the price down 35% below where it had crossed back above the moving average. A trap.
In May 2020, the score was 39.6. It maintained for 62 weeks. It increased 6.3 times a year later.
In April 2022, the score was 65.4. It fell back below the moving average in the second week and subsequently dropped 58%. A trap, the most memorable one for everyone.
In March 2023, the score was 41.9. It maintained for 137 weeks until last November. It increased 2.5 times a year later.
Four were genuine, two were traps. The true signals maintained above the moving average for at least 31 weeks and never closed lower than the closing price at the time of crossing back above the moving average by more than 7% within the next six months. The traps fell back within two months.
The weekly candle itself tells you less than I imagined. The 2023 return above the moving average was very strong, rising 32% in one week, closing 17% above the moving average. But the signal from May 2020, which initiated a six-fold rally, closed just 2% above the moving average. The trap in 2022 closed only 0.5% above. A large increase does help, but it is not the critical distinction.
What truly distinguishes true signals from traps are two things.
First, how long Bitcoin stayed below the 50-week moving average. Before true signals emerged, Bitcoin spent about a year below the moving average: 62 weeks, 49 weeks, 49 weeks, the COVID instance was 7 weeks (that was a crash plus a V-shaped recovery, not a bear market). The traps appeared after 4 weeks and 13 weeks below the moving average. If a market stays below the 50-week moving average for a year, it shows that it has endured enough time, and a year is roughly the duration Bitcoin bear markets take: the last three bear markets took 13 months, 12 months, and 12 months respectively, and crossing above the moving average appeared four to nine months after the low. If a market only stays below the moving average for a month, those processes still have not occurred.
Second, the CSH score of that day. Each time a true signal appeared, the score ranged from 19.5 to 47.5, meaning Bitcoin was still historically cheap when it turned upward. The trap in 2022 appeared at 65.4, which is historically on the expensive side. That was a bear market’s bear market rebound, as the score had already made clear.
This bear market's depth indicator is somewhat mixed. Three major bear markets dropped 77% to 86% from top to bottom. The two shallower ones, in 2019 and due to COVID, dropped around 50%, and of those two, one had a true return above the moving average while the other was a trap.
This time's situation
Bitcoin has stayed below the 50-week moving average for 45 weeks. The CSH score is 37.4. On these two truly important signals, this time looks real.
The low is 53% lower than the October peak, which aligns with the characteristics of a shallow bear market, and the candle this week is relatively mild: it rose 5% in one week, 3% above the moving average. The traps also appeared this way. The May 2020 instance was similar.
One number has led me to stop waiting. Each time a true signal appeared, Bitcoin was already 65% to 80% higher than the low. Each signal made one feel late on that day. A year later, they increased 1.5 to 6.3 times. This week, we are only 38% higher than the July low.
So the plan is this: If a weekly close falls back below the 50-week moving average within the next eight weeks, it will be a trap; historically, both traps failed within this window. If that does occur, the plan will continue to buy below score 35, and I will stop talking about bull markets. If there are consecutive closes above the moving average, I will publicly say the bear market is over, yet the plan will miss part of this rally. This has always been the trade-off I chose. What I will not do is hold on to a pile of cash waiting for a price that history says is unlikely to return. Even at $81,000, the CSH score still indicates that Bitcoin is historically cheap: 37.4 is lower than 65% of days since 2013. You don’t need to catch the exact lowest point to make good money.
Jake’s Workbench
Three things this week.
First, I changed the plan. The plan buys Bitcoin when the CSH score is below 30. Since August 22, the score has remained between 30 and 39, and the plan did nothing while Bitcoin rose from $78,000 to $81,000, without tracking it. So I went back to score history and asked which buy threshold ultimately held the most Bitcoin, keeping the selling rules unchanged, choosing three different starting points: November 2017, 2019, and the November 2021 peak. Every time below 35 was a winner. Below 30 takes too long to wait. Since the beginning of 2023, the score has been below 30 for 134 days, and below 35 for 254 days, with nearly double the buying days for the same amount spent. Selling starting at 80 was also the first or tied for the first in each window, so that side of the plan remains unchanged. The range is now 10 to 35. Changing the plan took 20 seconds, while letting it sit idle for a month made me realize I needed to adjust.
Second, my own trading. The rebuilt today's page plotted every buy I made against the score of that day. I am proud of those falling in the 20 to 30 range. Also those points in 2024 and 2025 falling in the 70 to 80 range, when the score indicated Bitcoin was historically expensive, and I should have taken profits rather than added positions. The tool is one I made myself, and it still stings. That is exactly its purpose.
Third, two dates. On September 6, I wrote down two conditions to change the idle money rules: 12 months counted from the peak on October 7, 2025, and a weekly close staying above the 50-week moving average. The first condition arrives 17 days later. The second is being tested. Both fall within the same two-week window. If both are satisfied, idle funds will stop waiting for lower lows and will enter as per the planned schedule.
Product note: This week the app rebuilt the today's page. It succinctly states your plan and the next order, displaying each transaction you imported against the score, along with a trading file upload capability that supports exported files from major Australian and global exchanges.
The Federal Reserve raised rates by 25 basis points to 3.75% to 4.00% on Thursday morning our time, with a vote of 12 to 0, marking the first rate hike since 2023. Another hike in December has already been factored into the price. Bitcoin's weekly low occurred before the resolution. It rose during the decision period.
The Bank of Japan raised rates to 1.25% on Friday, the highest rate in 31 years. The same story.
The CLARITY Act, the U.S. cryptocurrency market structure bill, failed procedurally in the Senate on Tuesday with a vote of 49 to 50. Bitcoin broke below $75,000 that day, but returned above $81,000 by Friday.
The Bitcoin spot ETF: A $450 million outflow occurred on the day of the Senate vote, marking the largest single-day outflow since June. Two days later, there was an inflow of $159 million.
On Monday, September 21, at 10 AM Australian Eastern Time: Weekly close. Closing above $78,800 confirmed a return. The closing of the following week will be even more important.
On Thursday, September 24, at 11:30 AM: Australian employment data (ABS).
On Friday, September 25, at 6 PM Australian Eastern Time: Deribit quarterly options expiry, around $14.7 billion in Bitcoin options, with the largest open interest concentrated around $72,000. Another reason for testing the support range.
On Tuesday, September 29: Australian Federal Reserve interest rate decision.
On Wednesday, September 30, at 11:30 AM: Australian monthly inflation (ABS).
On Thursday, October 1, at 10:30 PM Australian Eastern Time: U.S. inflation (PCE).
On Friday, October 2, at 10:30 PM Australian Eastern Time: U.S. employment report.
On Wednesday, October 7: The peak of twelve months.
No matter how these numbers move, the answer to the plan is the same: buy below 35, sell above 80, and wait in between.
If the market proves you wrong this month, don’t fight it. The early stage of a bull market and the late stage of a bear market are when the maximum risks are to be taken, and it always feels different at the moment. The way to truly do this, when you have a job and family and lack time to watch the market, is to set the rules now and let the schedule make decisions for you.
免责声明:本文章仅代表作者个人观点,不代表本平台的立场和观点。本文章仅供信息分享,不构成对任何人的任何投资建议。用户与作者之间的任何争议,与本平台无关。如网页中刊载的文章或图片涉及侵权,请提供相关的权利证明和身份证明发送邮件到support@aicoin.com,本平台相关工作人员将会进行核查。


