Author: David, Deep Tide TechFlow

Recently, the popularity of Robinhood on-chain has been obvious, from the explosive growth of major token issuance platforms to the new narrative of "U.S. stocks reflecting memes," with a large influx of speculators and retail investors looking for high odds.
We previously wrote "Robinhood Frenzy: A Comprehensive Collection of Today's Most Gaining Tokens and Projects Worth Noting", which comprehensively reviewed various applications, infrastructure, and memes worth paying attention to on Robinhood.
However, the market changes quickly, and in this "dirt dog trenches" where thousands of new tokens are born in a single day, mastering real-time data is also crucial.
So, our editors have also compiled four Dune dashboards that advanced players and seasoned on-chain drivers are closely monitoring. From macro liquidity to micro smart money trends, helping you establish your own on-chain navigation system.
1. Macro Fundamental Perspective: Is the Money on Robinhood Chain "Flashy" or "Settled"?
Dashboard Link: Robinhood Chain Network Overview
Dashboard Author: @EntropyAdvisors
(The original dashboard has stopped updating, but it includes links to the latest dashboards)
Before diving into any dirt dog, you must first clarify the overall water level of this chain. This dashboard is the best tool for monitoring Robinhood Chain's macro fundamentals and core liquidity indicators.
What You Can See:
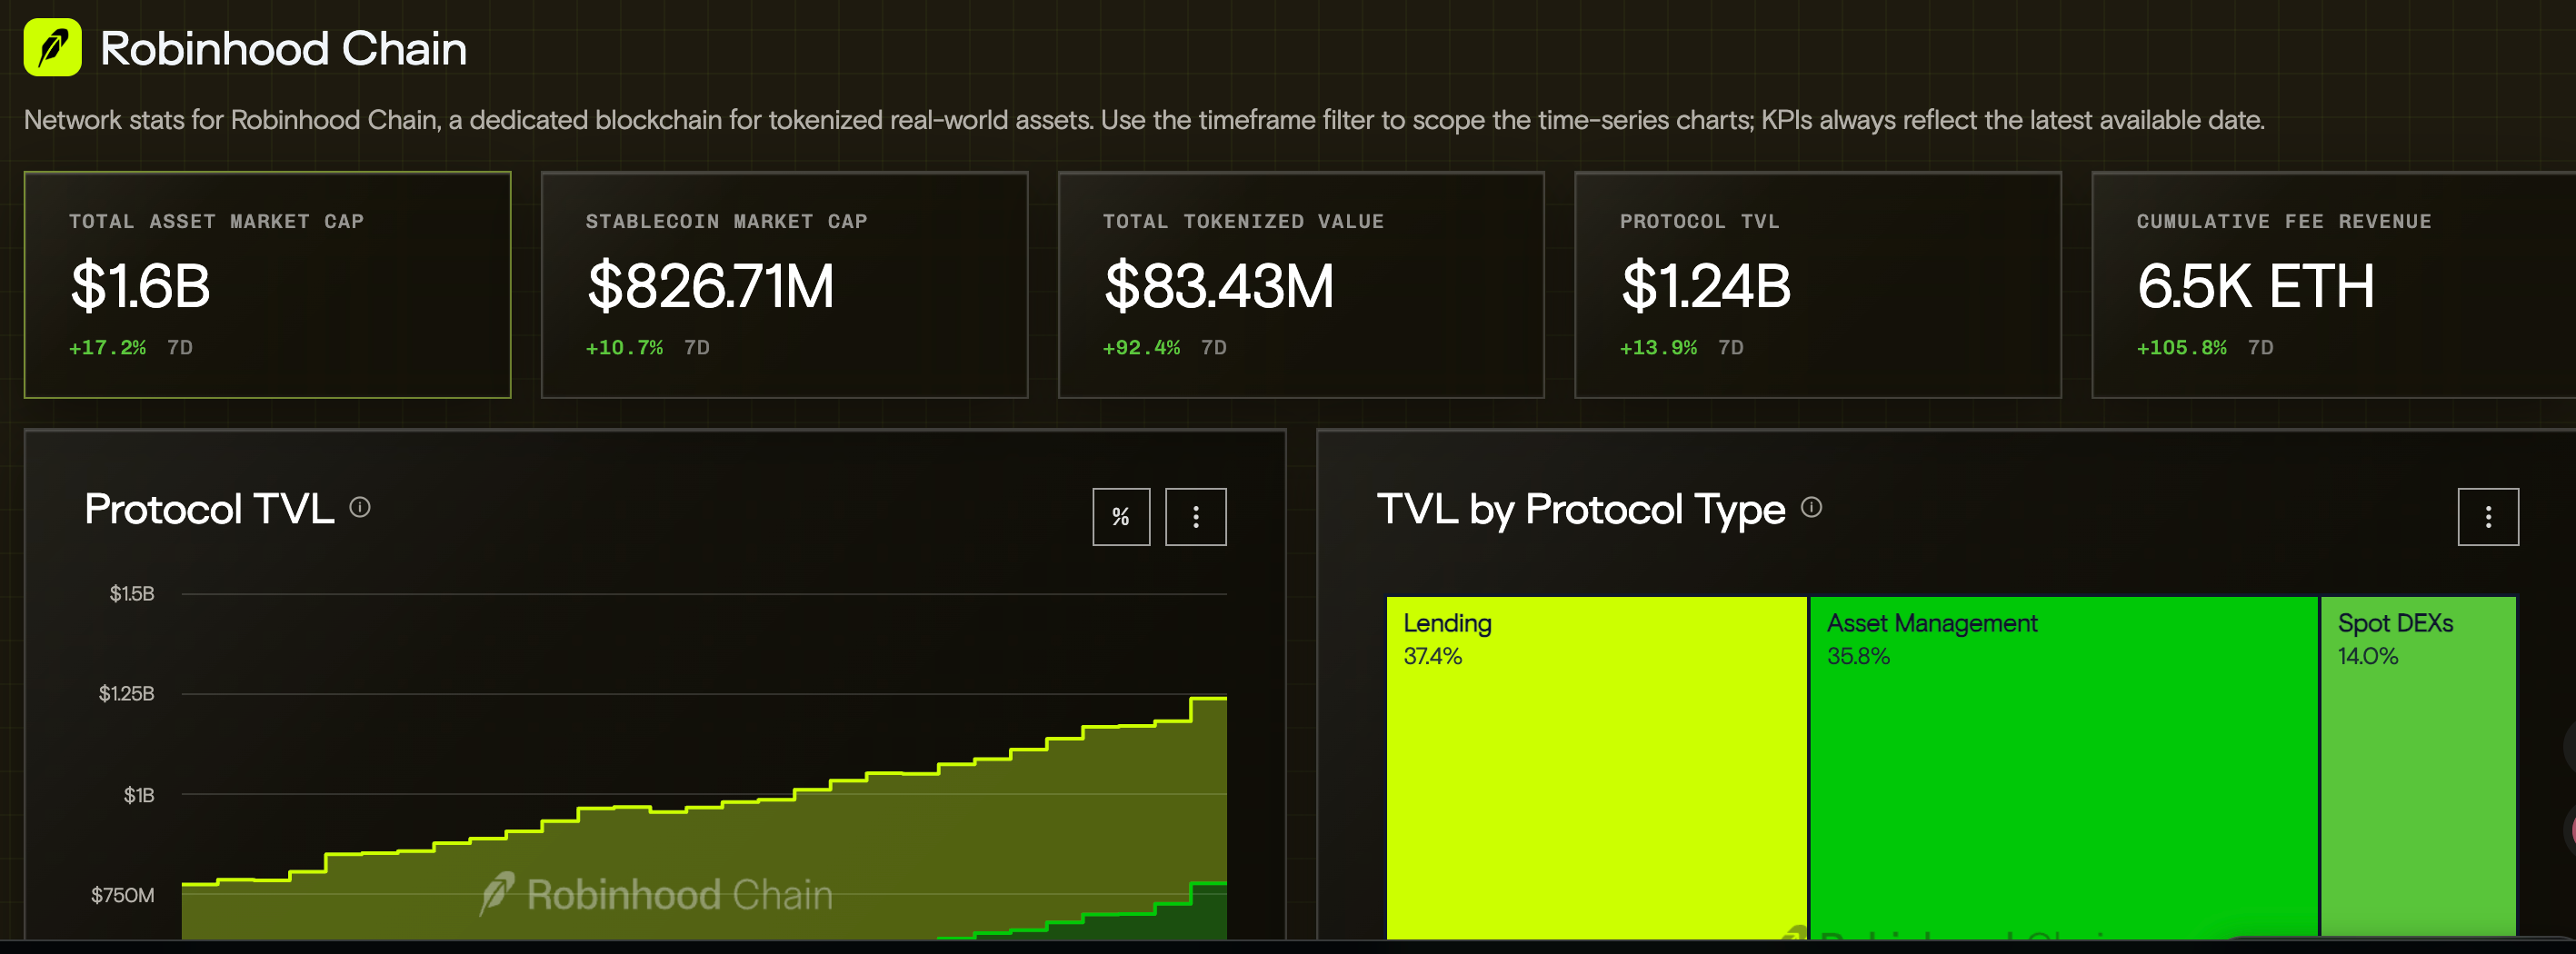
Real-time changes in total protocol TVL (currently about $1.23 billion), total market cap of stablecoins (about $826 million), and RWA tokenized asset scale (about $8.3 million). The underlying data also covers the core lending protocol Morpho and the minting and burning activities of the chain's unique "Stock Tokens."
In-depth Expansion and Practice:
Observe the relative growth rates of TVL and stablecoin market cap. If on-chain meme speculation is booming, but the total market cap of stablecoins does not show significant growth, it indicates a mutual liquidation of funds within the market (PVP); only when stablecoin market cap steadily rises can it prove that real "old money" is continuously flowing in and settling. Additionally, the minting volume of stock tokens is a core observation point to determine whether this chain can bridge the funding channels between Web2 and Web3.
2. Pons Token Issuance Platform Wealth Effect Tracking: Who is Actually Making Real Money?
Dashboard Link: Ponsfamily Official Analysis Dashboard
Dashboard Author: @Adam_Tehc
In the wave of land grabbing, the ones who profit the most are always the ones "selling shovels." As a leading token issuance platform, Pons' data directly reflects the frenzy of on-chain retail investors.
What You Can See:
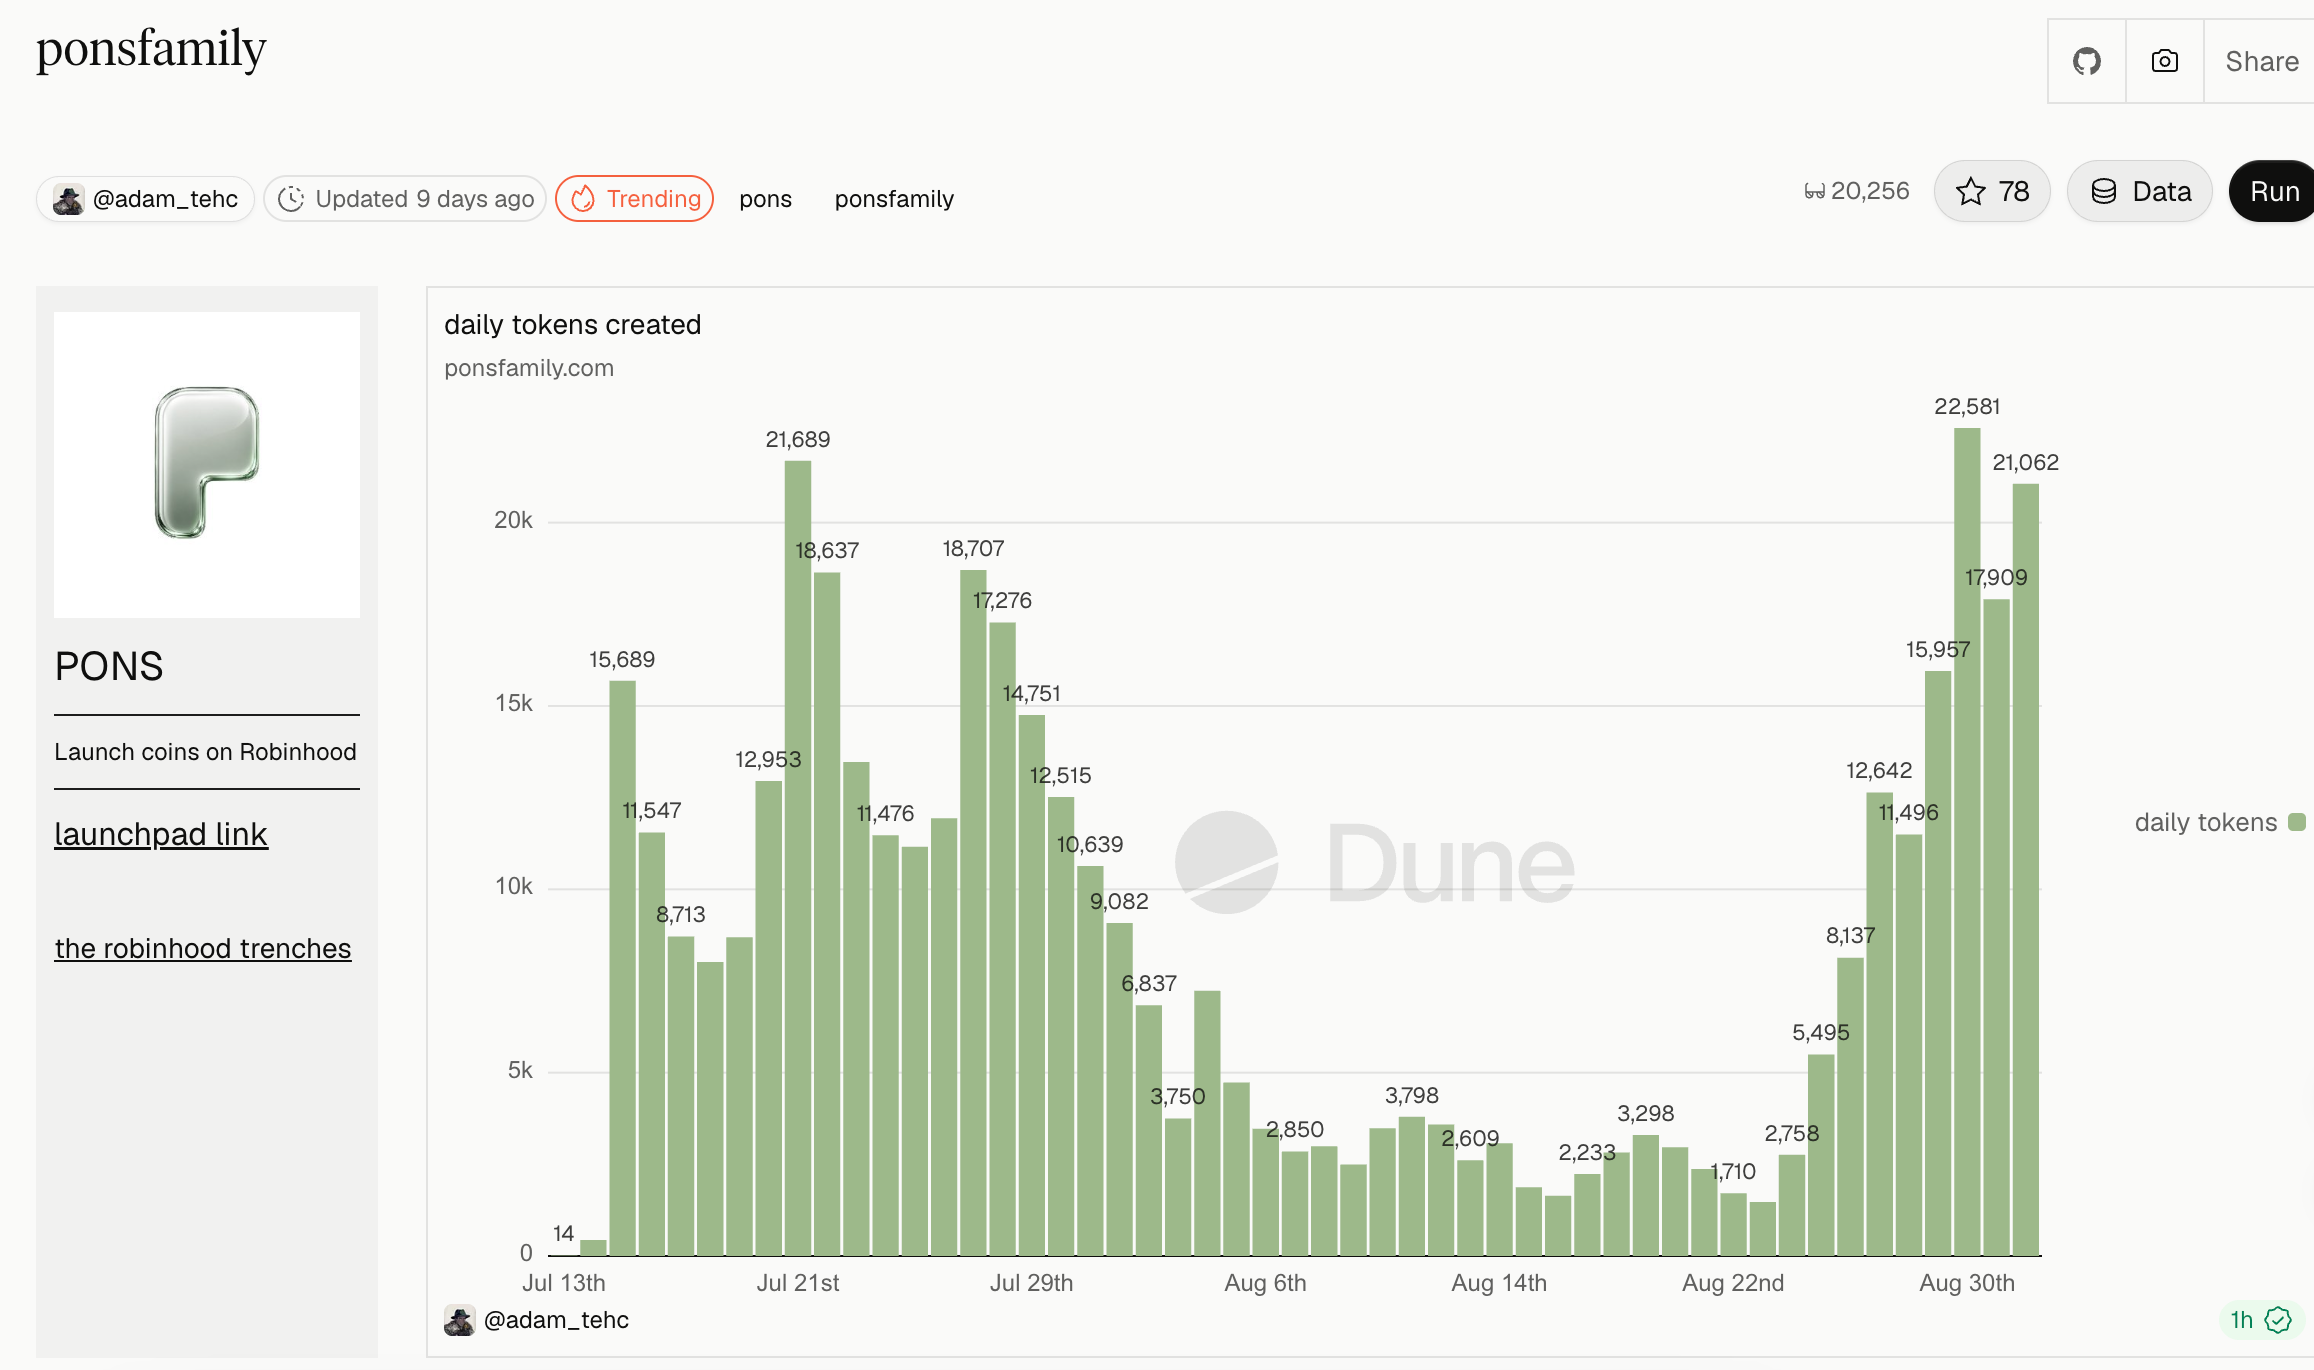
The astonishing total number of tokens created by the platform (over 586,000), as well as the most authentic cash flow indicators—the total protocol income (about $4.93 million) and total earnings for creators (up to $27.7 million). It also includes a trend tracking of daily new token creation.
In-depth Expansion and Practice:
The daily number of newly created tokens (Daily Tokens Created) serves as the most intuitive thermometer for FOMO emotions. When this number experiences a parabolic spike, it usually means market sentiment has peaked, liquidity is extremely dispersed, and chances of winning in token speculation will sharply decline; while when creator income growth slows down, it indicates that the "one wave" liquidation strategy is failing, and the market is beginning to enter a consolidation phase.
3. RWA Combined with Meme Volatility: Robinhood Chain's Unique Narrative Alpha
Dashboard Link: Robinhood Chain Launchpads — RWA-Paired Meme Analysis
Dashboard Author: OKX Wallet @okxweb3wallet
If you treat the Robinhood Chain as another Solana, you have missed its biggest Alpha. This chain is attempting to combine U.S. stock assets (RWA) with meme sentiment, which is currently the funding flow that needs the closest attention.
What You Can See:
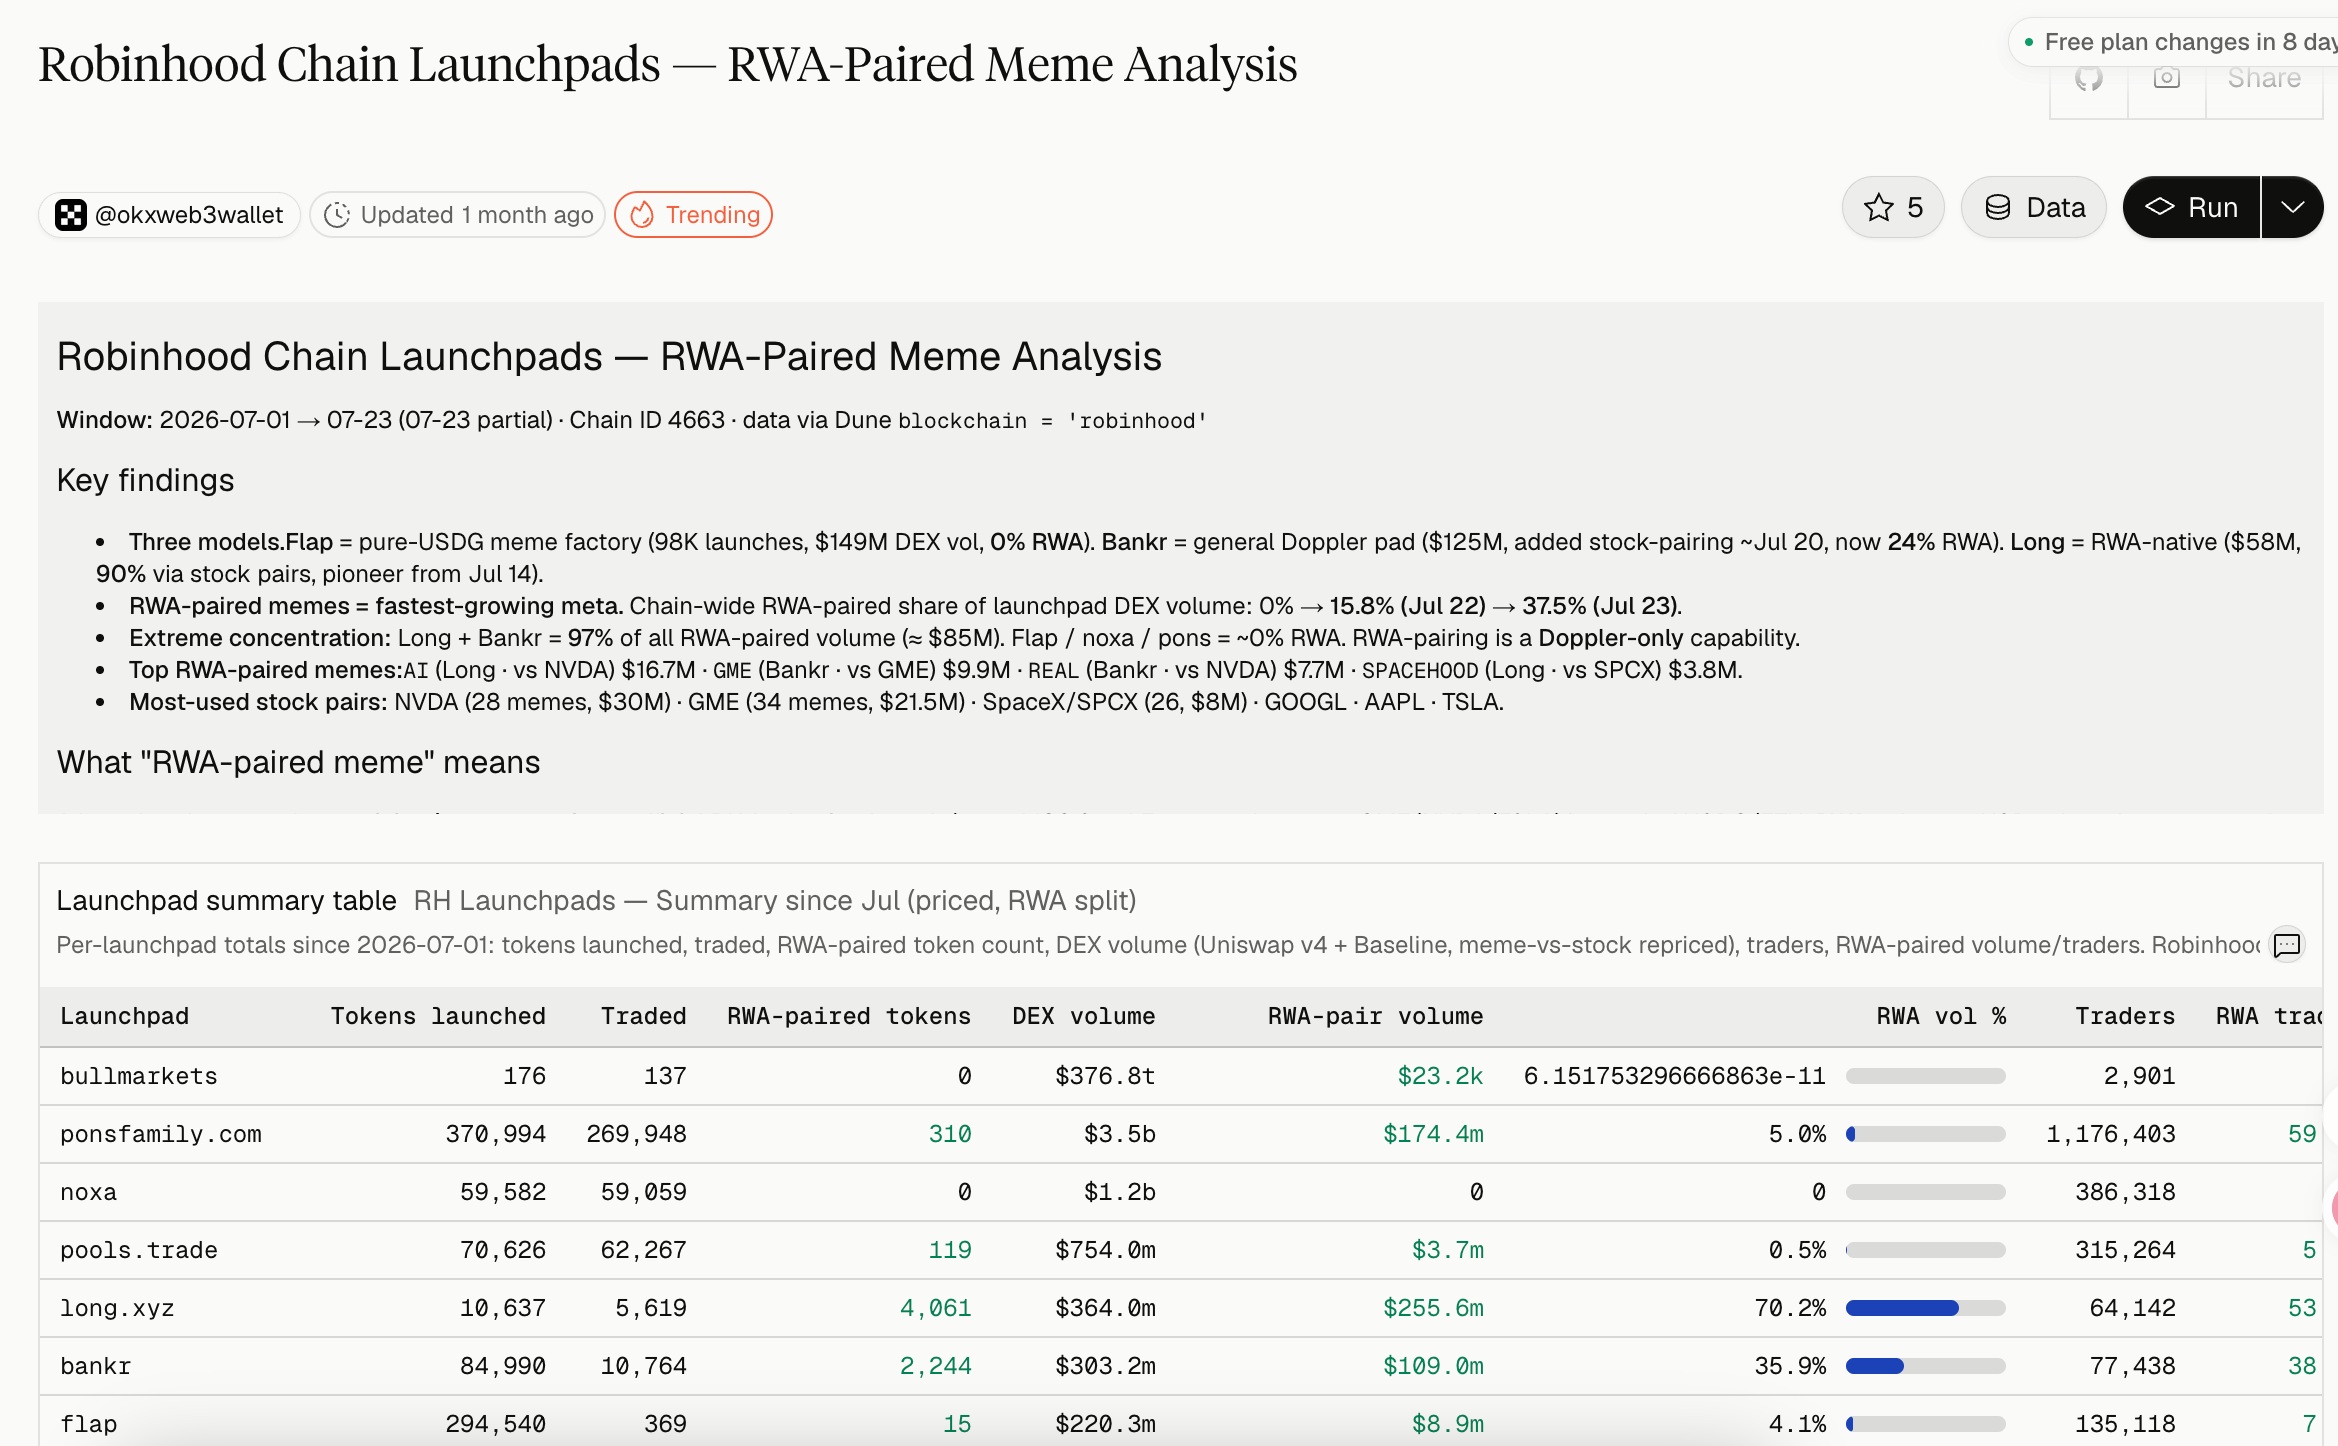
The underlying model differences of the three major on-chain token platforms (e.g., Long focuses on RWA pairing, Flap focuses on pure U.S. dollar stablecoin pairing). You can visually see the remarkable growth rate of RWA paired trading volume as a percentage across the entire chain (soaring to 37.5%), as well as the real trading volumes of the hottest "U.S. stock mapping trading pairs" (such as NVDA, GME, SpaceX) corresponding to on-chain memes.
In-depth Expansion and Practice:
Funds are extremely smart. When the RWA pairing proportion surges, it indicates that large funds are more inclined to provide liquidity with assets that have yield or underlying asset value. You can use this dashboard to precisely uncover which specific U.S. stock concepts current funds are focusing on, follow those projects with significant trading volumes leading the way, and avoid obscure stocks that no one cares about.
Note: The updates of this dashboard currently seem to be less timely, and players with certain operational skills may need to manually run the data sources to keep them updated.
4. Dirt Dog Trenches Micro-Ecology: Follow Smart Money and the Trading Bot Wars
Dashboard Link: The Robinhood Trenches Comprehensive Tracking
Dashboard Author: @Adam_Tehc
When the macro environment is confirmed safe, it’s time for close combat. This dashboard helps you thoroughly understand the PVP ecology of the underlying trenches.
What You Can See:
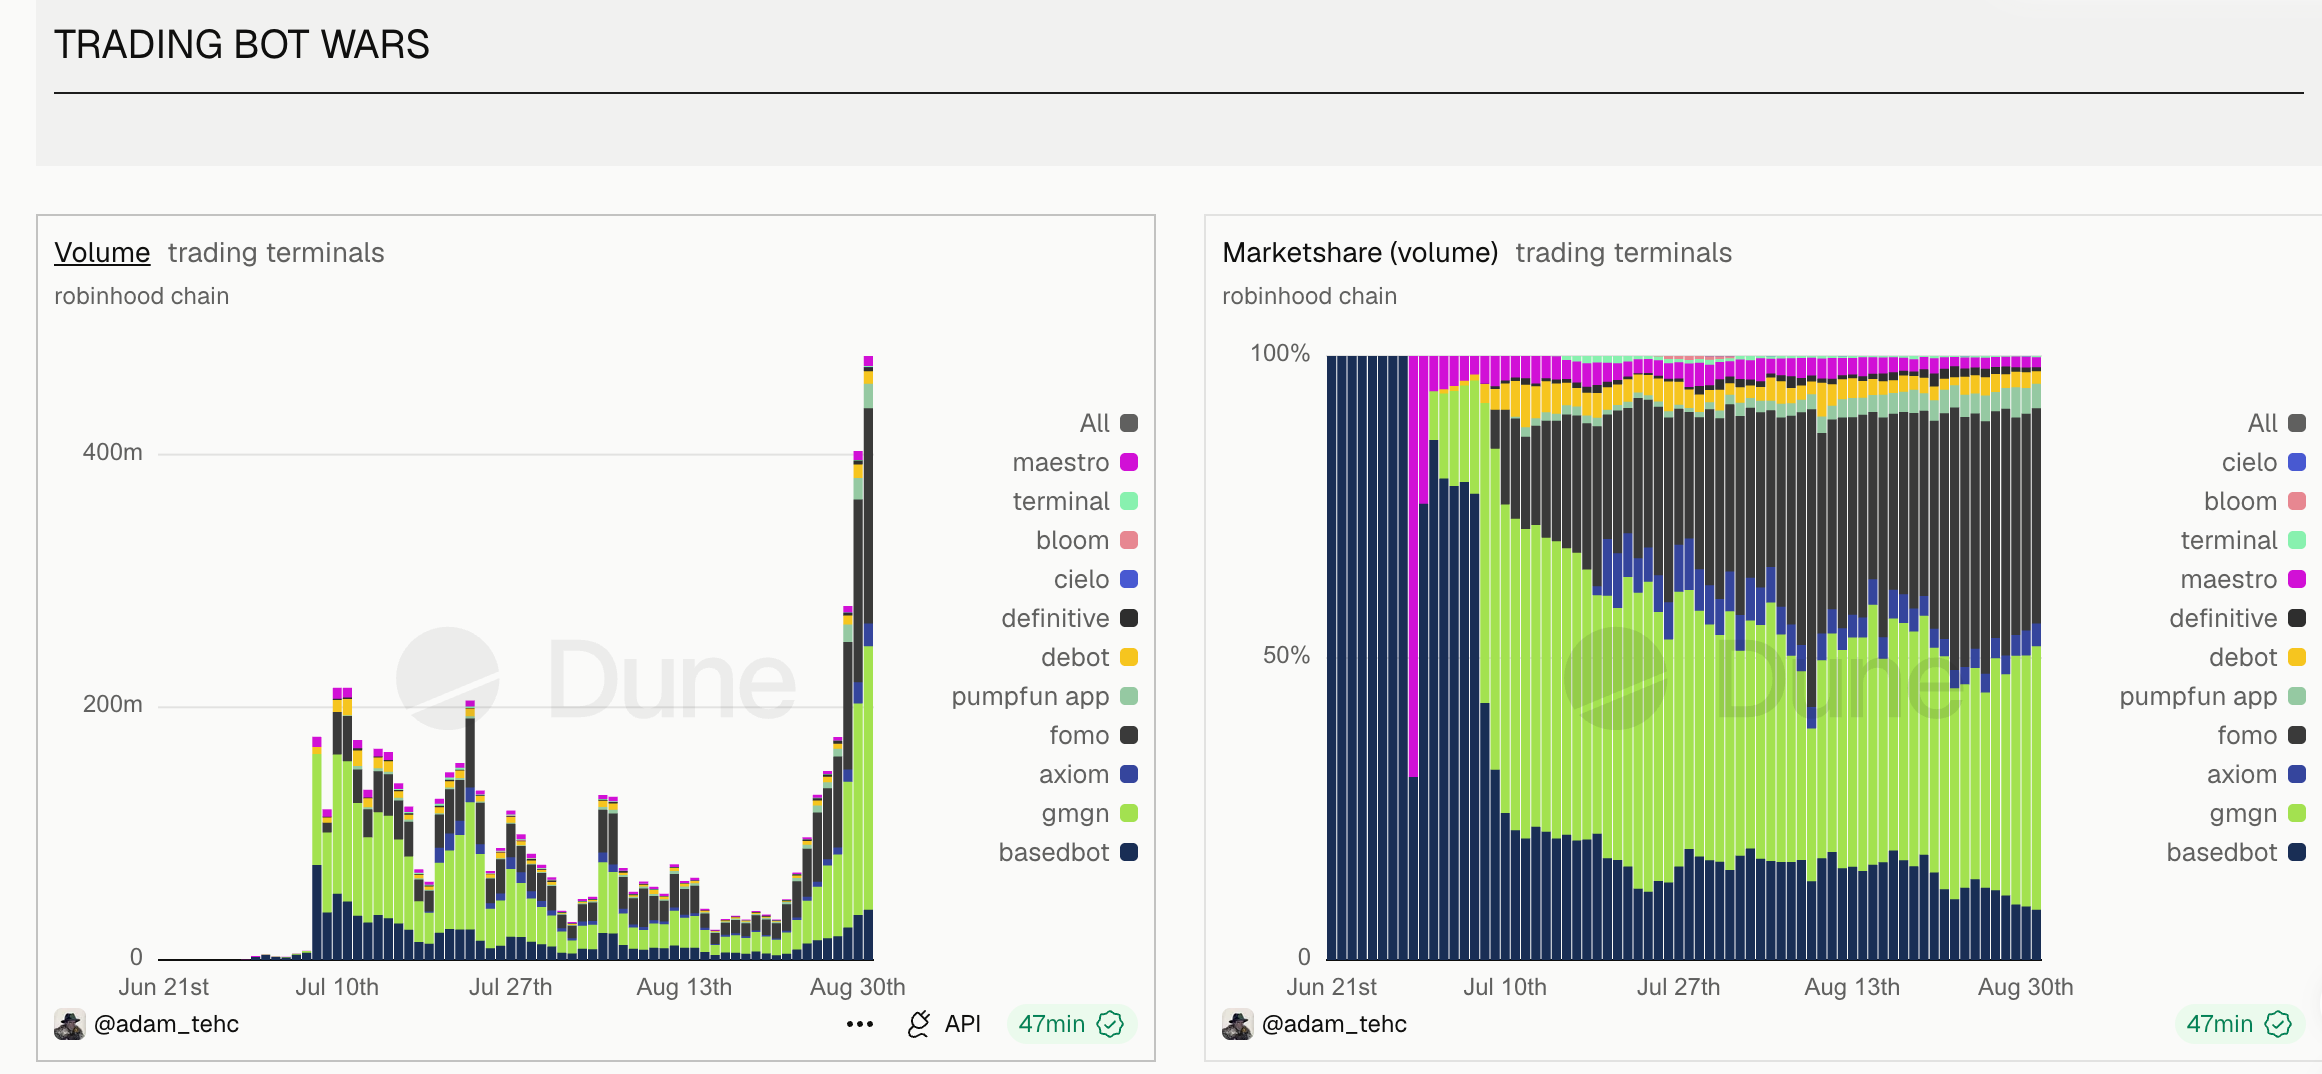
Extremely exaggerated total number of on-chain transactions in 24 hours (over 5.38 million), DEX trading volume trends, and highly practical hardcore sections: “Trading Bot Wars (such as GMGN's continued lead),” “Top Traders (smart money profit leaderboard),” and “Most Traded Tokens (most active tokens).”
In-depth Expansion and Practice:
Absolutely do not blindly buy tokens that have hit Twitter's trending topics. In this dashboard, you should focus on the “Top Traders” leaderboard, uncovering those high-win-rate smart money wallet addresses that often ambush early. Additionally, observe the proportion of trading bot transaction volumes; if the vast majority of trades are completed by bots, it indicates that ordinary retail investors face a huge PVP disadvantage, and at that point, you must upgrade your toolchain (such as using GMGN, etc.) to survive in the trenches.
Finally, in this vast experiment of merging traditional finance with Crypto Native gameplay on the Robinhood Chain, narratives can be packaged, but the real data on-chain cannot be fabricated.
Effectively using dashboards, from verifying real capital entry through macro TVL, to capturing leading RWA+Meme projects at the micro level, and tracking smart money addresses, is how you can transform luck into certain Alpha amidst this liquidity feast and mitigate losses.
Meanwhile, this is just a stepping stone for discussion, and the dashboards may also have downtime or malfunctioning possibilities; you can also find more recommended dashboards being updated at the bottom of the original dashboard for flexible use and selection.
免责声明:本文章仅代表作者个人观点,不代表本平台的立场和观点。本文章仅供信息分享,不构成对任何人的任何投资建议。用户与作者之间的任何争议,与本平台无关。如网页中刊载的文章或图片涉及侵权,请提供相关的权利证明和身份证明发送邮件到[email protected],本平台相关工作人员将会进行核查。
