Author: Anthony Pompliano
Translated by: Bai Hua Blockchain
In the past year, Bitcoin has disappointed many investors. We watched as everyone’s favorite digital asset plummeted more than 50% from its historic high of $125,000. The good news is that the bear market may be over, and we are in the process of igniting the next bull market.
Here are five charts that should excite you about Bitcoin's potential returns over the next 18 to 24 months.
First, Quinten Francois shows the relationship between Bitcoin's energy cost and RSI. You can clearly see the historical pattern of this relationship reaching the bottom simultaneously.
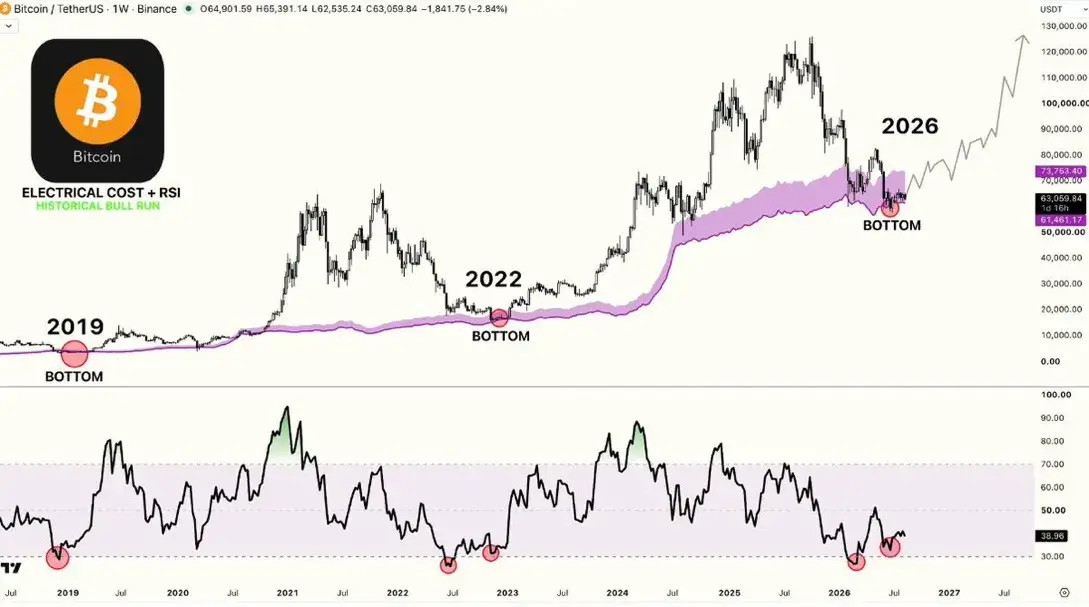
If history repeats itself, this is a good signal that the bull market has already started.
Next, Will Clemente demonstrates the historically highest correlation between Bitcoin and gold at present. This is crucial because as Scott Bessent recently committed to increasing government spending, the debasement trade is making a strong comeback.
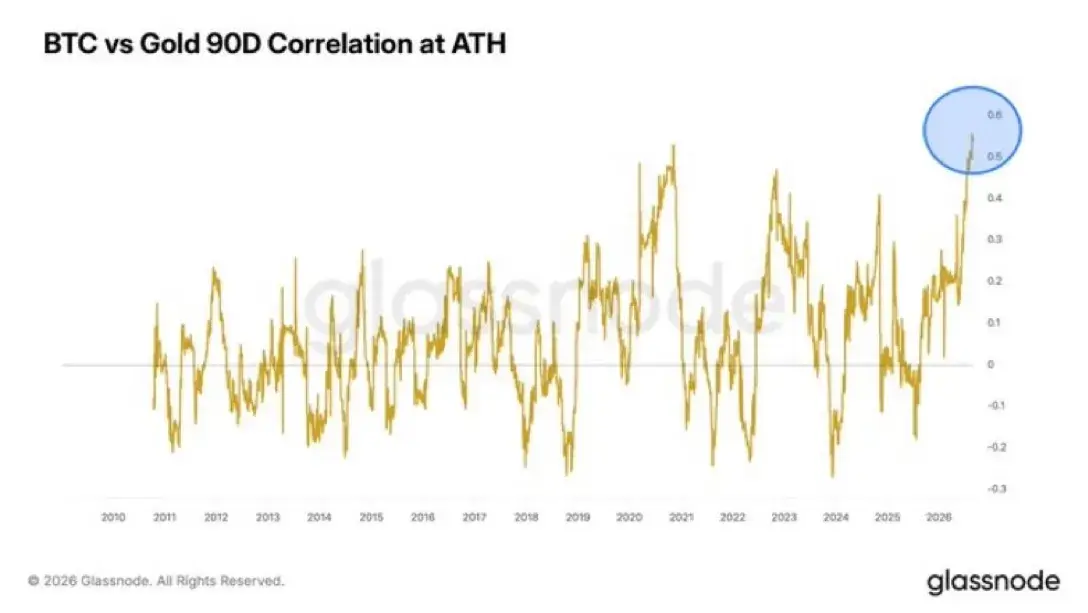
I keep repeating that classic Bitcoin adage: Bitcoin has no top because the dollar has no bottom. Given the government’s near-manic obsession with destroying the dollar’s purchasing power, even with currently over $40 trillion in national debt, it would be naive to think they won’t continue this unrestrained trend.
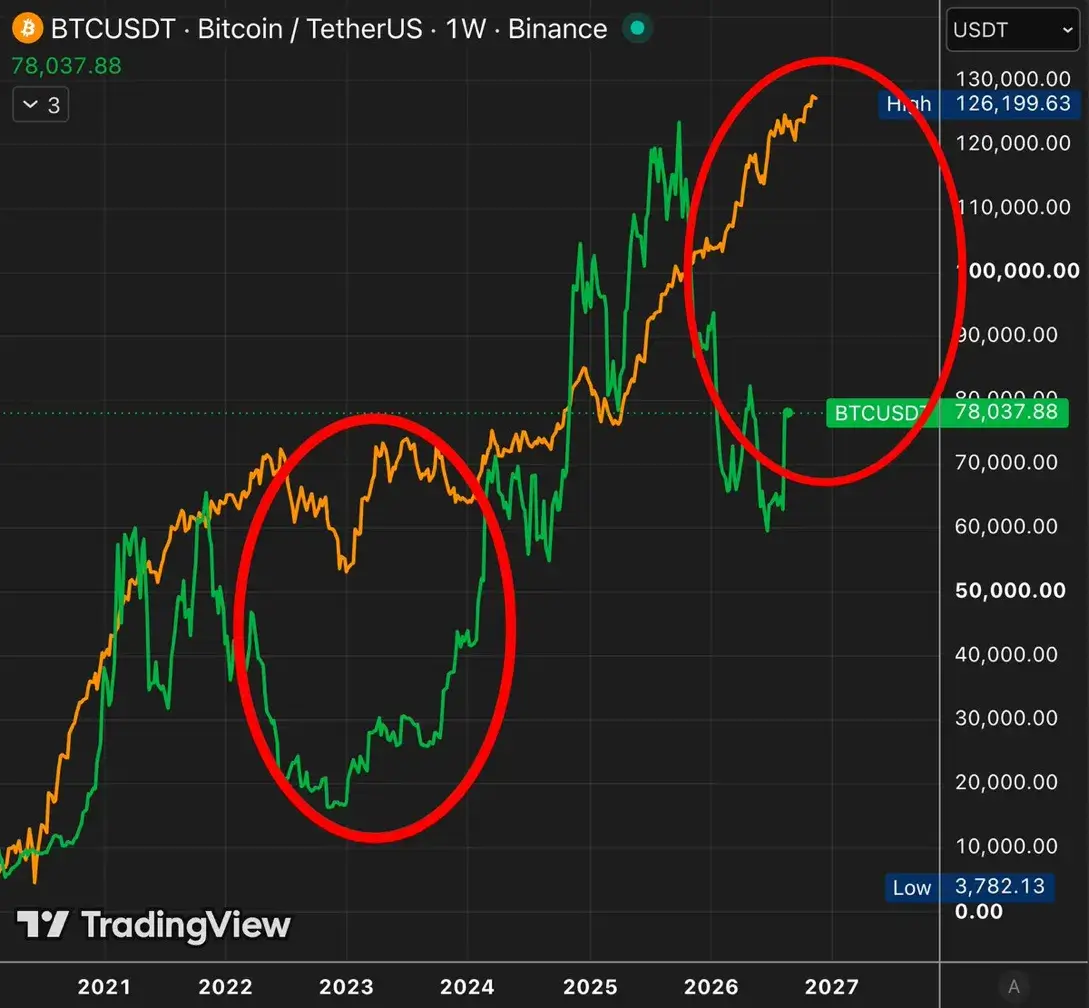
Third, Bitcoin has historically followed the changes in M2 money supply, but recently there has been a huge divergence—as Bitcoin fell, M2 continued to grow. This has led many to abandon this metric, but you can see that there have been significant divergences in the past. When this gap closes, it is usually Bitcoin catching up, not M2 slowing down.
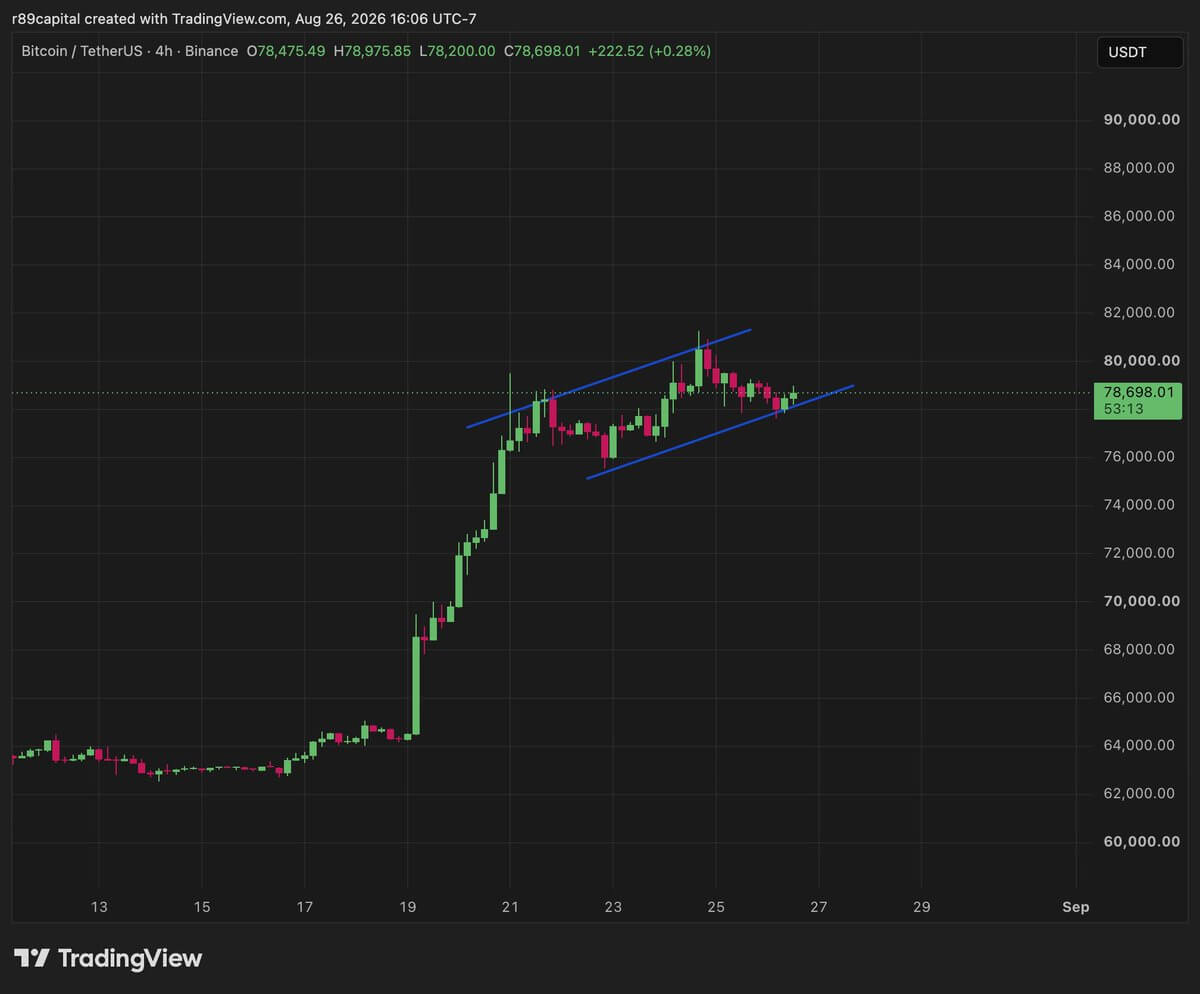
Fourth, I am not usually the type to draw lines on charts and expect my portfolio to rise, but I find this analysis from R89 Capital compelling. Bitcoin seems to be bouncing off the bottom of a structured area, which should drive prices higher in the coming weeks and months.
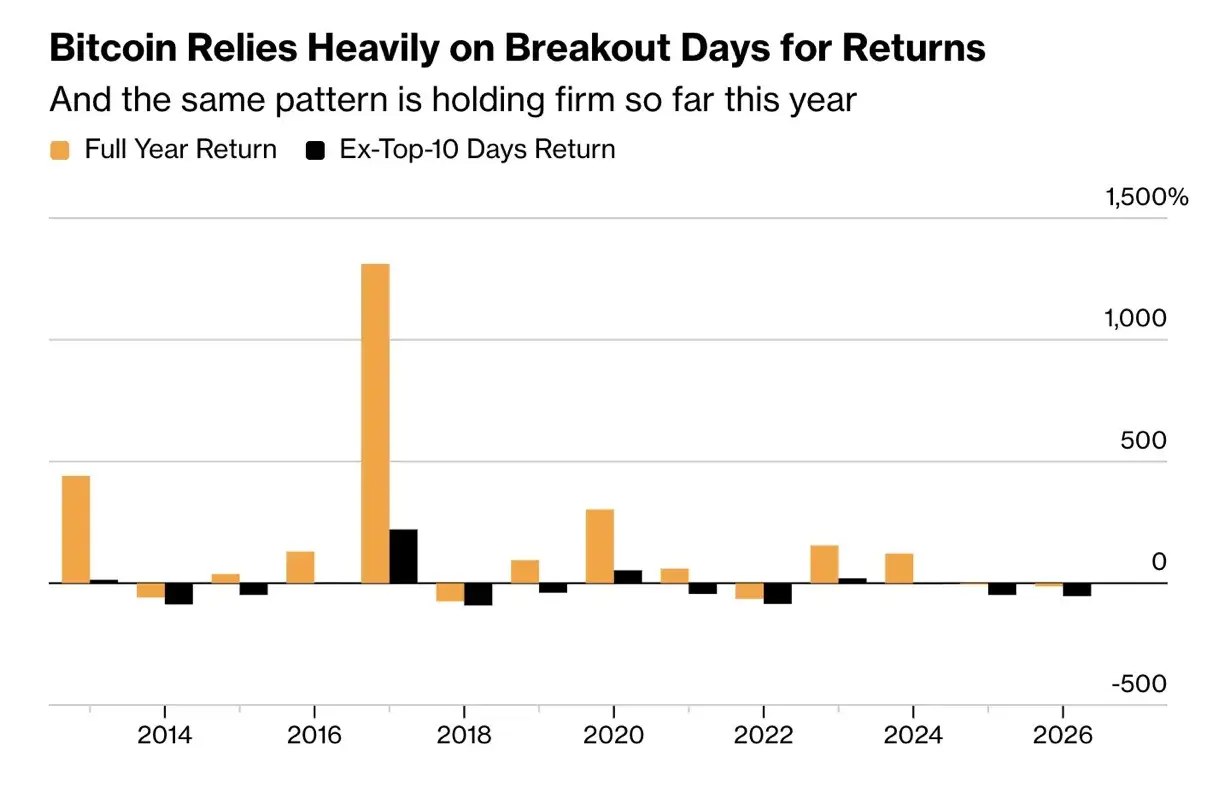
Finally, the secret to investing in Bitcoin is: time in the market outperforms timing the market. Jeff John Roberts shared this chart from Bloomberg and wrote: “Investing in Bitcoin has become similar to the S&P 500 index, most of the gains come from those few days of large rebounds—if you choose to sell and miss those days, the consequences can be disastrous. The Bloomberg chart shows a comparison of annual returns for Bitcoin after including and excluding the 10 days with the biggest gains.”
It's that simple. This Bitcoin bear market is shorter and milder than previous cycles. But don’t look at the situation through the rearview mirror. A new bull market has arrived. Bitcoin is set to appreciate significantly from current levels. There will be many fluctuations along the way. This volatility is not for the faint-hearted, but those who understand Bitcoin and hold strong during the fluctuations are likely to see substantial rewards.
Article link: https://www.hellobtc.com/kp/du/08/6428.html
Source: https://pomp.substack.com/p/5-charts-to-kick-off-the-bitcoin
免责声明:本文章仅代表作者个人观点,不代表本平台的立场和观点。本文章仅供信息分享,不构成对任何人的任何投资建议。用户与作者之间的任何争议,与本平台无关。如网页中刊载的文章或图片涉及侵权,请提供相关的权利证明和身份证明发送邮件到support@aicoin.com,本平台相关工作人员将会进行核查。


