
Author: Zack Pokorny, Galaxy
Translation: Saoirse, Foresight News
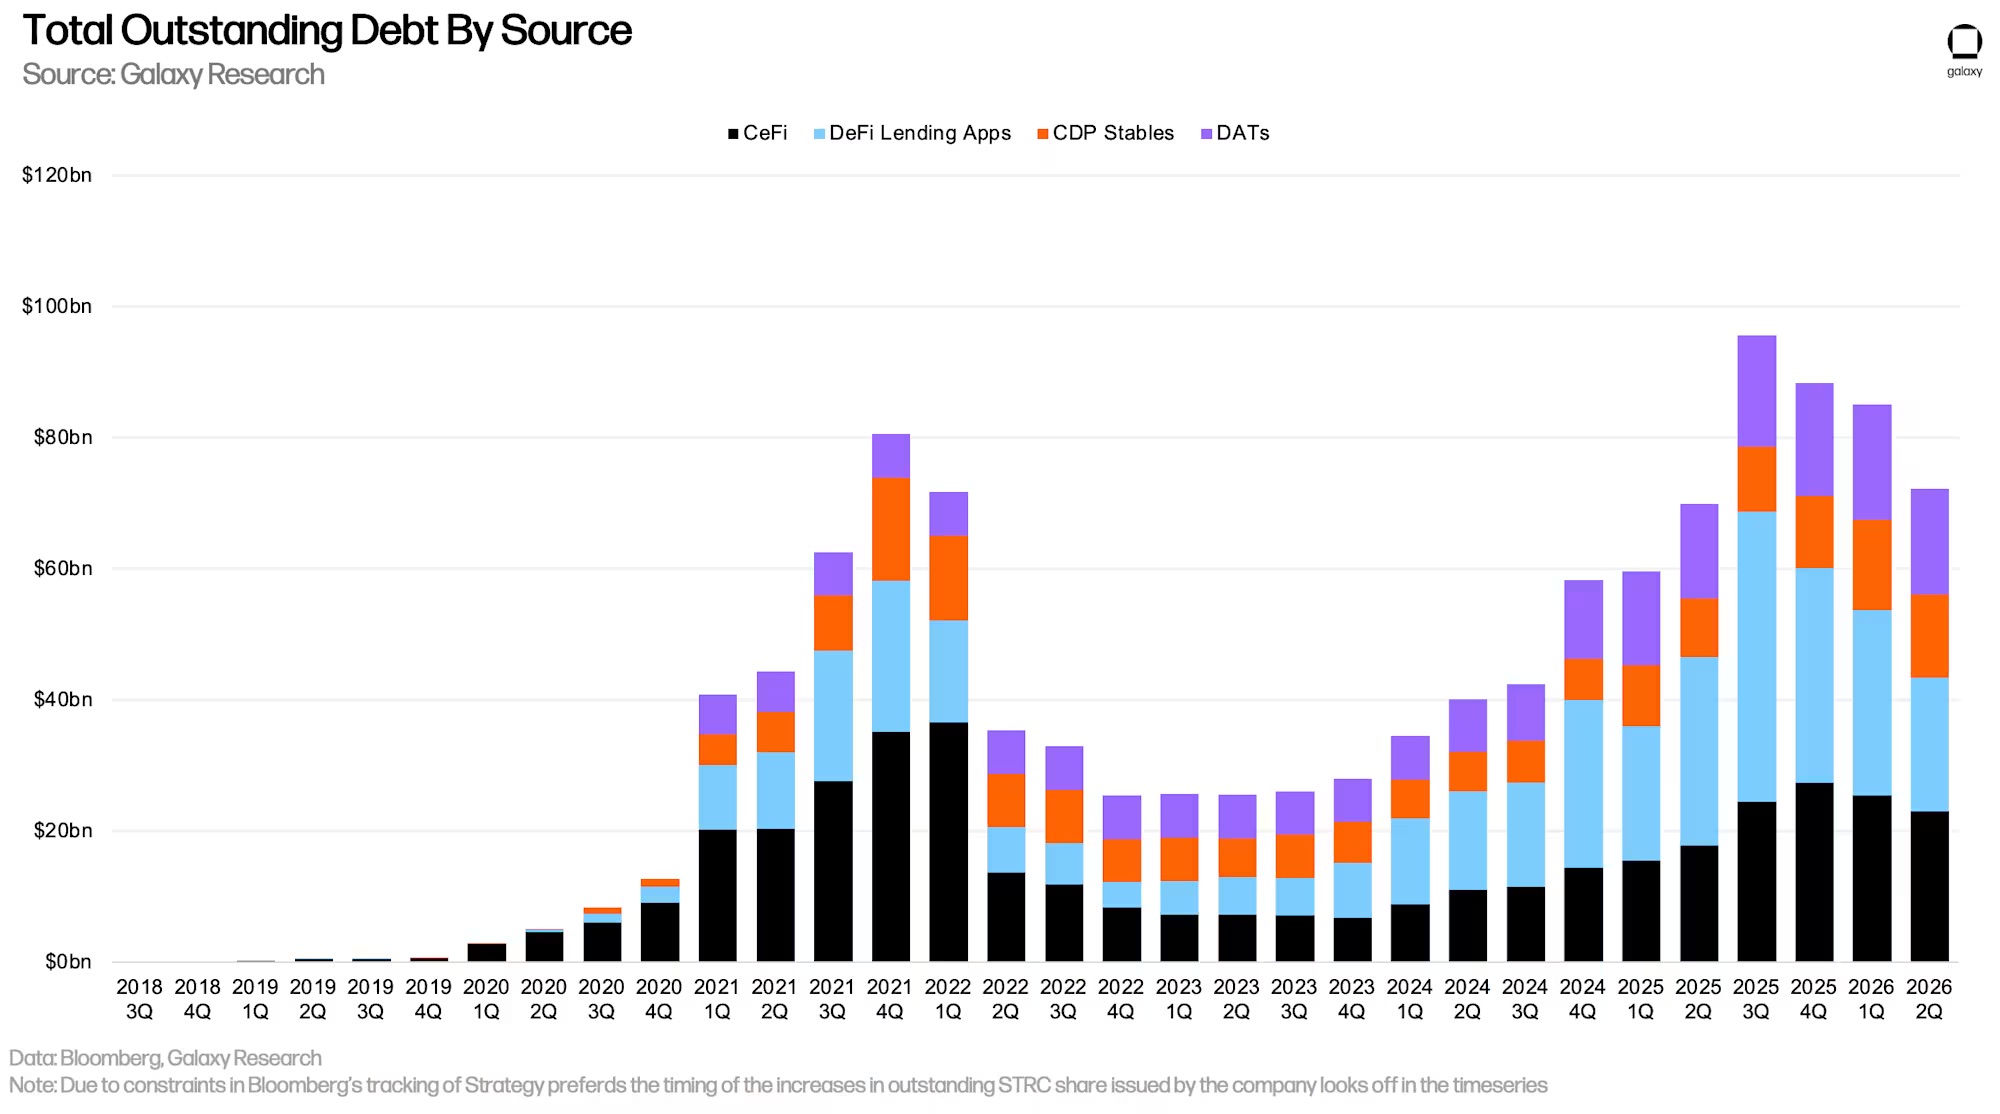
As the market continues its deleveraging trend, the second quarter of 2026 marked a quarter where the scale of on-chain lending across all categories declined simultaneously, covering centralized finance (CeFi), decentralized finance (DeFi), and the crypto collateral portion in collateralized debt position (CDP) stablecoins.
The significant difference between this market cycle and the previous bear market is that outstanding loans have decreased steadily and in a stepwise manner, rather than crashing all at once. In the second quarter of 2022, the crypto collateral lending industry directly crashed over 55%, followed by further declines of 9% and 29% in the third and fourth quarters of 2022, respectively. In contrast, this deleveraging cycle has seen a continuous downward trend over three quarters of just 10%, 5%, and 17%.
We believe this moderate downward pace represents a healthier deleveraging cycle: the driving factor is the market proactively reducing risk, rather than large-scale forced liquidations or counterparty collapses. If lending volumes continue to shrink in the future, it is expected to maintain this stepwise downward pattern and will not repeat the massive chain losses seen in 2022.
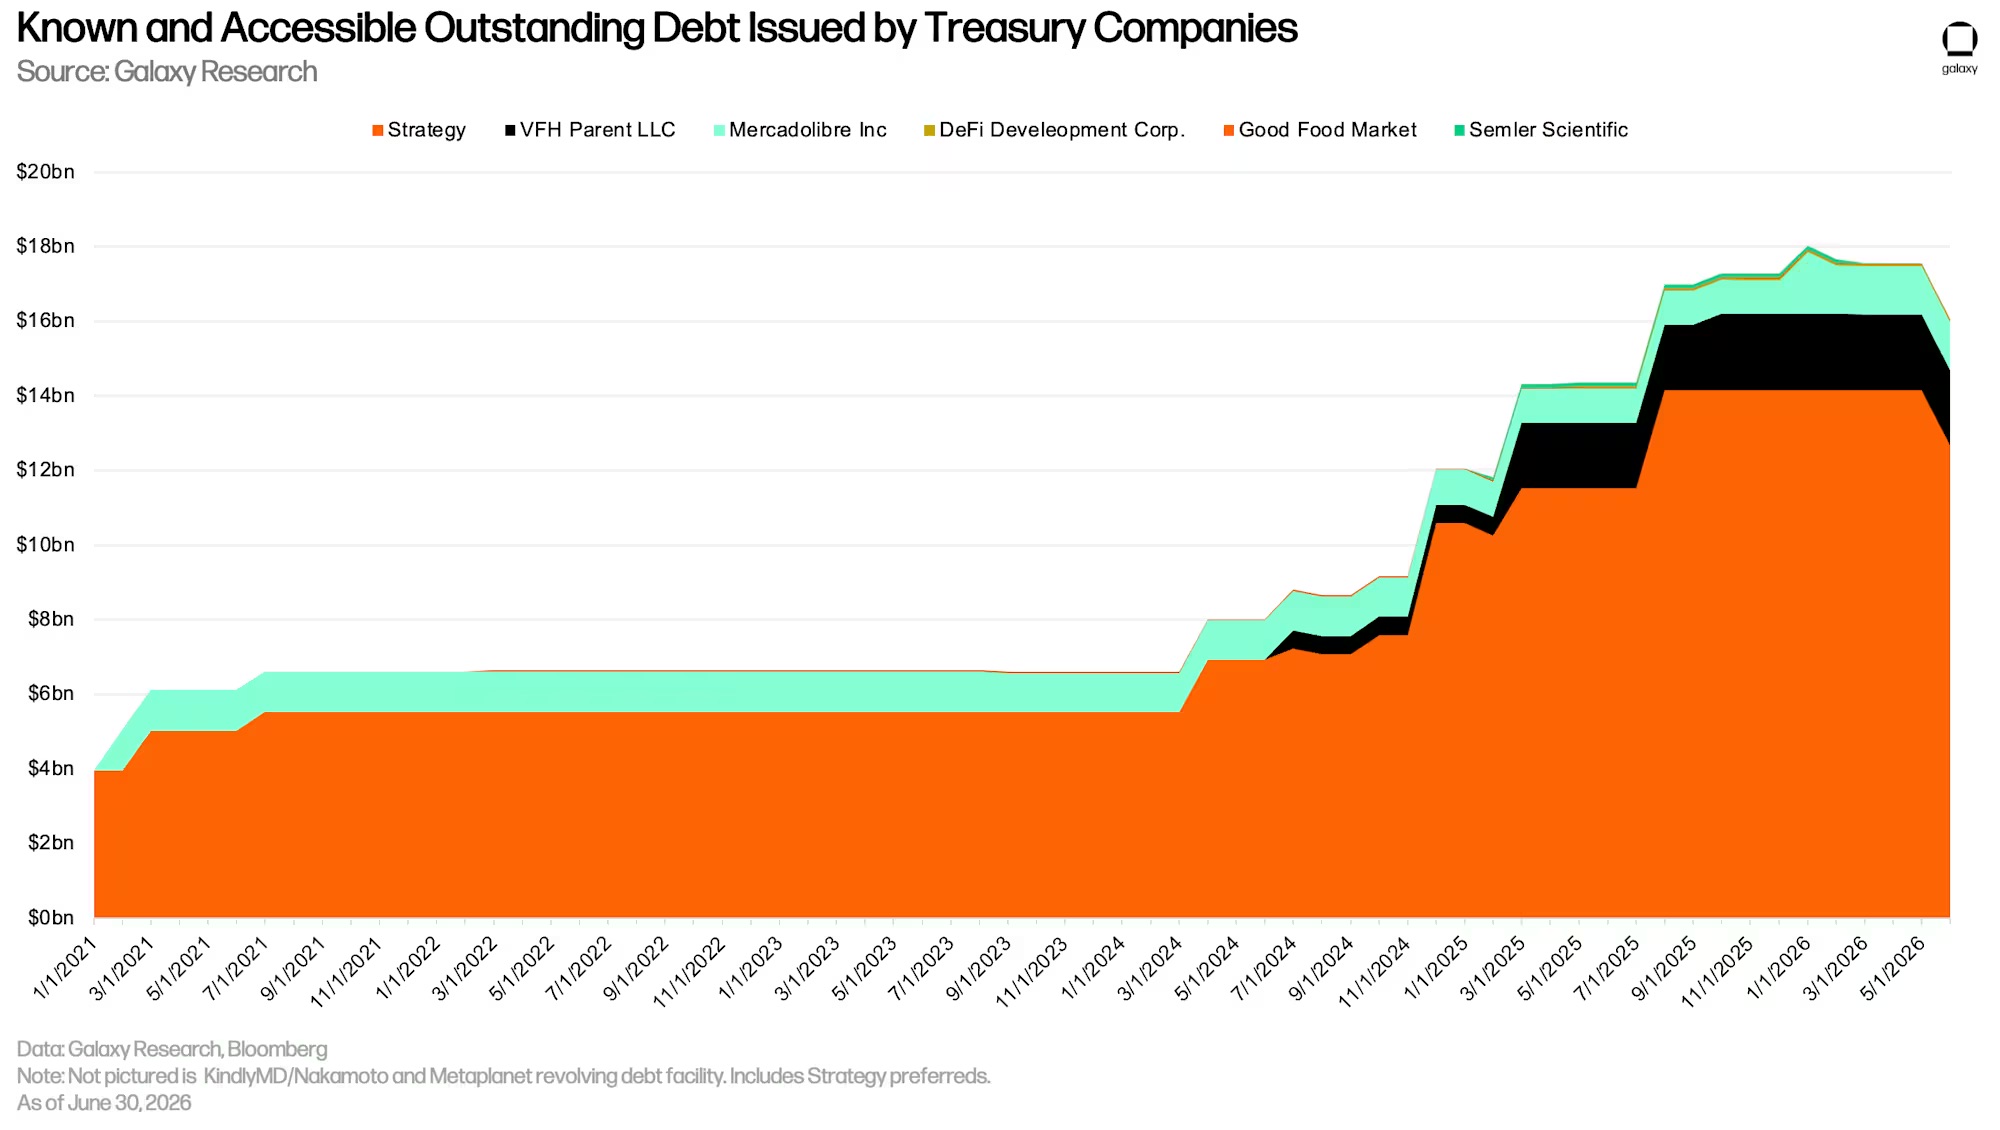
The deleveraging at the corporate treasury level mainly stems from Strategy's completion of a $1.5 billion debt repurchase in May 2026. This move will help to support the debt scale of digital asset treasury strategies, reducing it to $16.1 billion, roughly returning to the debt level of such companies in July 2025.
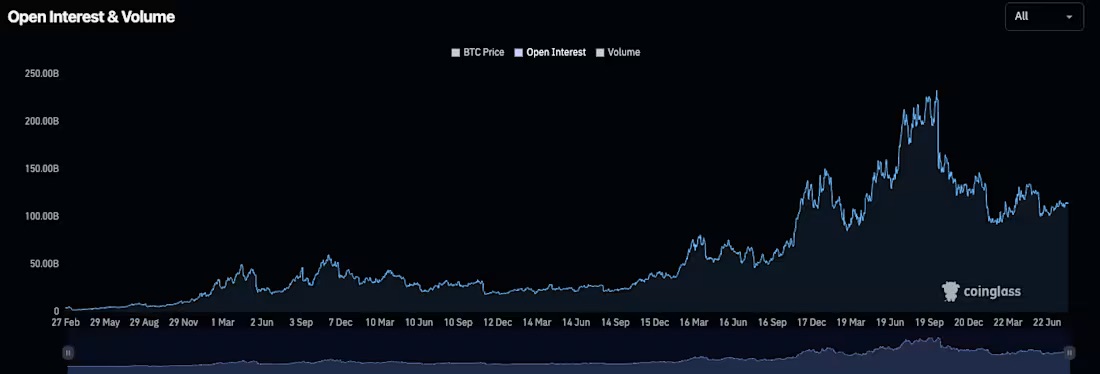
In the futures market, the changes in open interest (OI) at the end of this quarter were minimal, decreasing by only 3.08% month-on-month, to $103.2 billion. Beneath the overall slight decline, there is a clear internal structural differentiation: bitcoin’s open interest dropped 6.24% to $45.04 billion; ethereum’s open interest had an even larger decline of 26.31%, falling to $21.99 billion. At the end of the quarter, bitcoin and ethereum together account for 65% of the total open interest in futures. Notably, this end-of-quarter stability did not persist; by the end of July, futures open interest rebounded to approximately $114 billion, with bitcoin (about $48 billion) and ethereum ($25.74 billion) both recovering from their second-quarter lows.
Key Points
- Overall, the scale of crypto asset collateralized lending in the second quarter of 2026 shrank by $11.33 billion (‑16.78%), down to $56.16 billion, a 40.13% decline from the peak of $78.69 billion in the third quarter of 2025.
- DeFi lending applications saw dollar-denominated outstanding loans decline for the third consecutive quarter, reducing by $7.79 billion (‑27.61%) to $20.43 billion this quarter.
- According to Galaxy Research Institute's tracking, the outstanding debt size used by enterprises for direct purchases or to replenish digital asset treasury strategies is $16.1 billion.
- The open interest including perpetual contracts in futures decreased by 3.08% month-on-month to $103.2 billion.
Crypto Asset Collateralized Lending
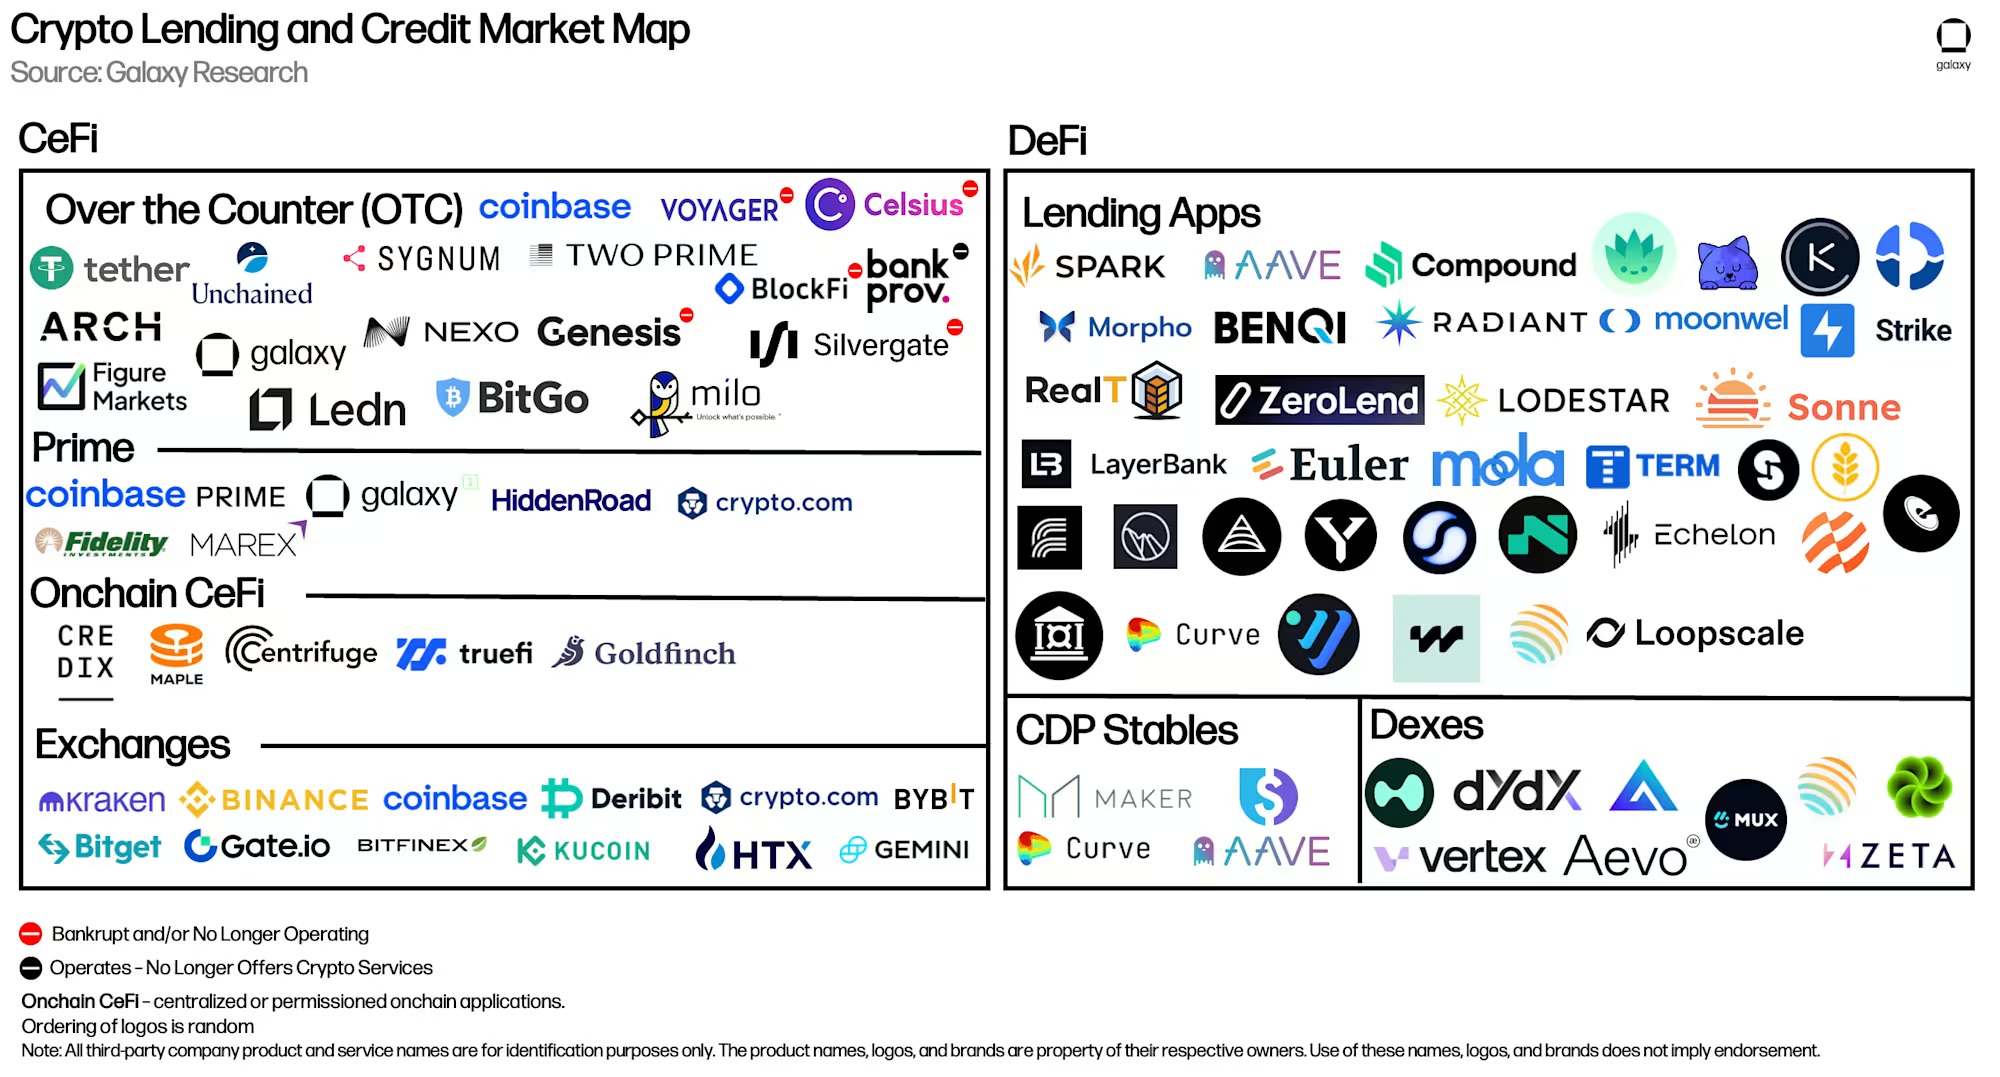
The market overview below shows the historical and current main participants in the CeFi and DeFi crypto lending space. Affected by the plummeting prices of crypto assets and liquidity depletion, some of the largest CeFi lending institutions collapsed successively during 2022-2023, marked in red in the chart.
Centralized Finance (CeFi)
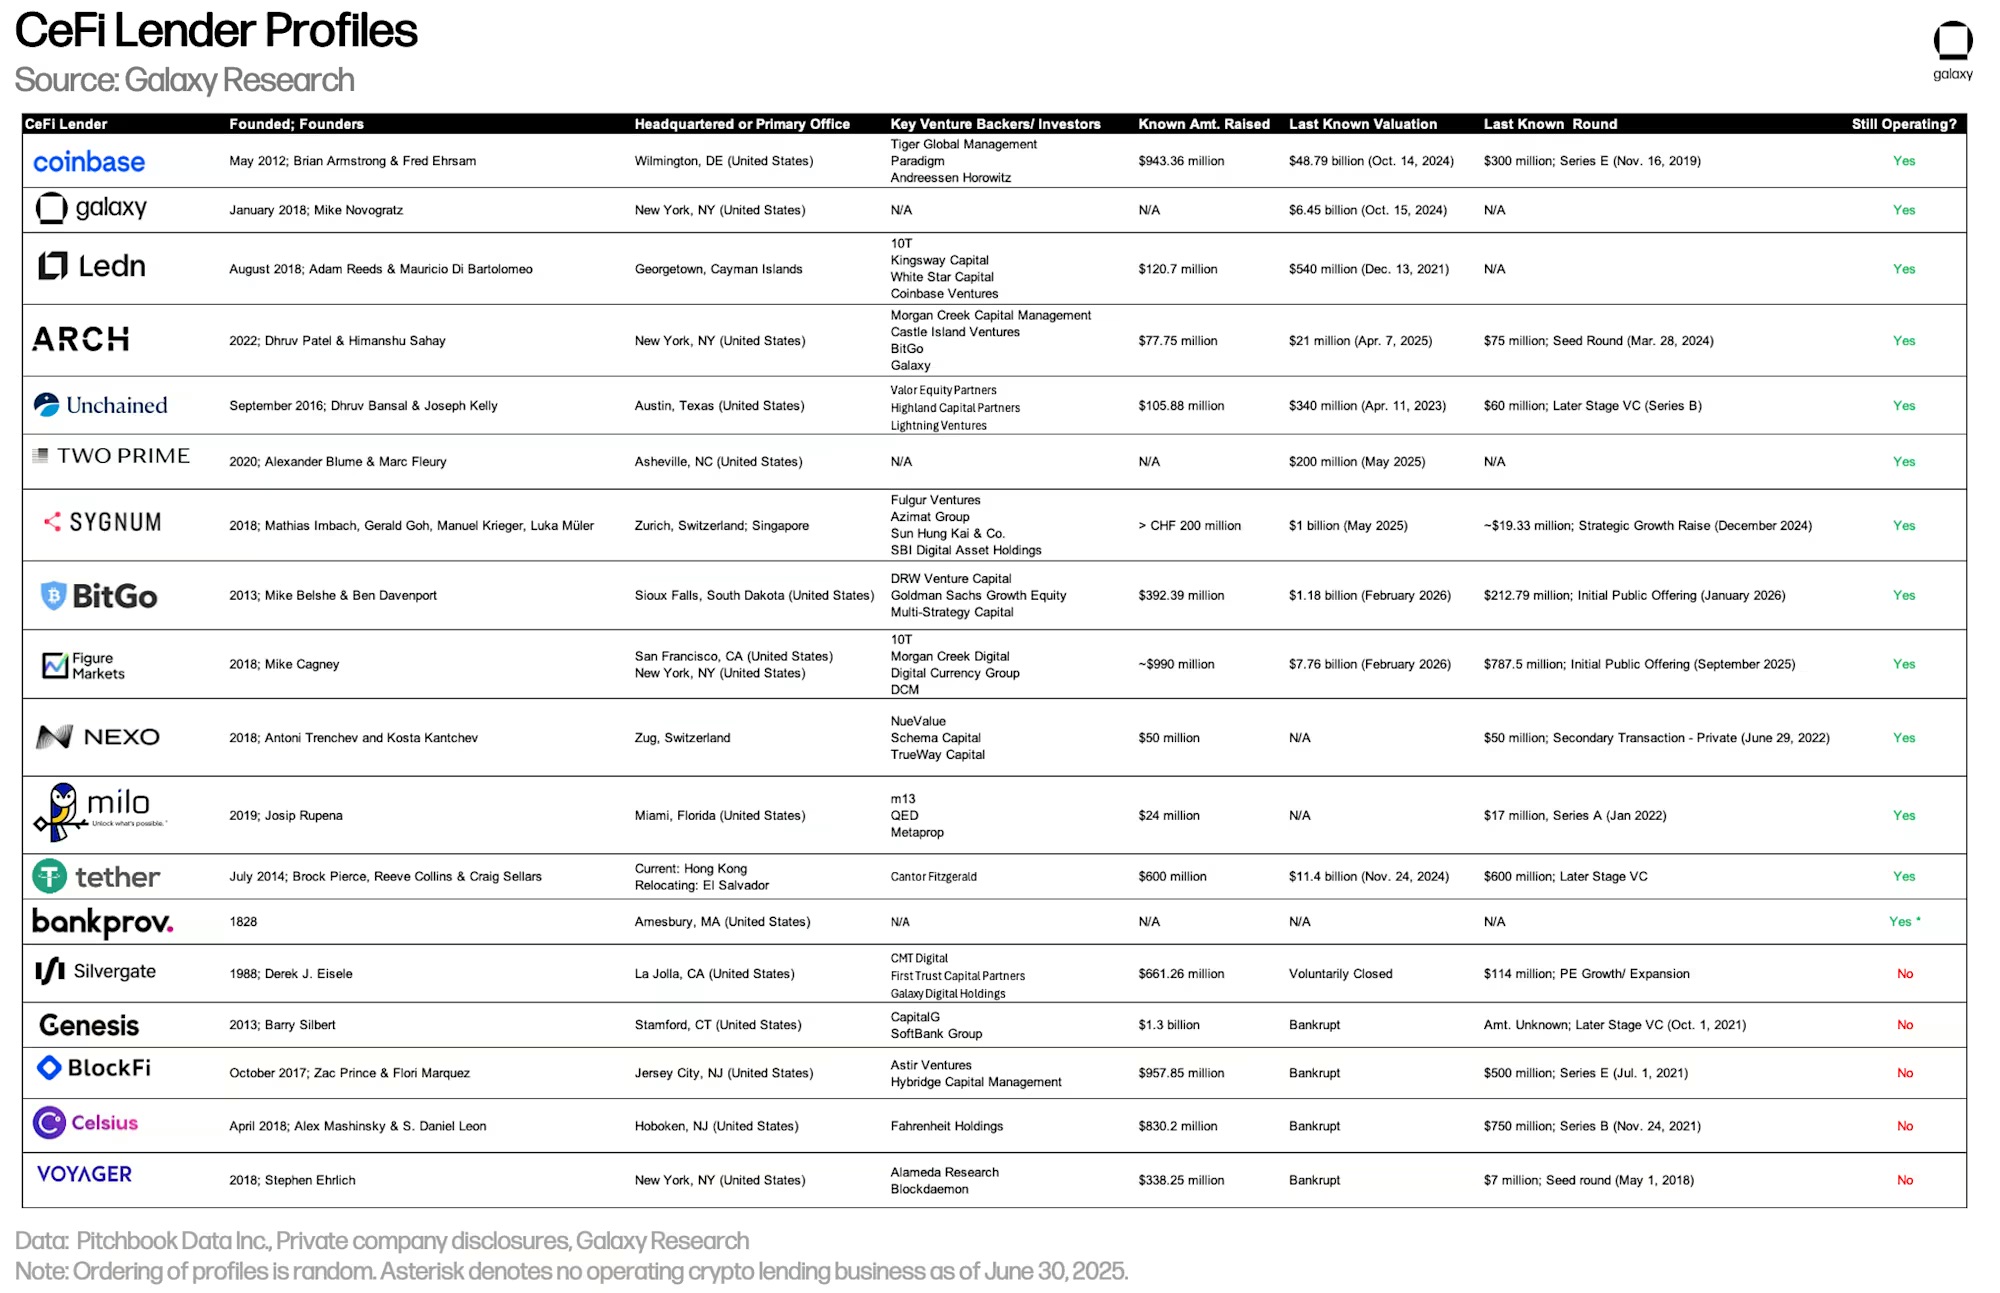
The table below compares various CeFi lending institutions covered by this market analysis. Some institutions offer diversified services to investors; for example, Coinbase primarily operates as an exchange but also provides credit to users through over-the-counter cryptocurrency loans and collateralized financing. This analysis only accounts for the on-chain collateralized lending of each institution.
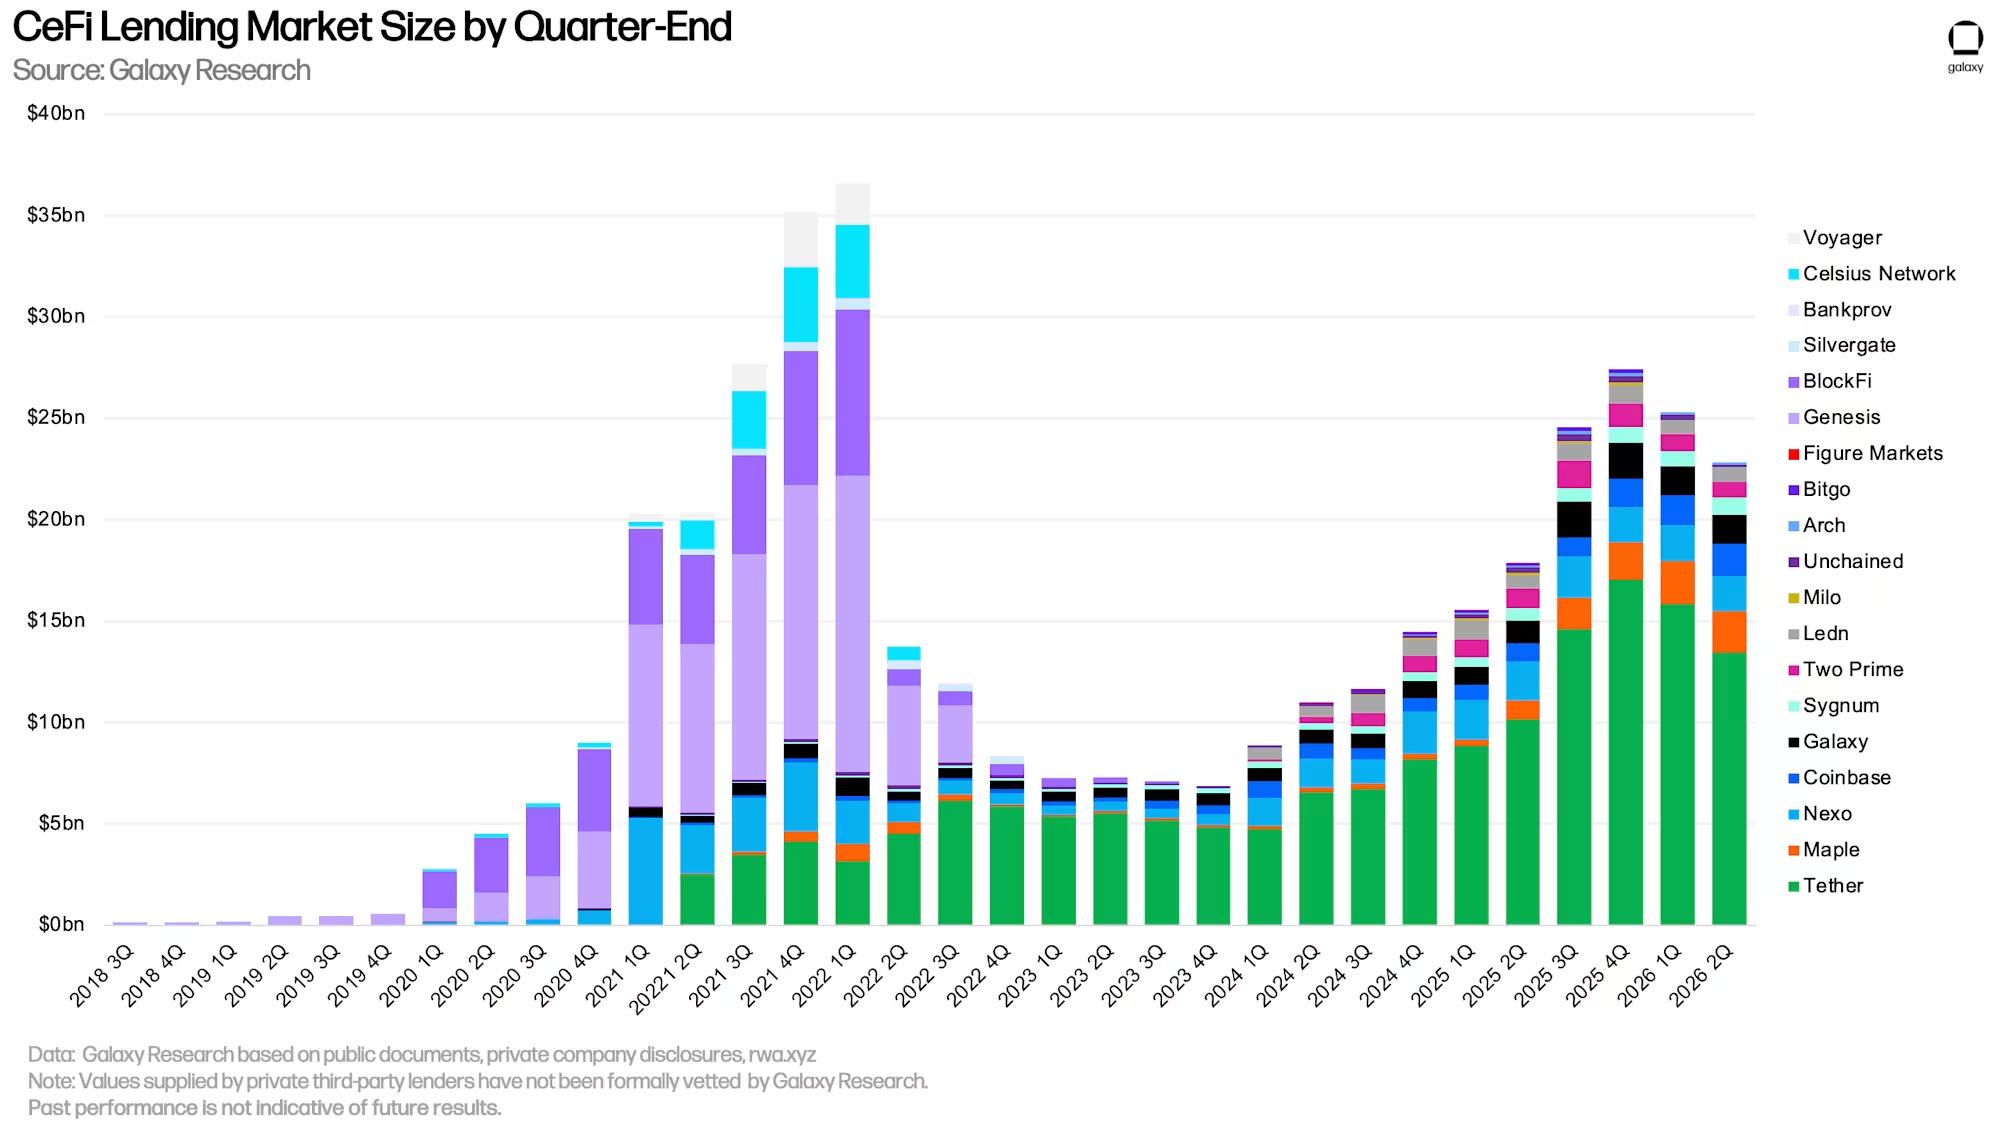
As of June 30, the outstanding borrowing size of CeFi recorded by Galaxy Research Institute is $22.98 billion, a month-on-month decrease of 9.62% (a reduction of $2.45 billion). Compared to the bear market low of $6.8 billion in the fourth quarter of 2023, it has already increased by $16.14 billion, a growth of 235.94%; however, it is still 37.16% lower than the historical peak of $36.58 billion in the first quarter of 2022.
The total scale of CeFi lending shrank in the second quarter, mainly due to the decline in outstanding loans collateralized by Tether; lending books for Galaxy, Coinbase, Ledn, Arch, Sygnum, and Milo all achieved growth in this quarter.
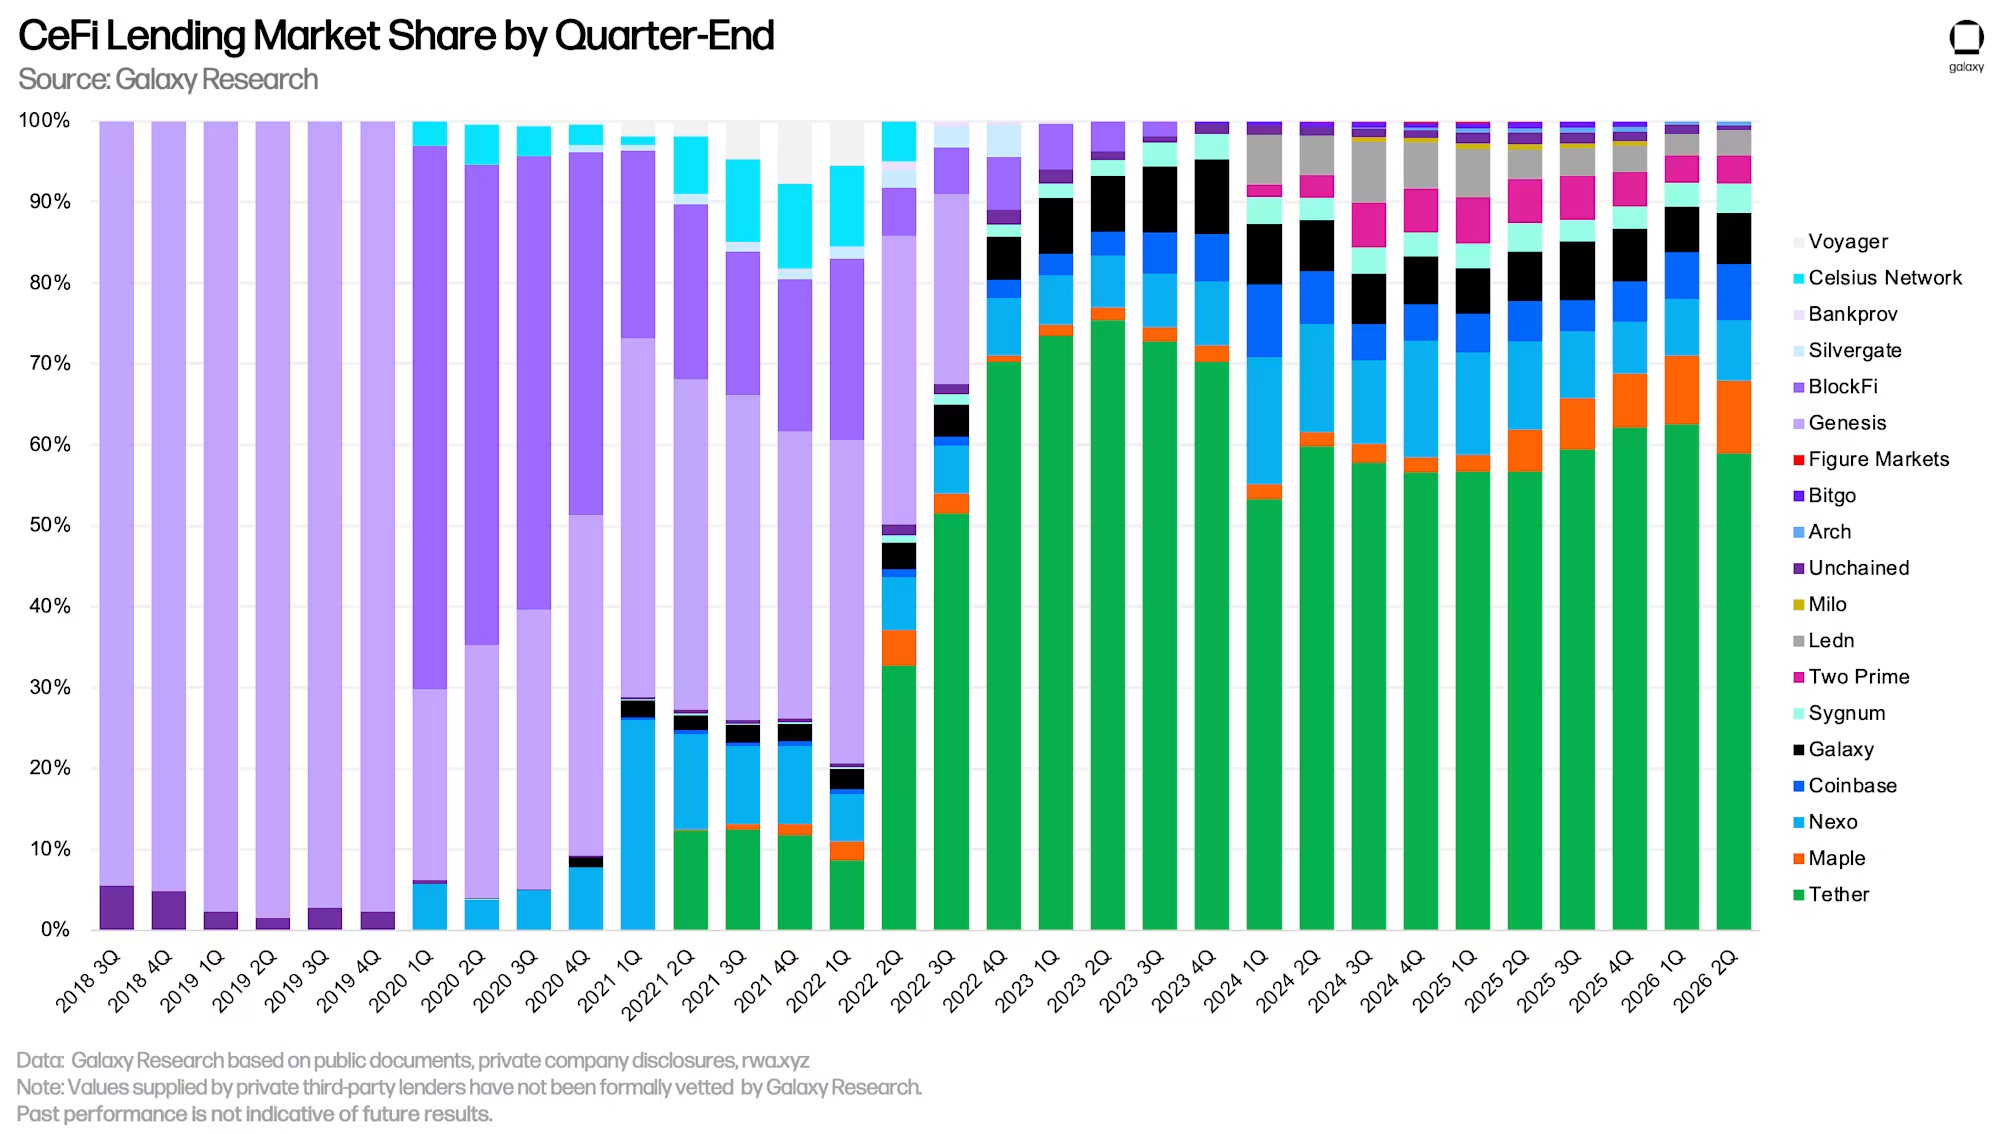
Tether remains the absolute powerhouse in the CeFi lending market, holding a market share of 58.54%, a decrease of 371 basis points month-on-month. Along with Maple (8.91%, month-on-month +52bp) and Nexo (7.51%, month-on-month +49bp), the top three institutions in the statistics collectively account for 74.96% of the market, with an overall month-on-month decline of 270 basis points.
When comparing market shares, it is important to note that there are clear differences among CeFi institutions: some institutions only offer specific types of loans (for example, accepting only BTC collateral, only supporting altcoin collateral, or providing cash loans in fiat rather than stablecoins); some only serve specific customer groups (institutional clients/retail users); and their operations are restricted by legal jurisdictions. These factors lead to varying expansion capabilities among institutions.
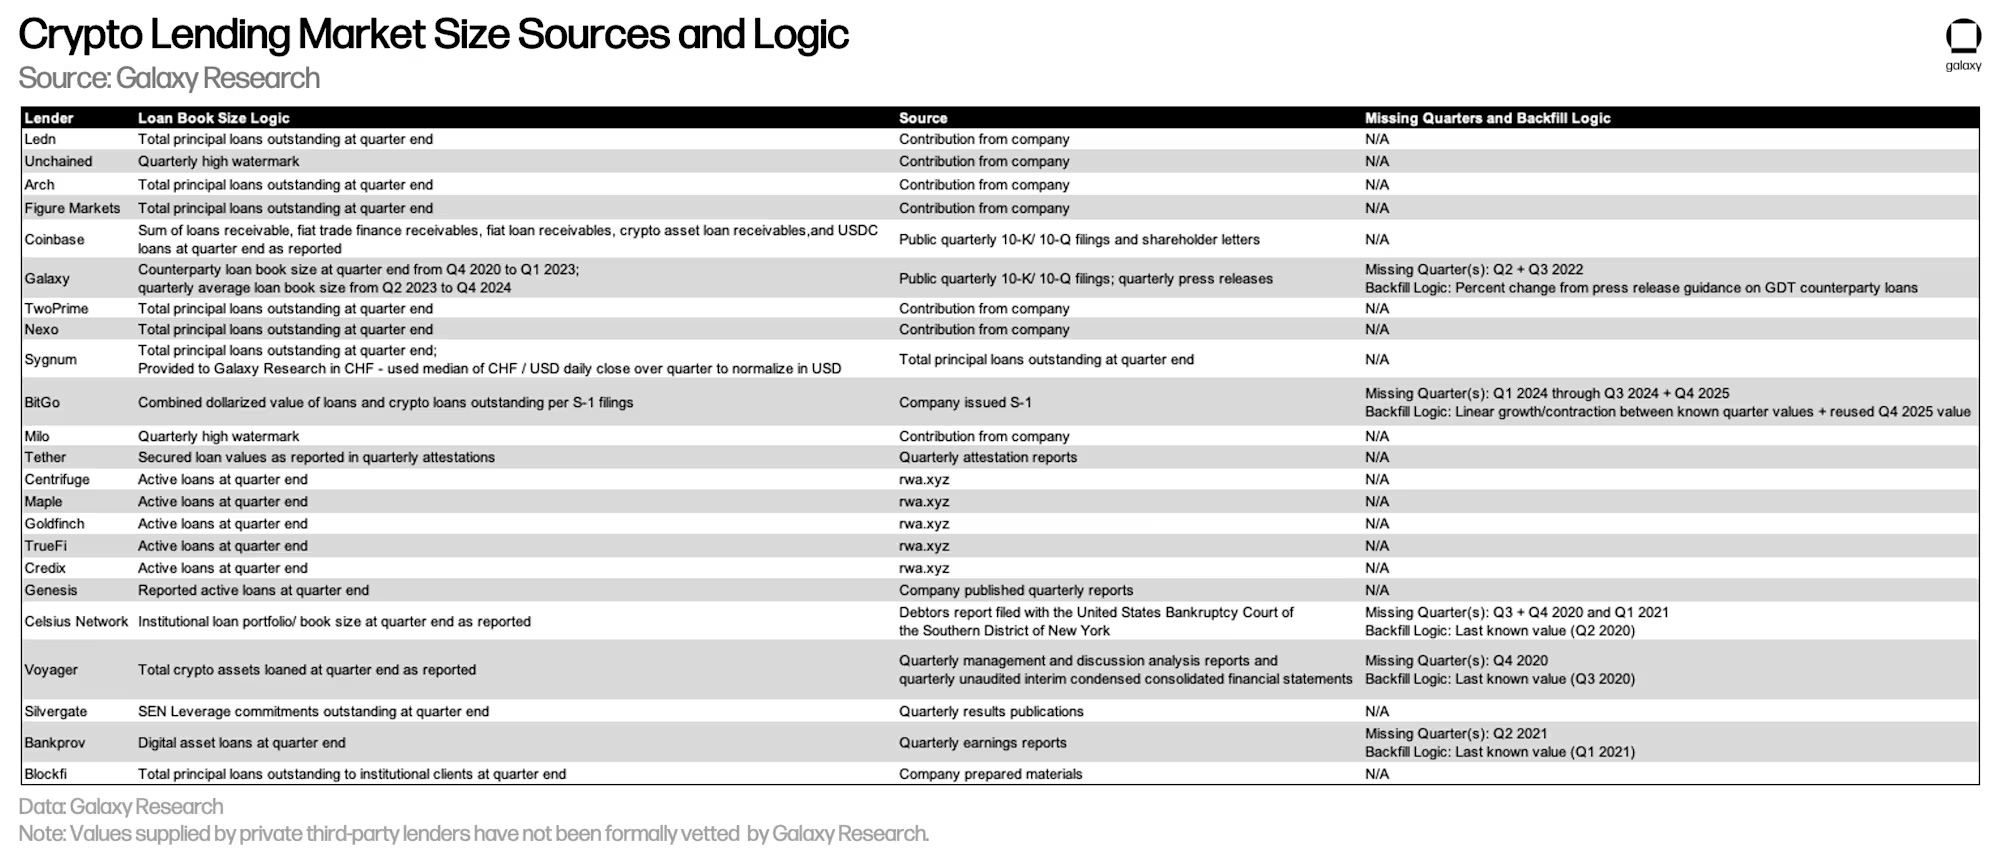
The table below lists the data sources for each CeFi institution according to Galaxy Research Institute and the calculation logic of the book size. DeFi and on-chain CeFi data can be obtained from public chain data, which is transparent and easily readable; however, acquiring CeFi data is very difficult: the accounting standards for the outstanding loans of various institutions vary, and the frequency of information disclosure is inconsistent, making it hard to obtain the overall data sources.
Note: Data provided by private third-party institutions has not been officially verified by Galaxy Research Institute.
Centralized Finance and Decentralized Finance Lending
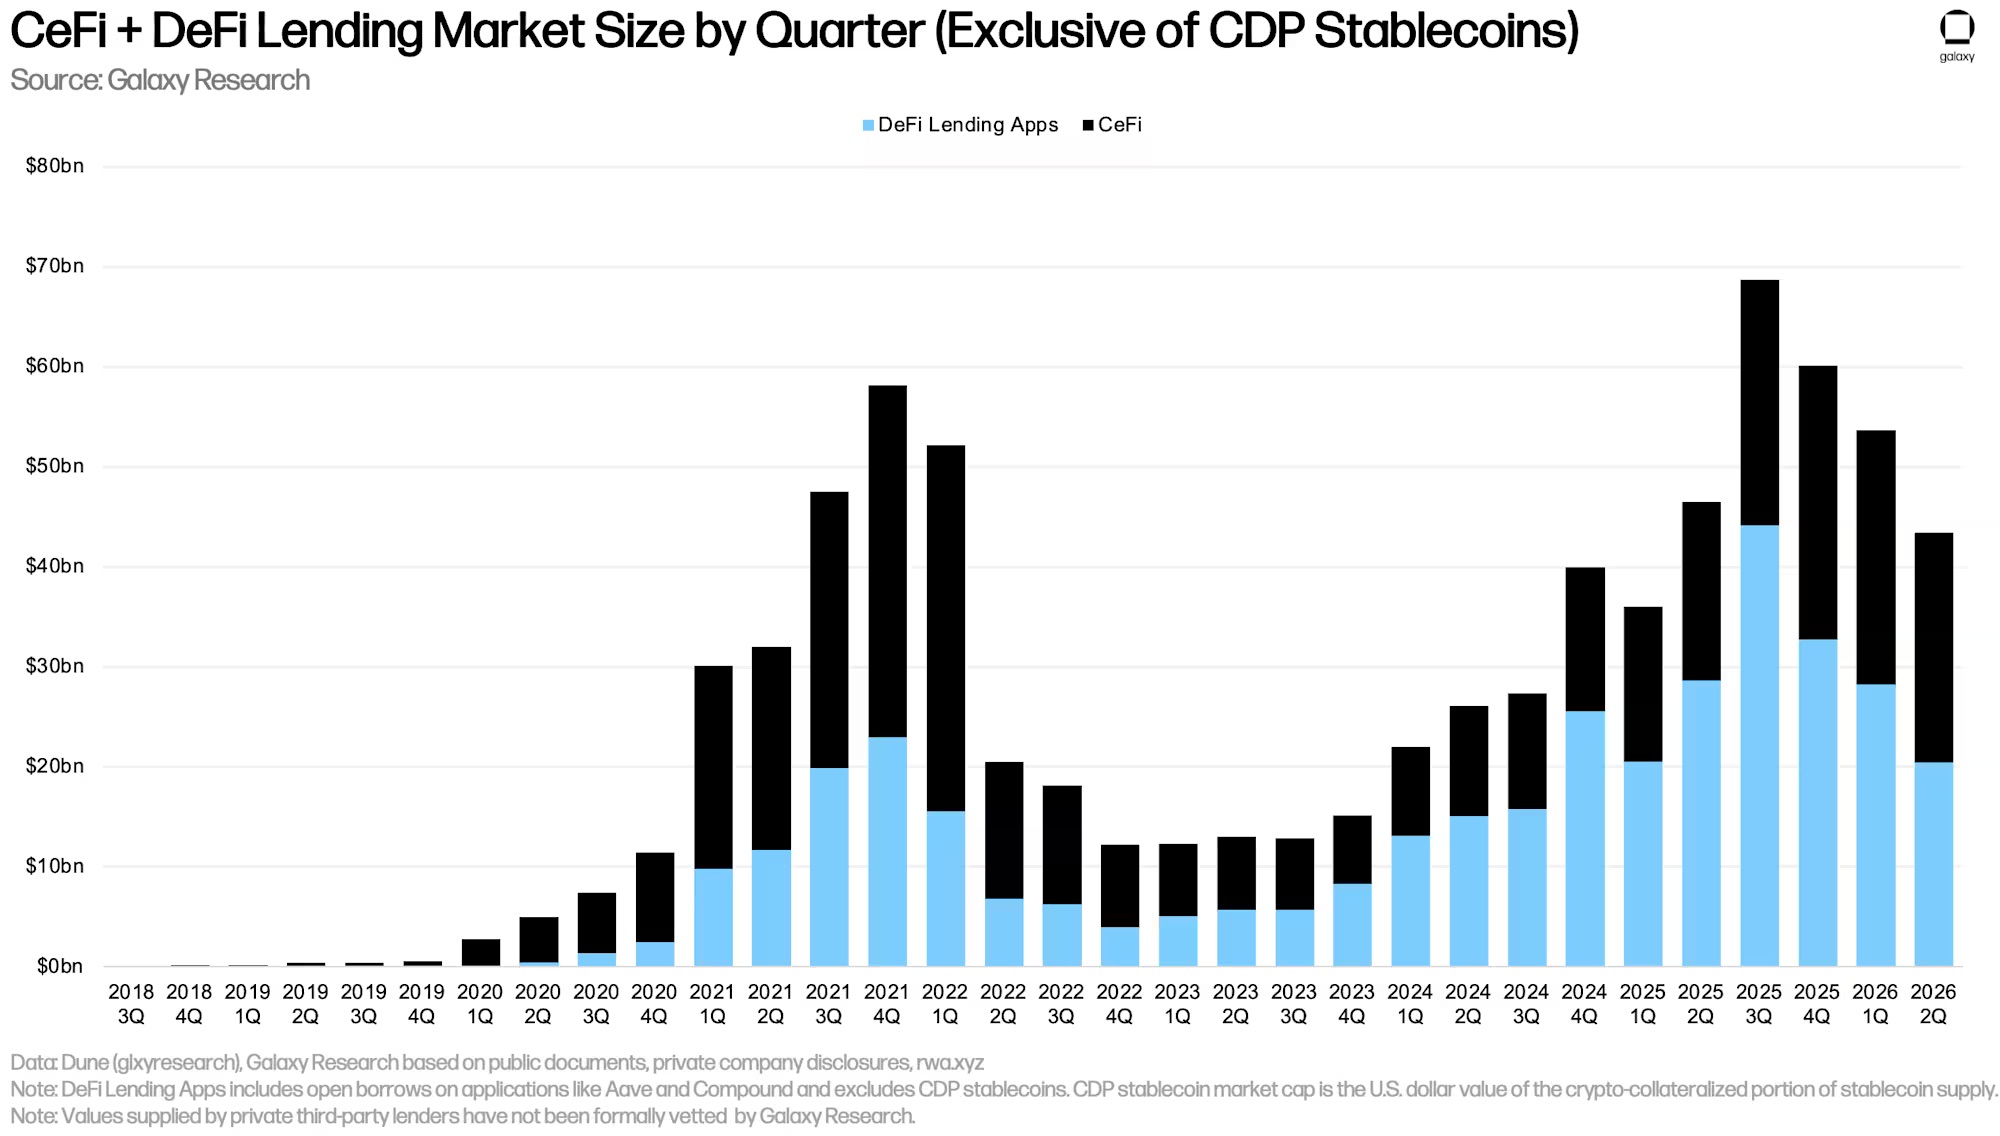
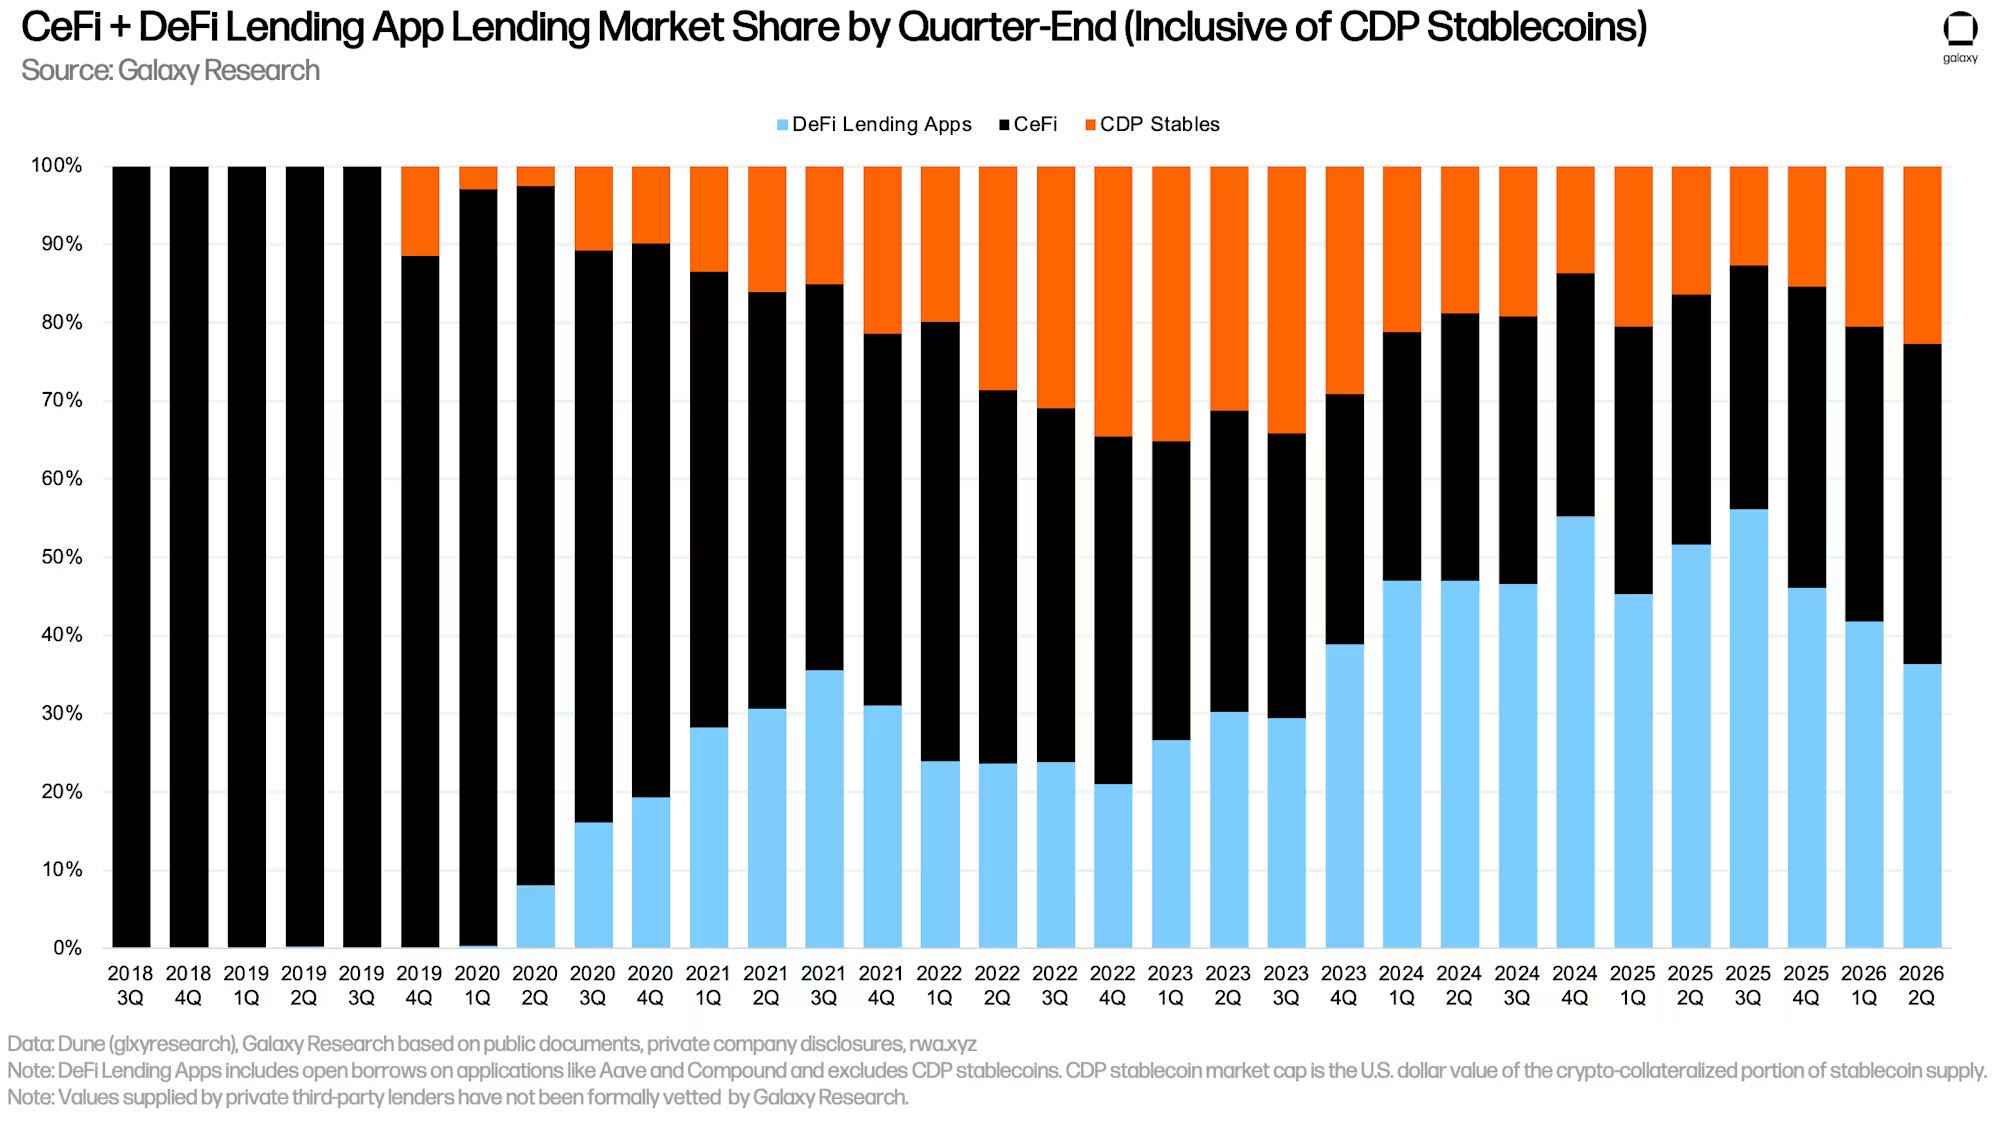
The dollar-denominated outstanding loan scale of DeFi lending applications declined for the third consecutive quarter in Q2, decreasing by $7.79 billion (‑27.61%) to $20.43 billion.
When consolidating DeFi applications and CeFi lending platforms, the total outstanding crypto collateralized loans at the end of the quarter amounted to $43.41 billion, showing a month-on-month decrease of $10.24 billion (‑19.08%), mainly from on-chain loans. It is worth mentioning that this is the first time since the third quarter of 2023 that CeFi's outstanding loans have surpassed DeFi lending applications.
Note: There is a risk of double counting between the total scale of CeFi's books and DeFi loan statistics. Some CeFi institutions may lend assets to off-chain clients by utilizing DeFi protocols. For example, a CeFi institution may collateralize idle BTC on-chain to borrow USDC, and then lend the USDC to off-chain borrowers. This loan will be counted as both DeFi outstanding loan as well as reflected as the institution’s loan to the client in its financial statements. Due to the lack of disclosure and on-chain identity tagging, it is difficult to filter out such double counting.
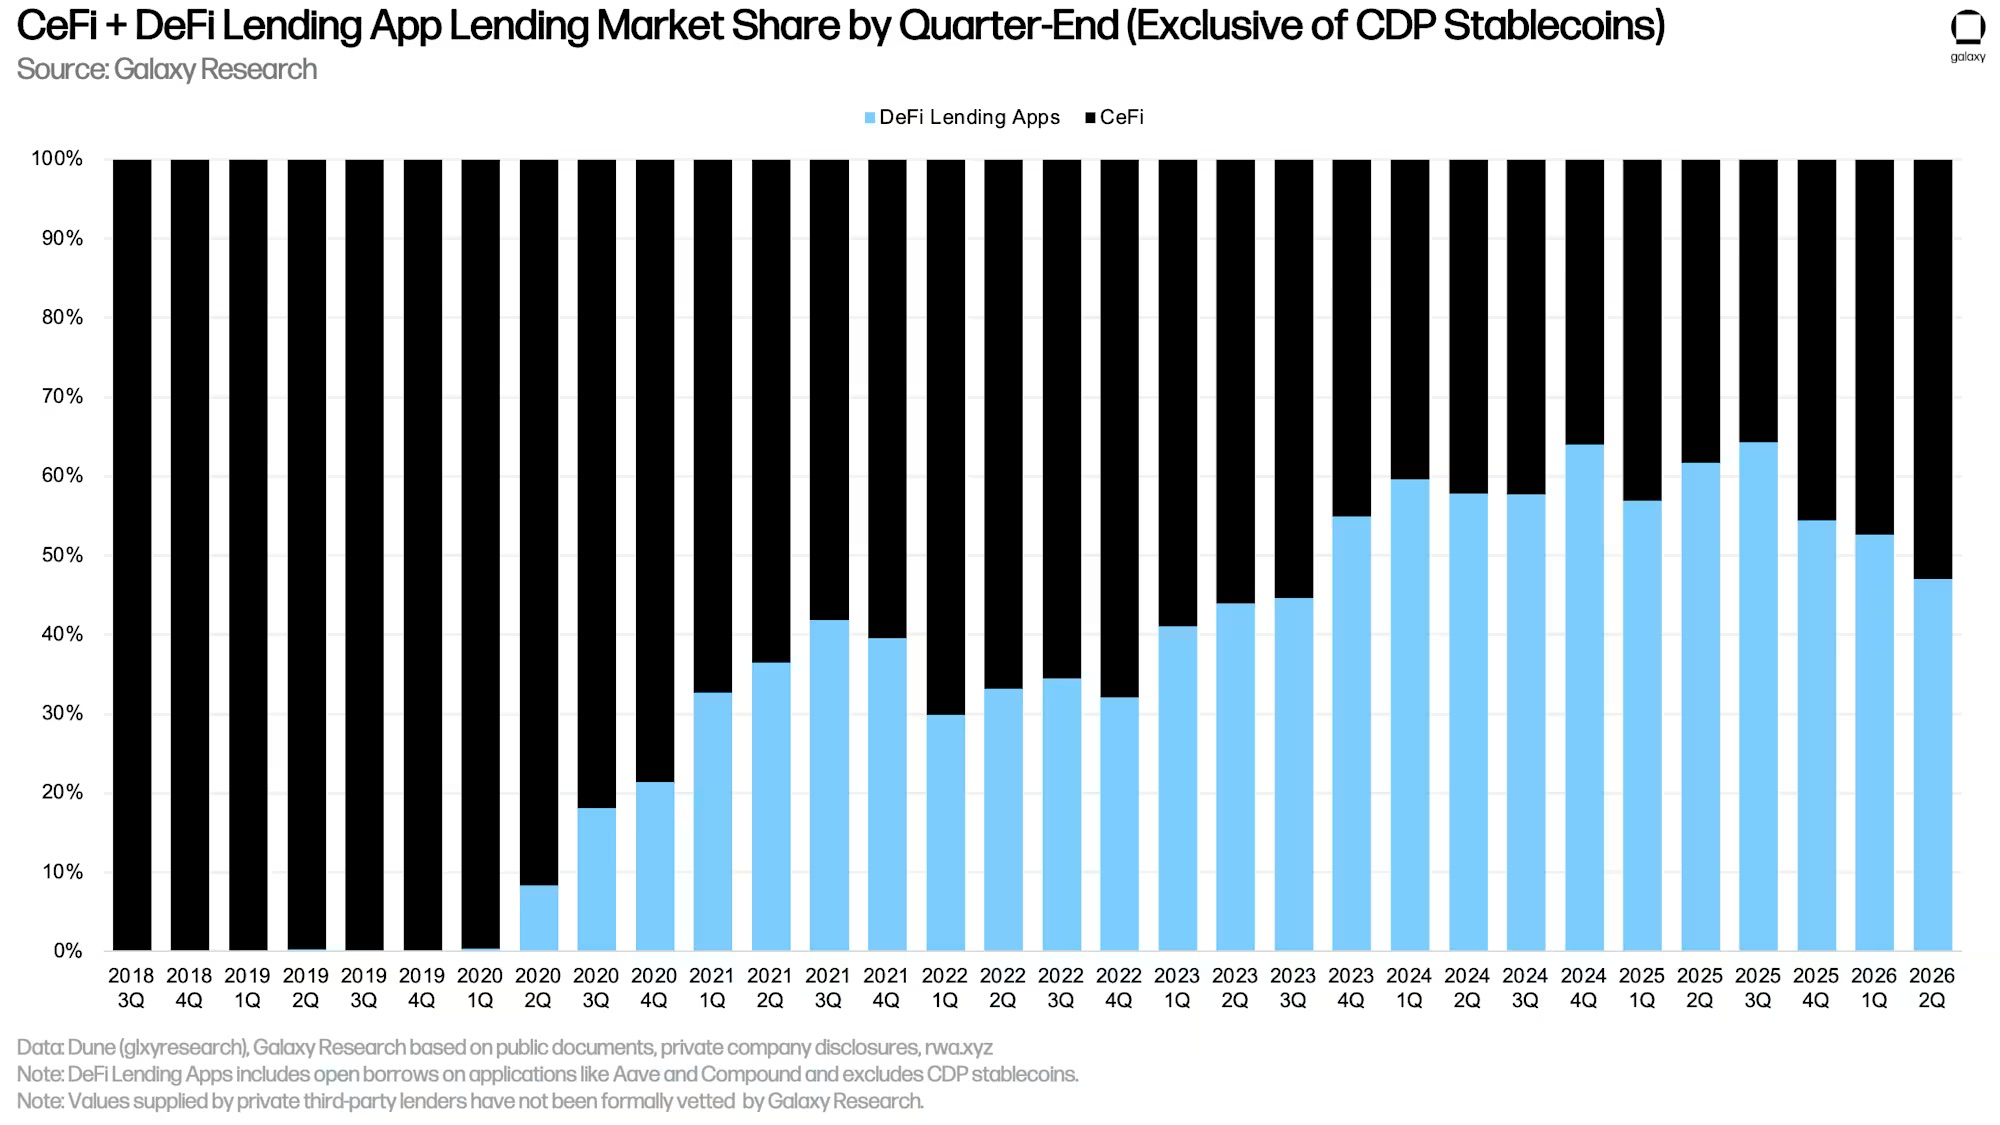
The month-on-month contraction in DeFi lending was greater than that of CeFi, leading to the disappearance of DeFi's previous scale advantage. By the end of the second quarter of 2026, the market share of DeFi lending applications fell back to 47.05%, a month-on-month decrease of 555 basis points; it was 52.6% at the end of the first quarter.
The third segment: the crypto collateralized portion of collateralized debt positions (CDP) stablecoins also saw a quarter-on-quarter decrease of $1.09 billion (‑7.86%). There is also a risk of double counting here: some CeFi institutions may raise funds through the minting of CDP stablecoins and subsequently lend to off-chain clients.
Overall, crypto asset collateralized lending shrank by $11.33 billion (‑16.78%) in Q2, down to $56.16 billion, which is a 40.13% decline from the peak of $78.69 billion in Q3 2025.
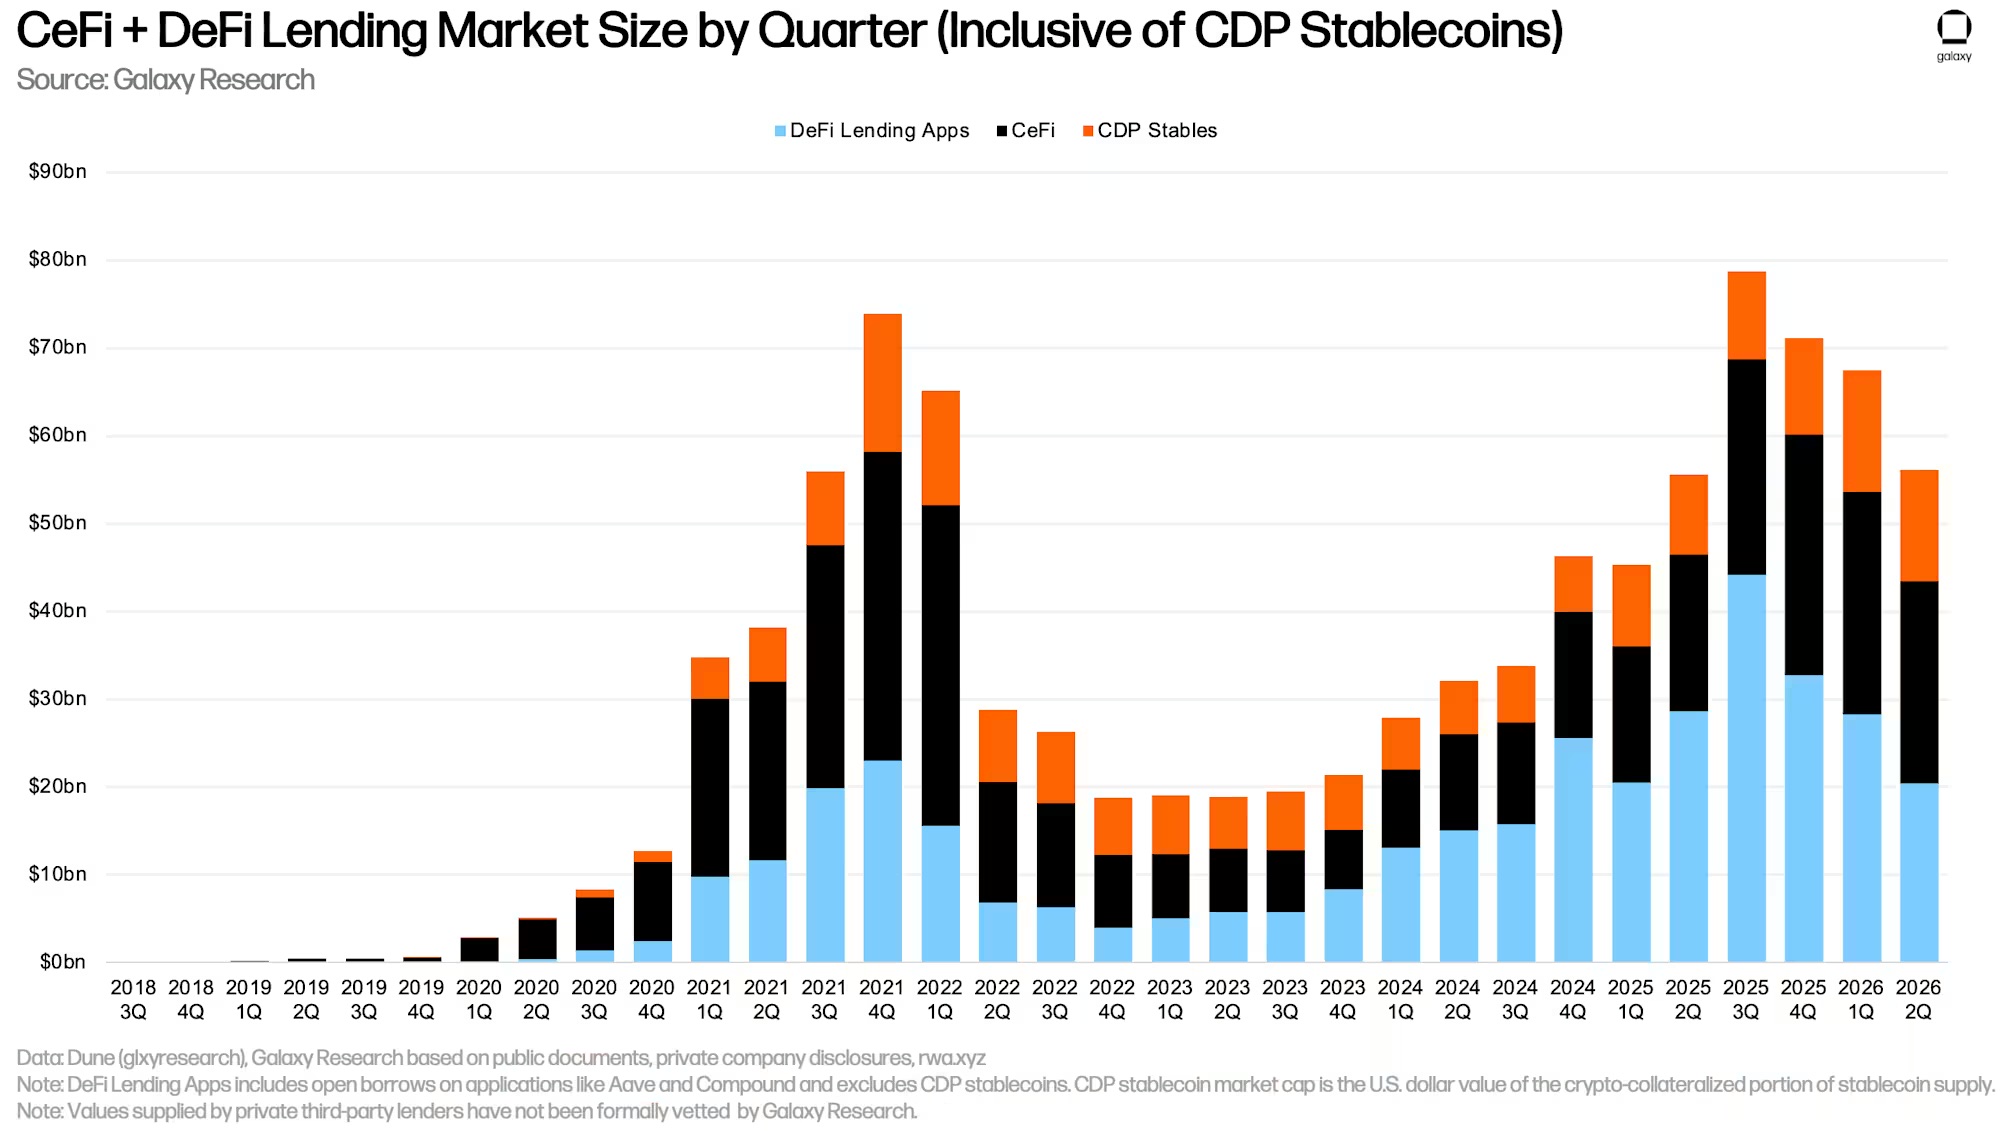
Market share breakdown at the end of Q2 2026:
- DeFi lending applications: 36.37% (month-on-month -544bp)
- CeFi lending platforms: 40.93% (month-on-month +324bp)
- Crypto collateral portion of CDP stablecoins: 22.7% (month-on-month +220bp)
Considering DeFi lending and CDP stablecoins as part of the on-chain lending track, the combined market share is 59.07%, with a month-on-month decline of 324 basis points.
More Observations on Decentralized Finance Lending
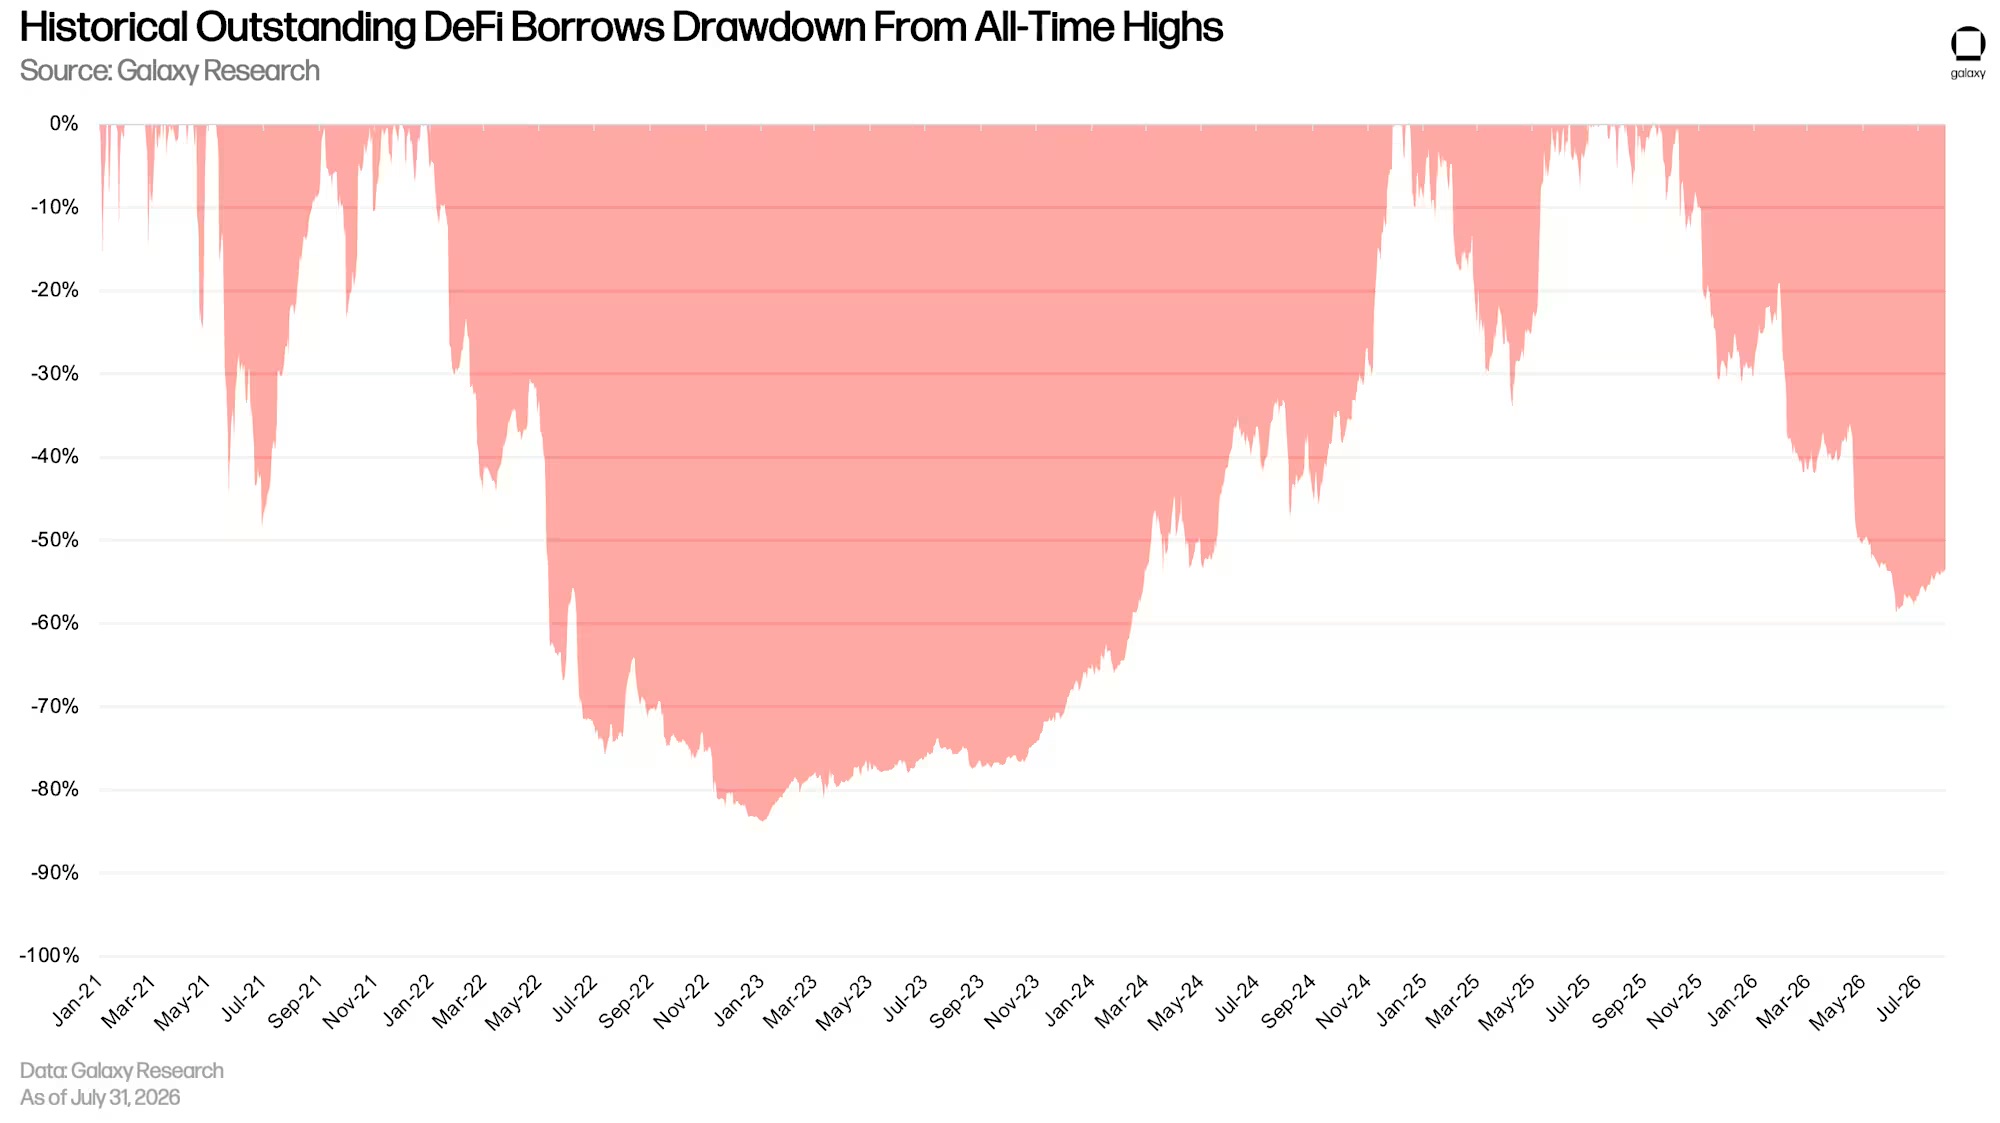
The outstanding loans of DeFi lending applications have continued to shrink since reaching a historical high of $47.13 billion on September 19, 2025; as of July 21, 2026, the scale is $21.94 billion, a decline of $25.19 billion, or 53.45% from its peak.
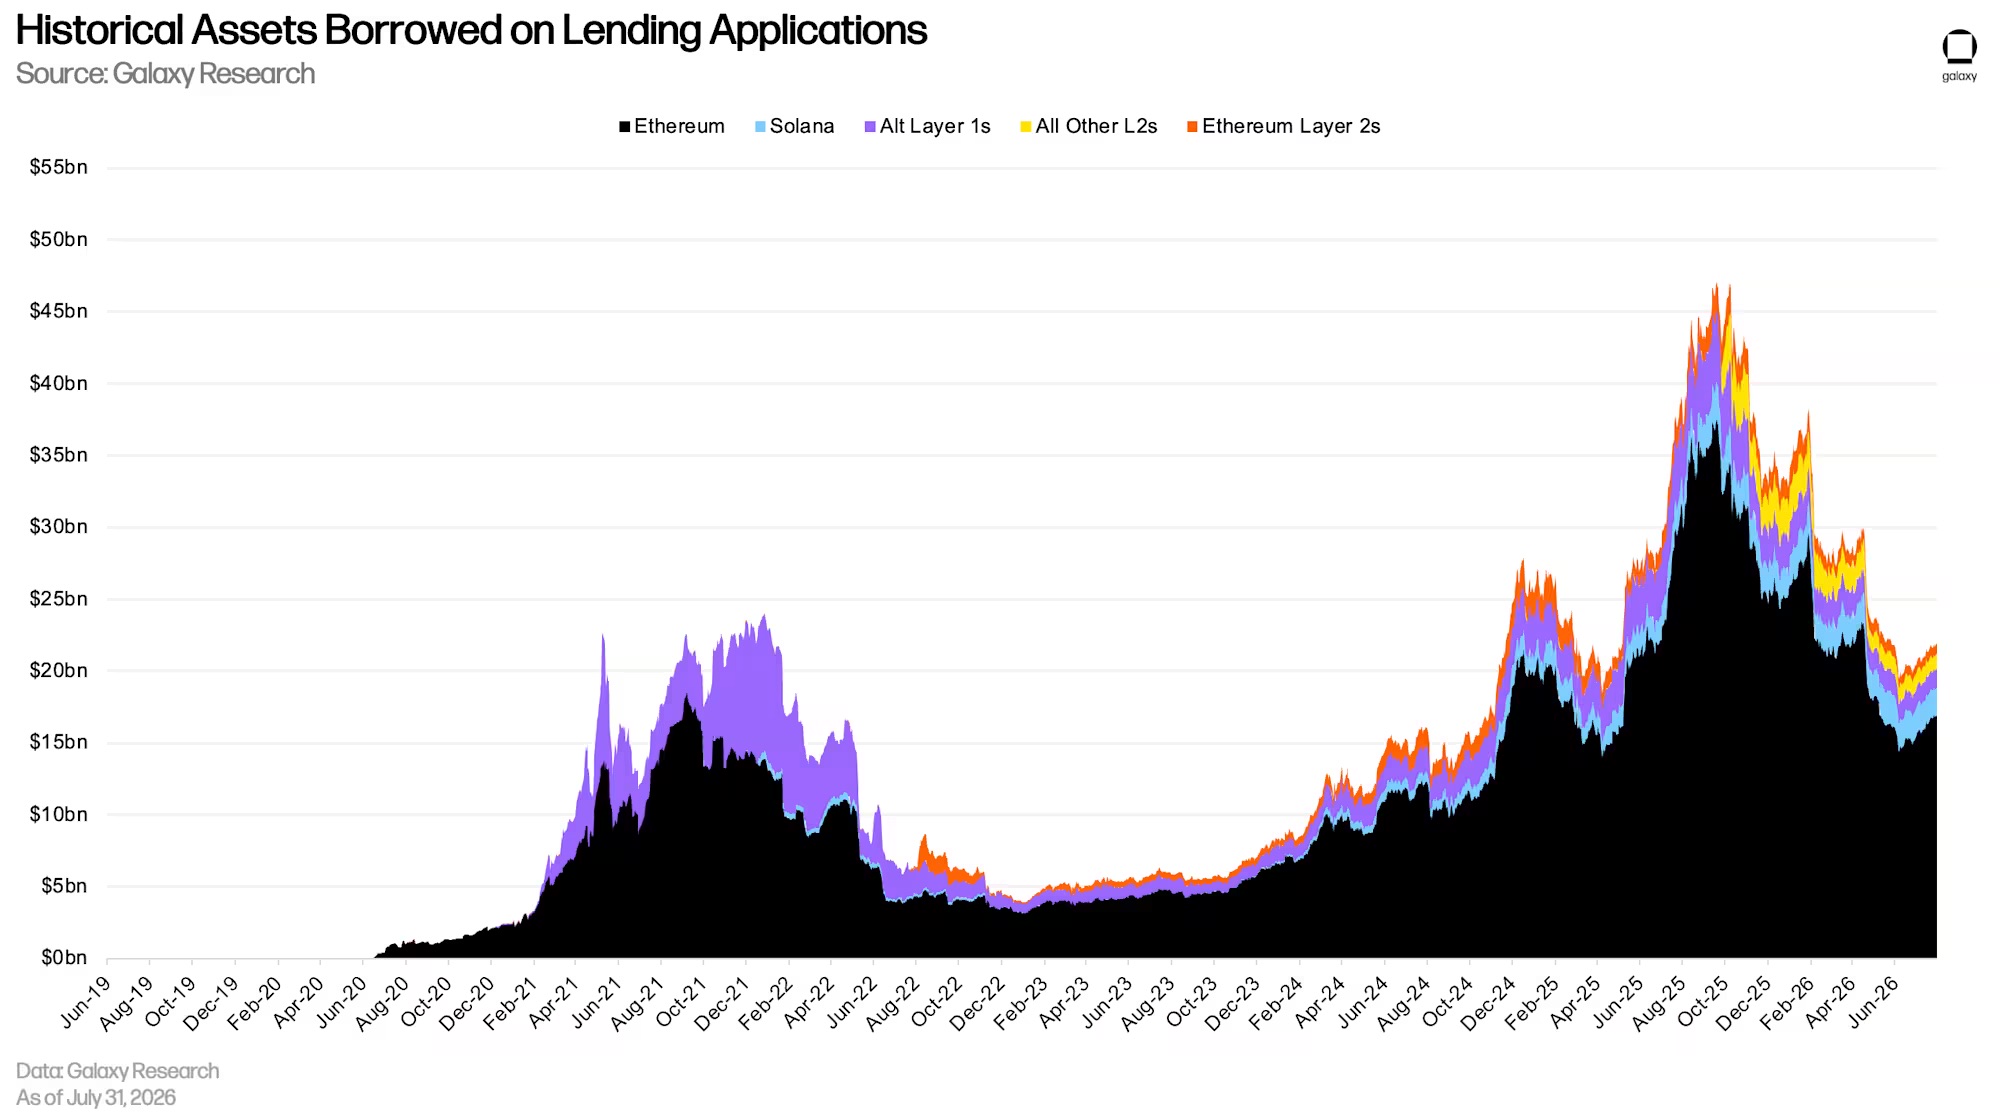
Since the end of the first quarter of 2026, the retracement of DeFi borrowing has continued to intensify, but recent signs of slight easing have emerged.
Stablecoins
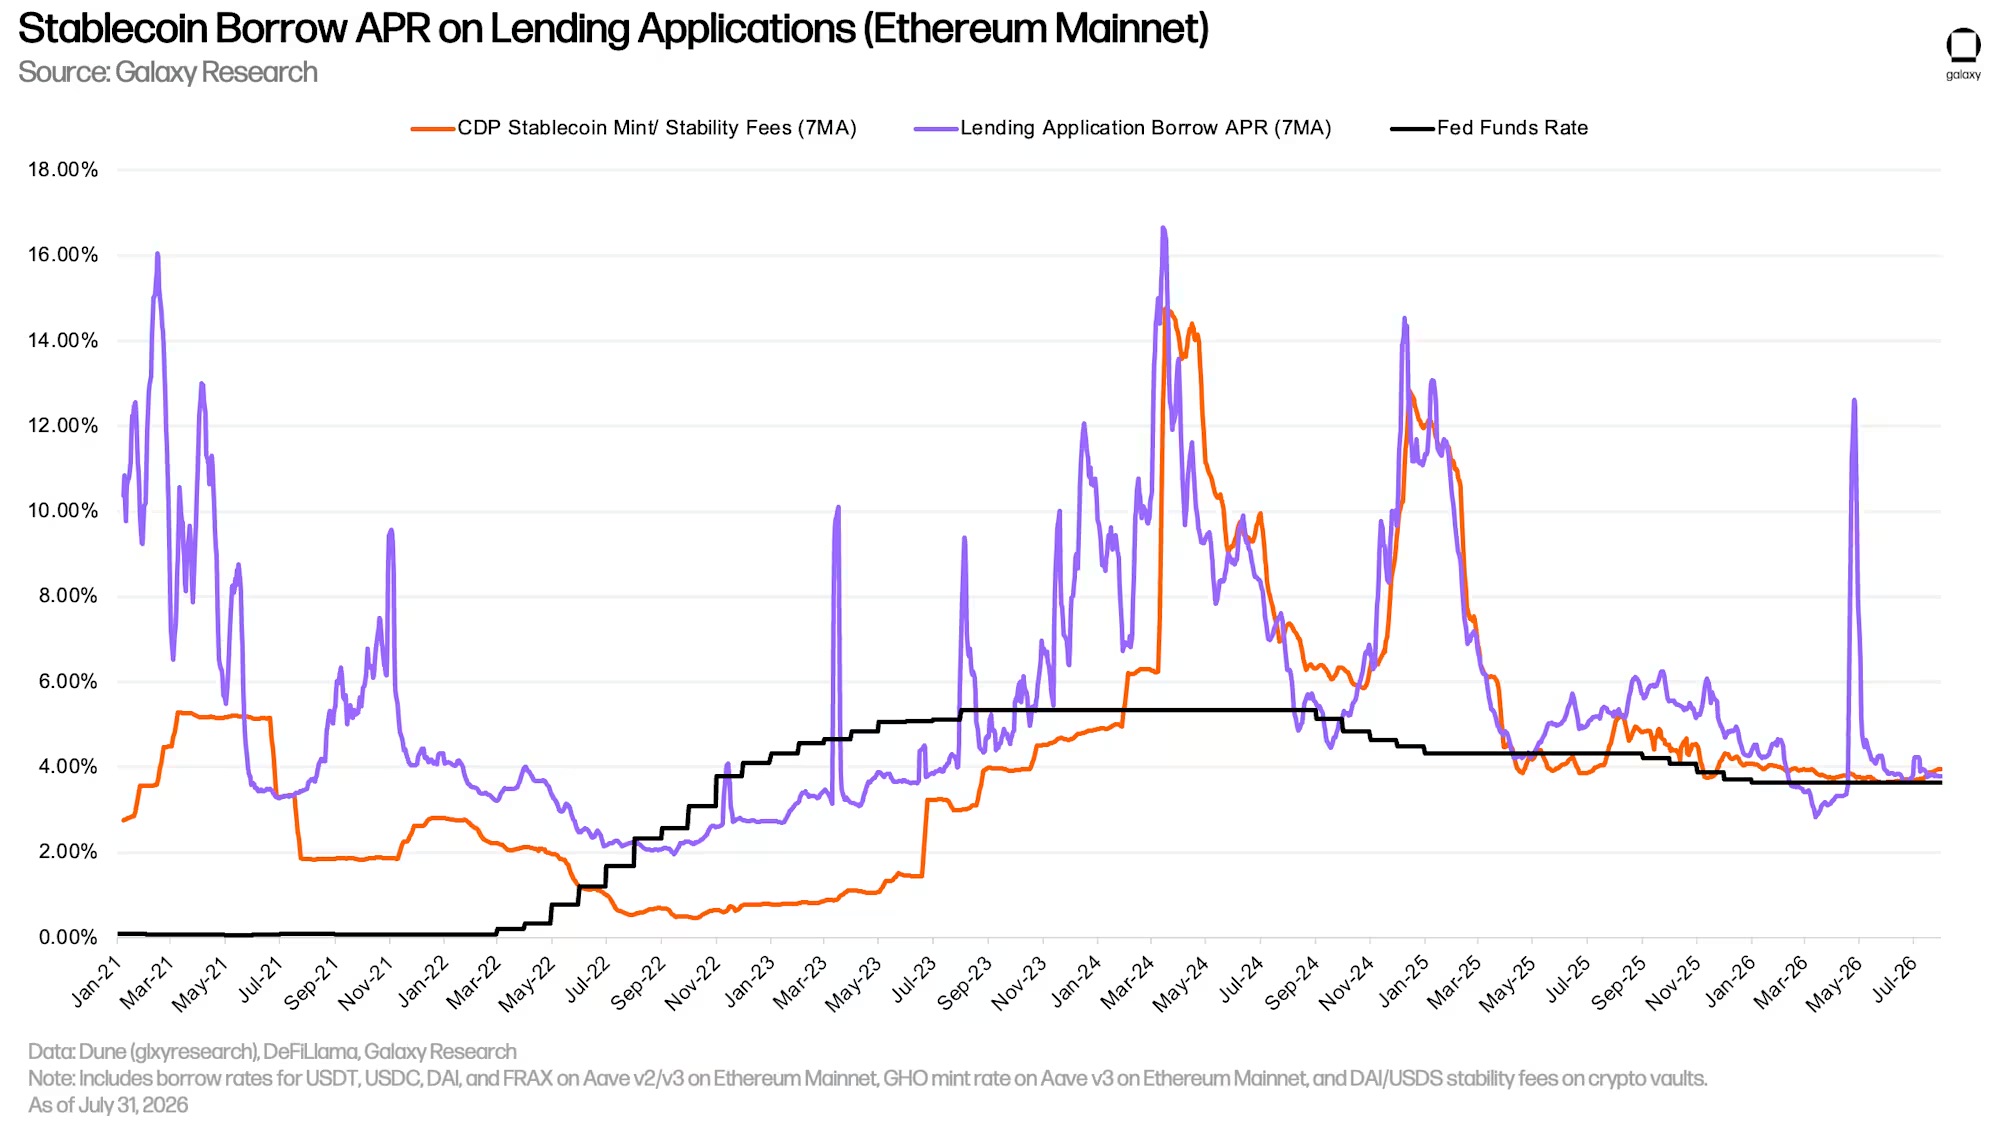
According to the 7-day moving average, from March 31 to June 30, the weighted average borrowing rate for stablecoins increased by 27 basis points this quarter; after the end of the quarter, the rate continued to rise to 3.88%.
This indicator combines the borrowing costs of lending protocols and the minting fees for CDP stablecoins, weighted according to the outstanding loan scale.
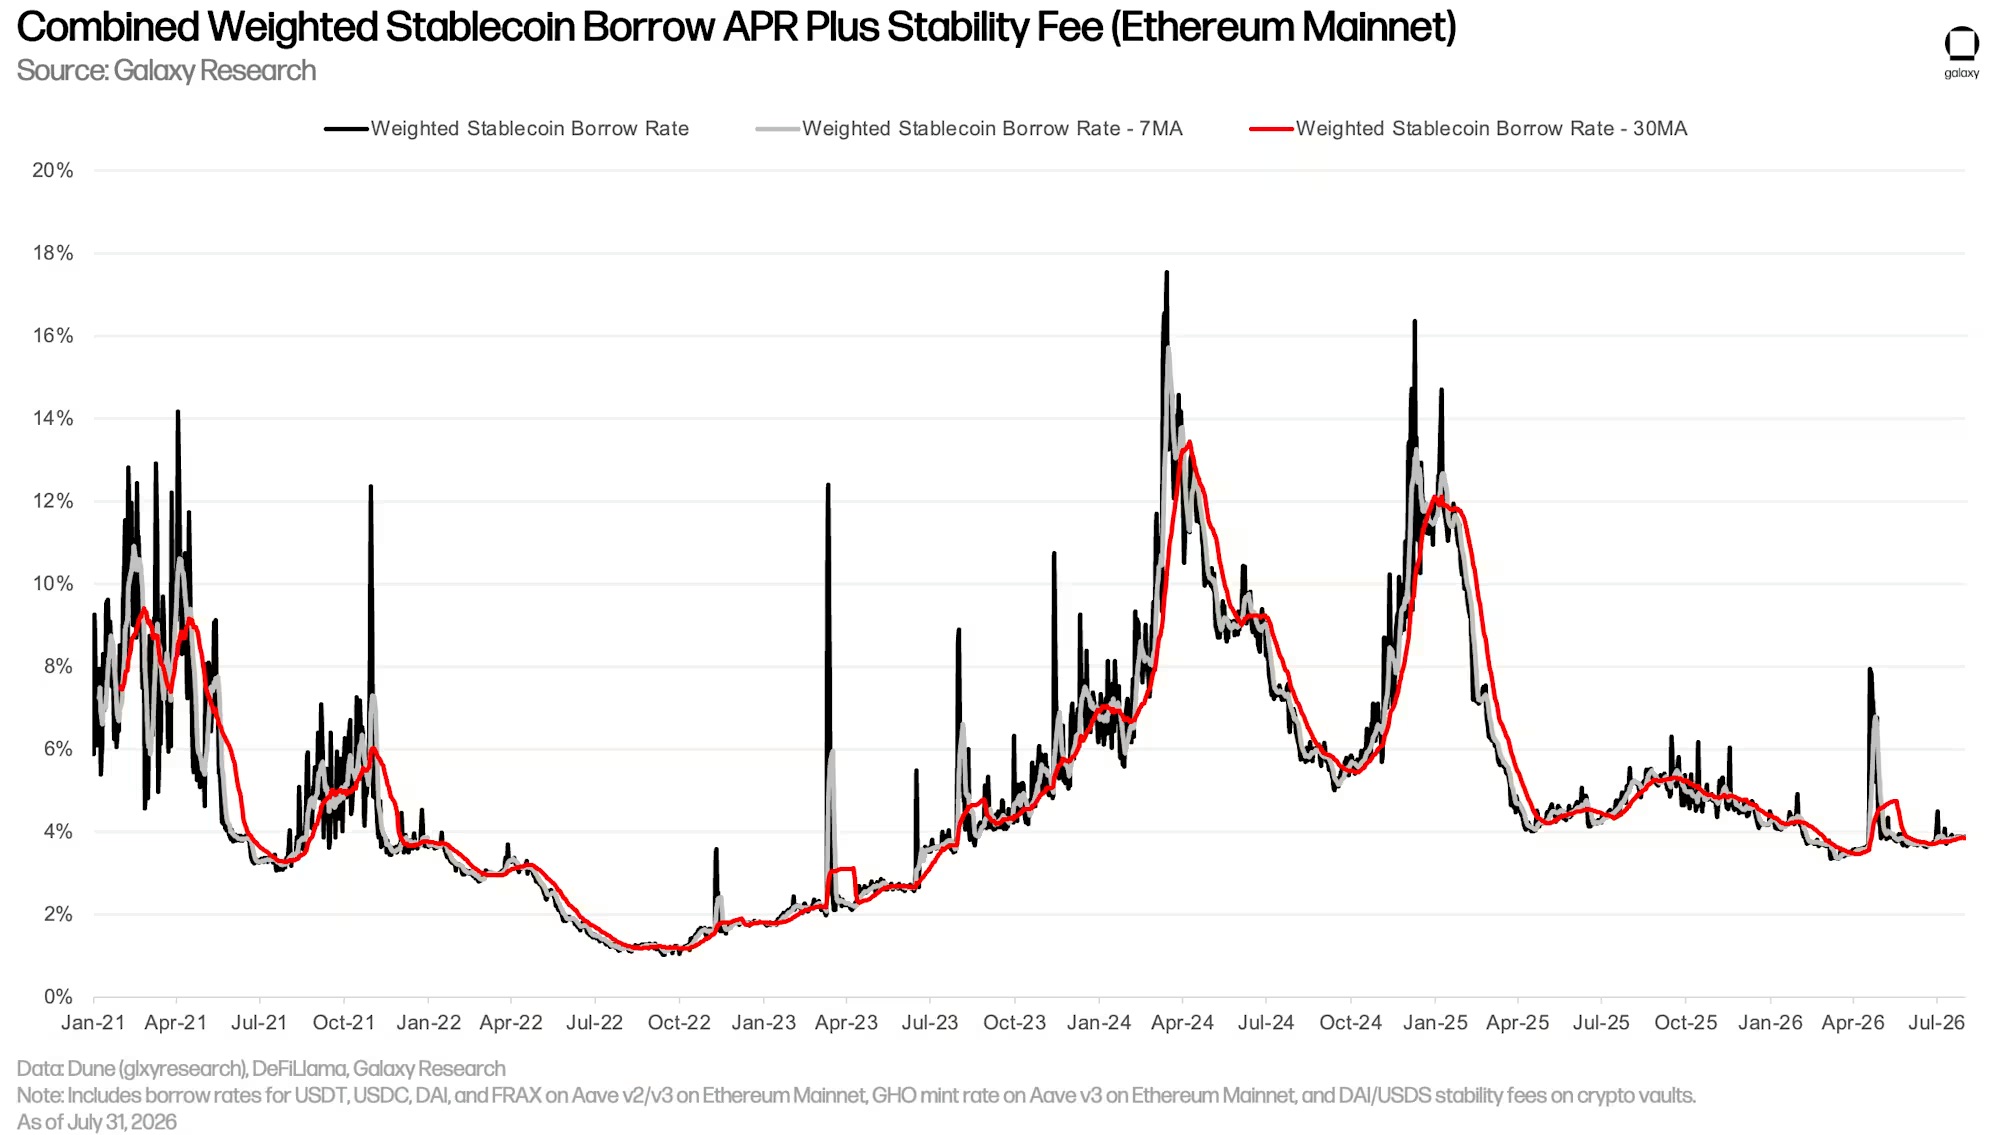
The following chart splits into two types of costs: borrowing stablecoins through lending protocols and minting CDP stablecoins with crypto collateral. The trends of both rates are highly correlated, but the CDP minting rate fluctuates less, as this rate is set manually on a regular basis and does not adjust to real-time market changes. Over the past 21 months, both rates have been supported at the bottom by the federal funds rate.
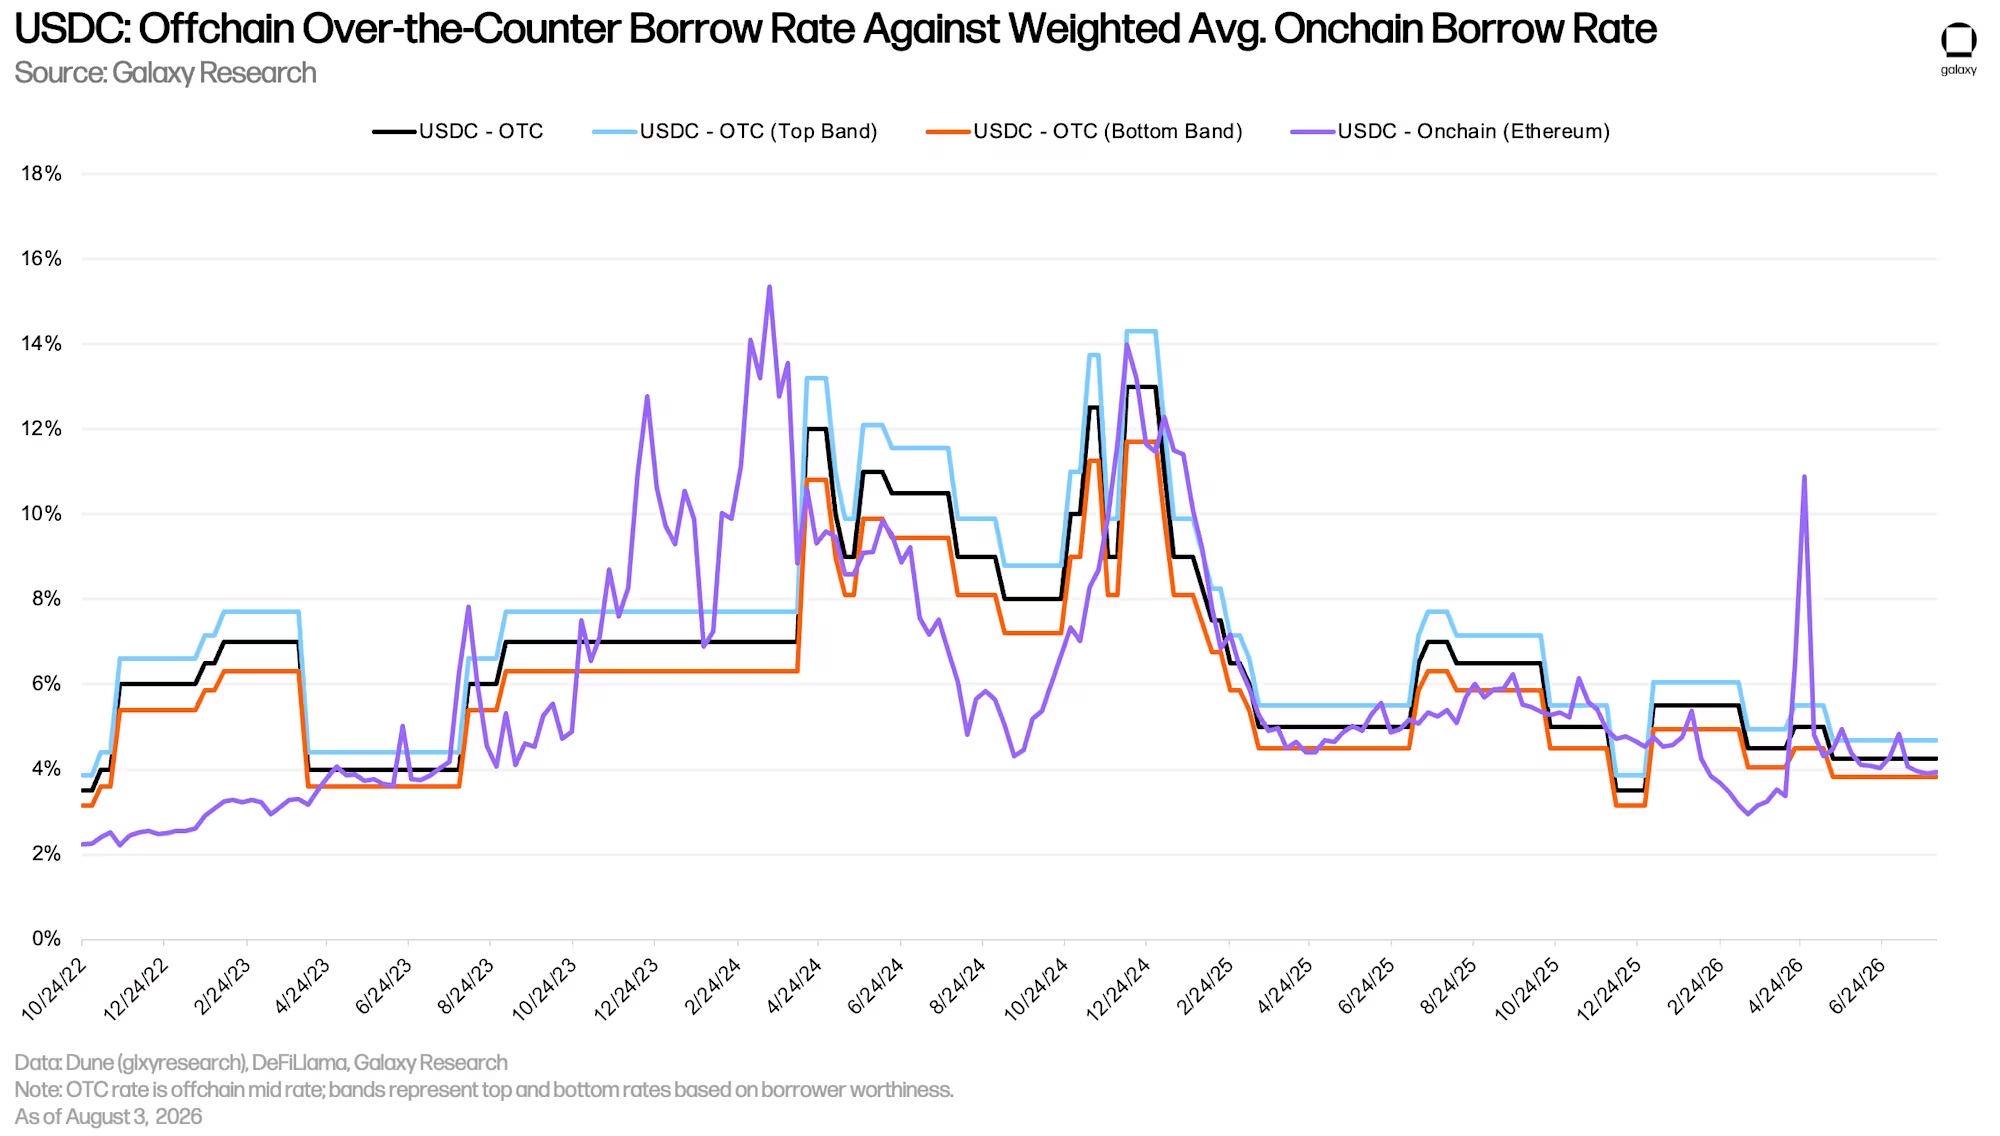
In Q2, the OTC benchmark rate for USDC ranged from 4.25% to 5%; at the end of the quarter, it remained at 4.25%, and this level continued until August 3.
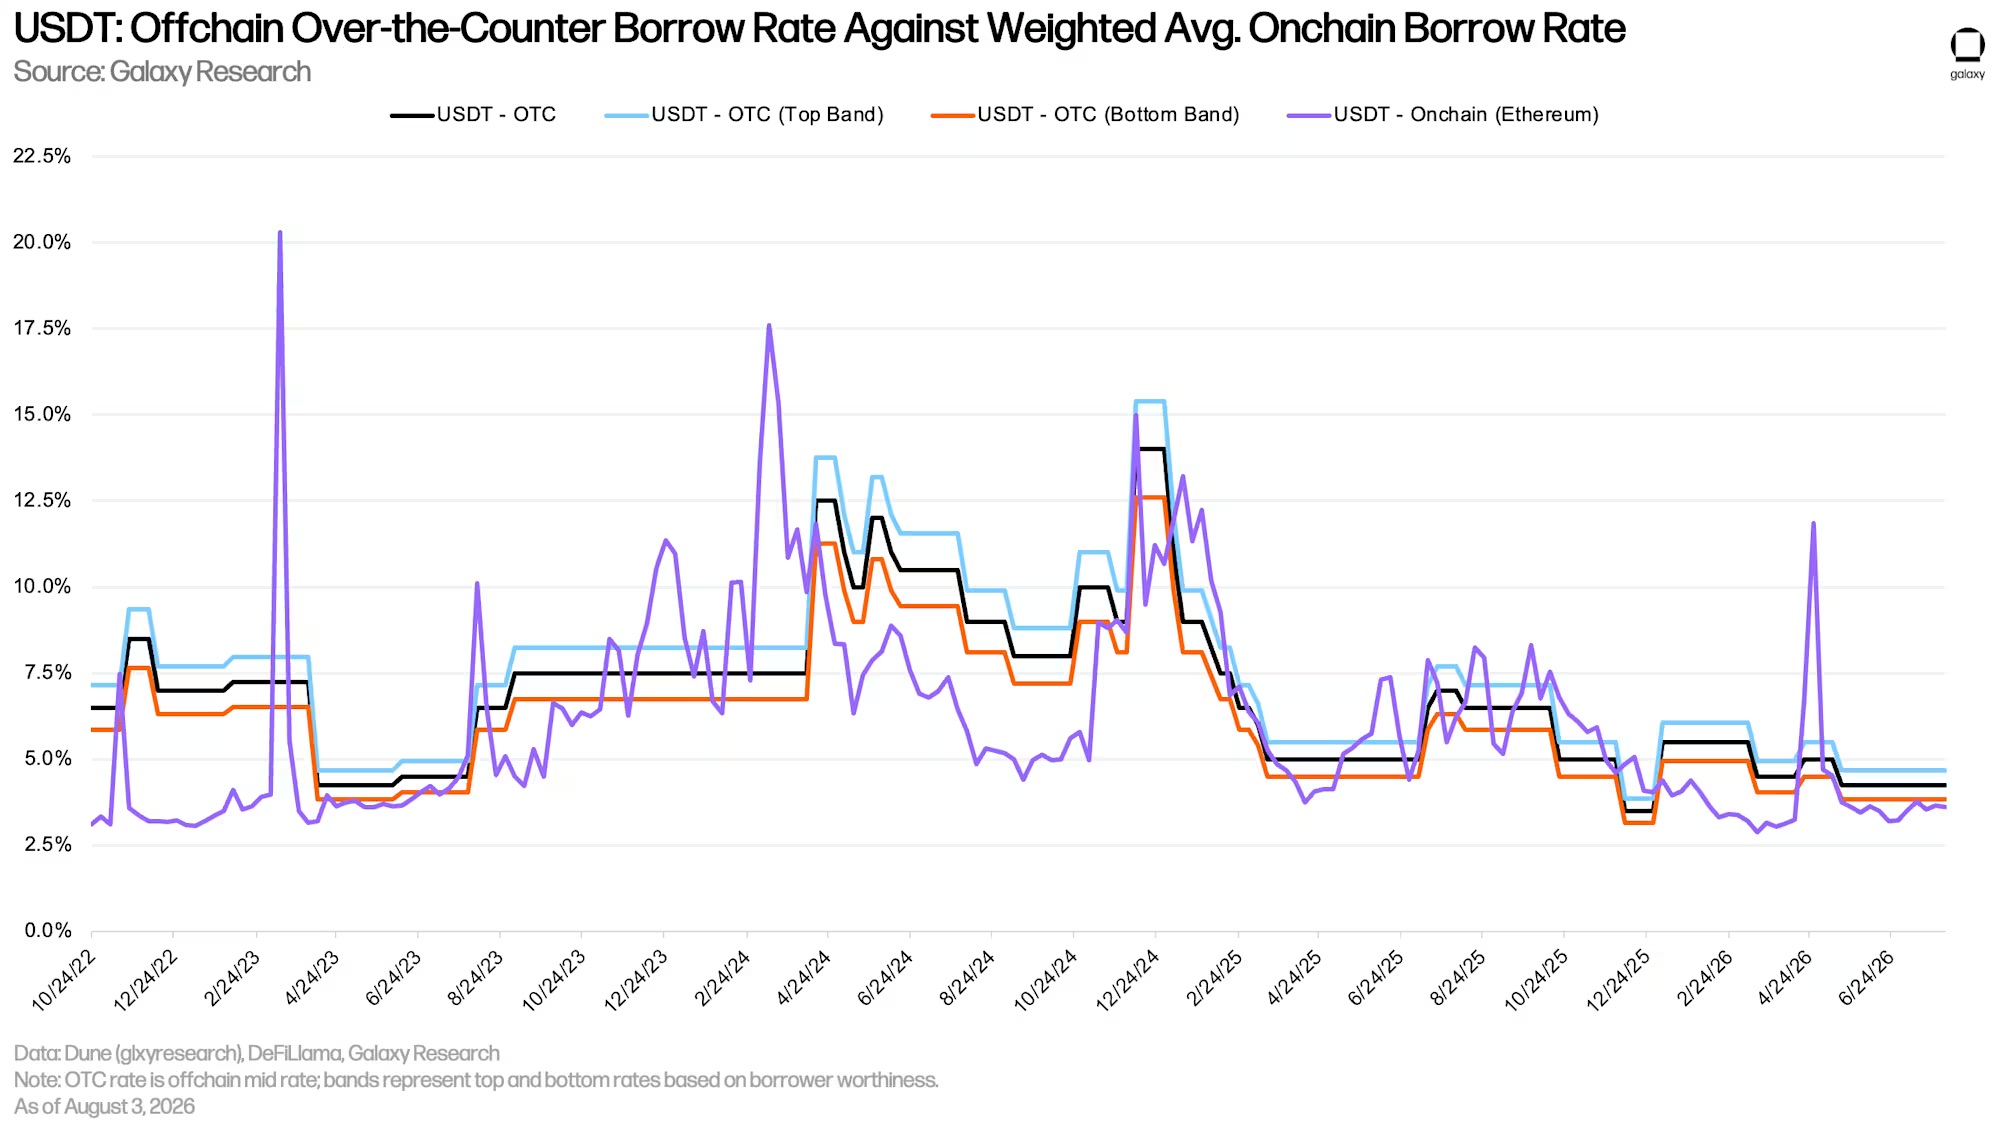
The USDT OTC borrowing rate also fluctuated within the range of 4.25% to 5%.
Bitcoin
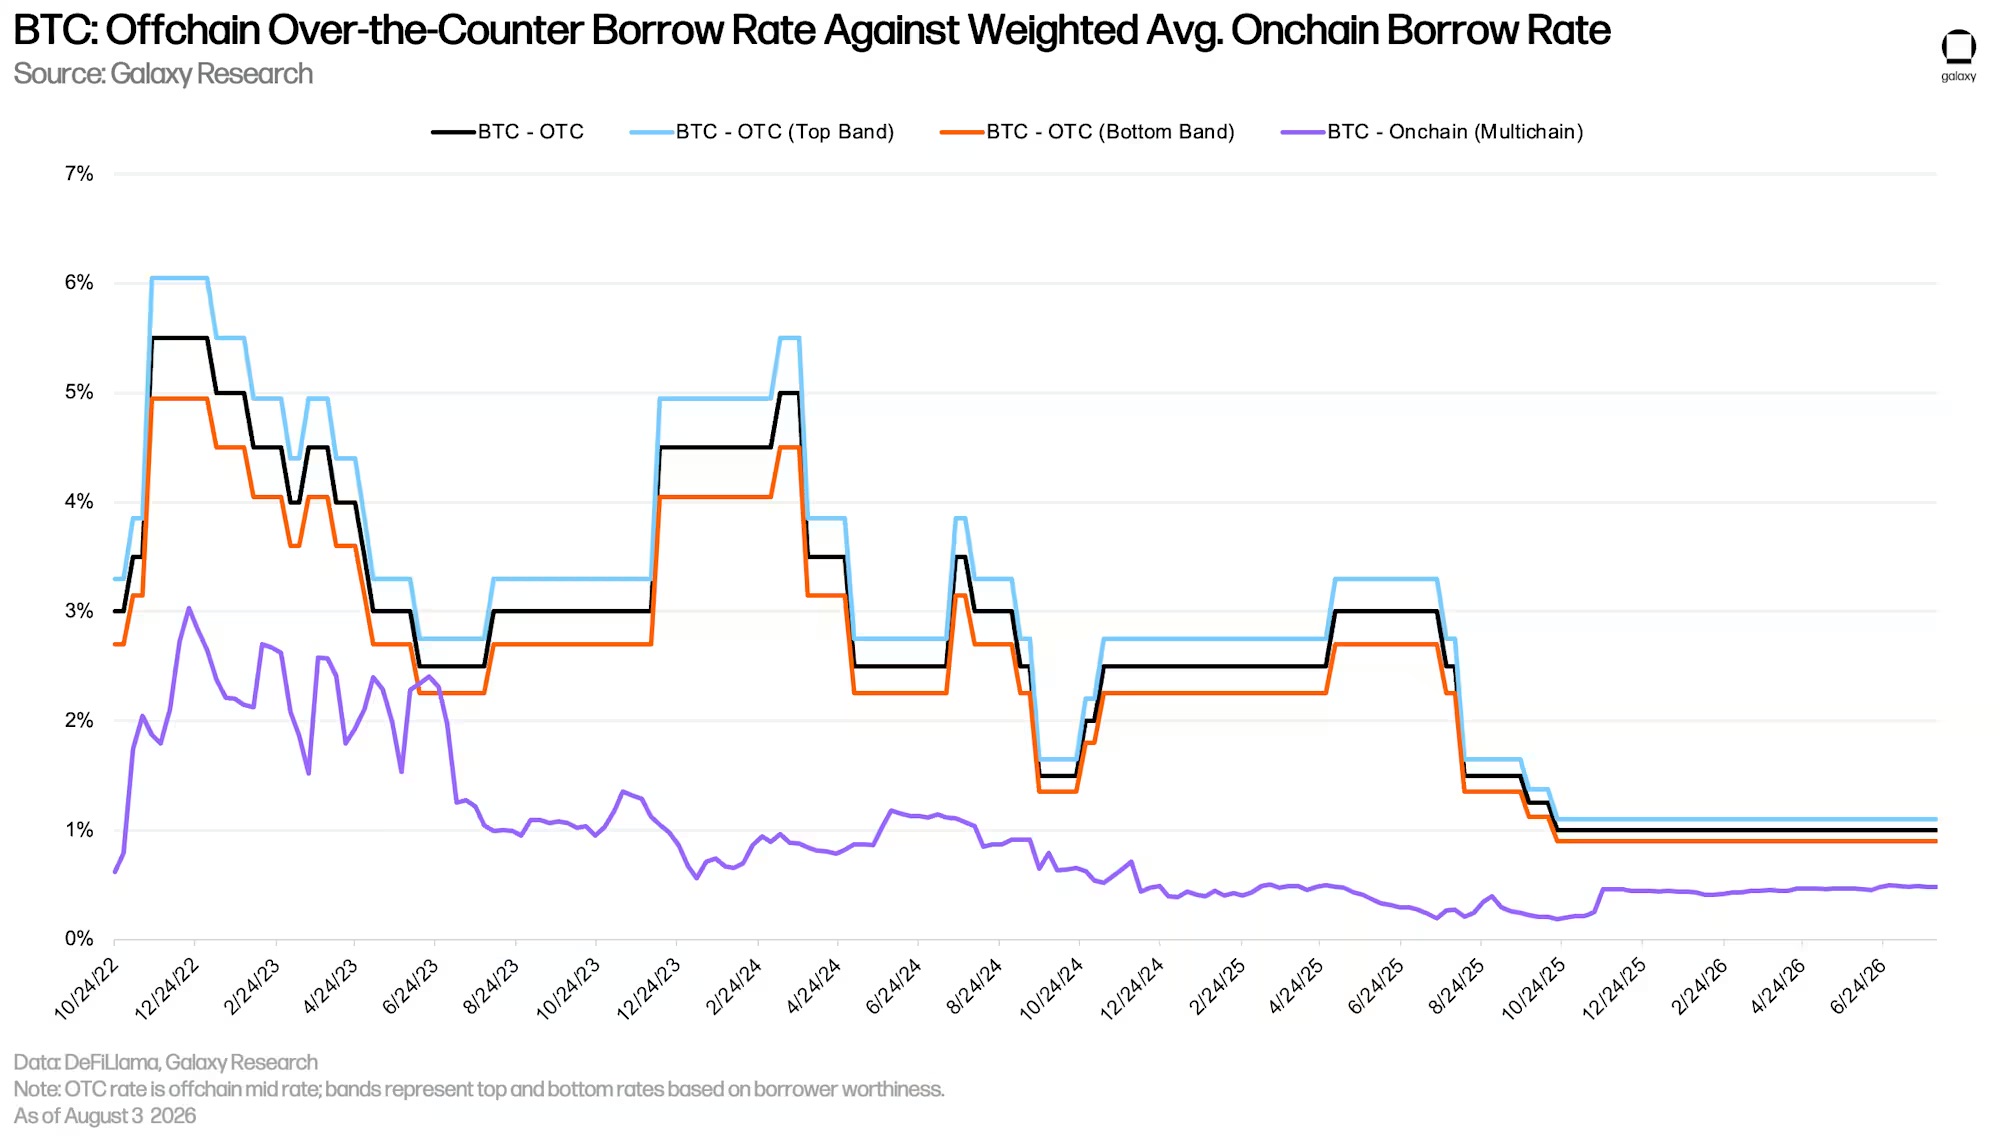
The chart displays the weighted borrowing rates for wrapped Bitcoin (WBTC) within various public chain lending applications. On-chain WBTC is generally used as collateral, and the borrowing demand is not strong; thus, borrowing costs have been relatively low for a long time. Unlike stablecoins, BTC on-chain borrowing rates are very stable, and the frequency of borrowing and repayment is quite low. In Q2, the on-chain BTC borrowing rate fluctuated between 0.44% and 0.5%.
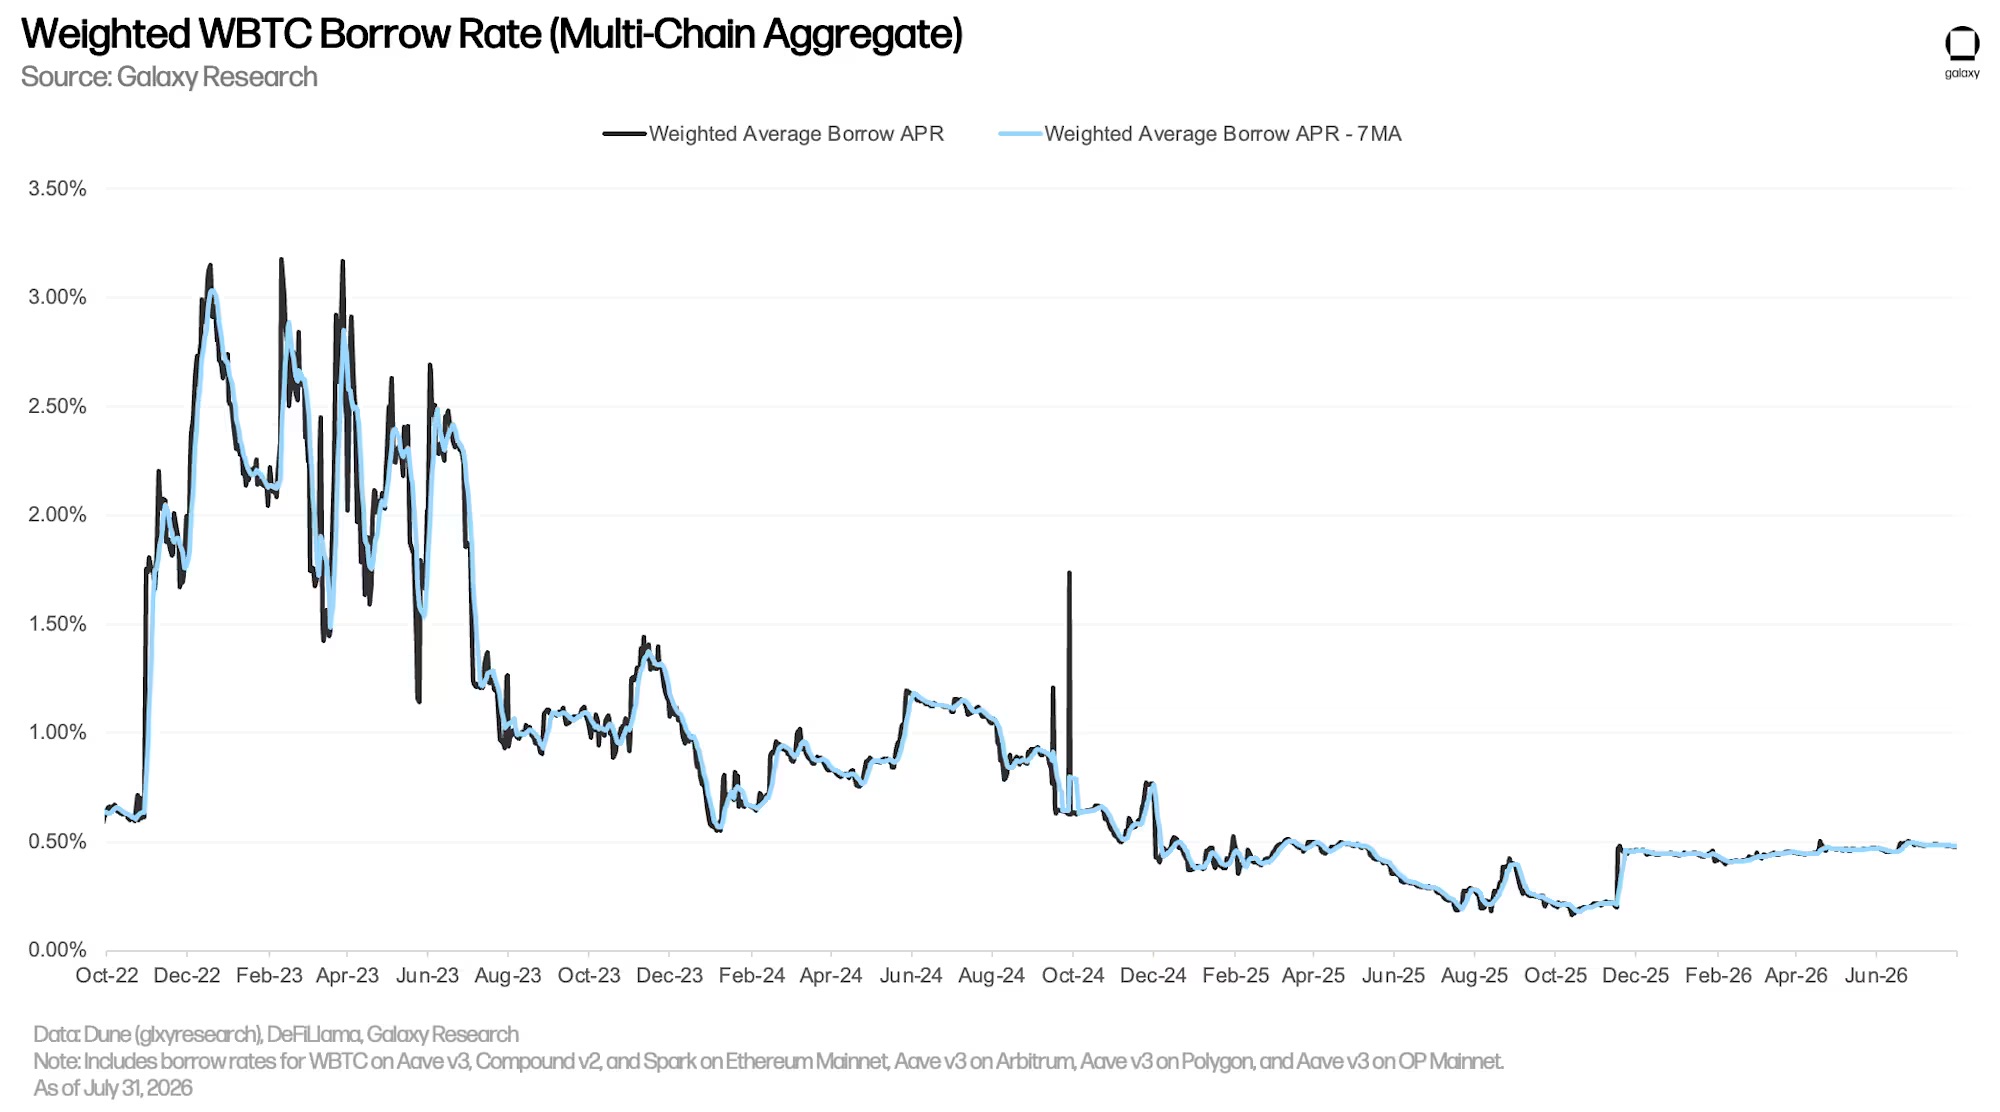
The historic price gap between on-chain and off-chain BTC borrowing rates continued to exist this quarter. The demand for BTC borrowing from the off-chain market stems from two sources: 1) the demand to short Bitcoin; 2) using BTC as collateral to borrow stablecoins or fiat. The demand from shorting is not common in the on-chain lending market, thus creating a cost gap between on-chain and off-chain.
The off-chain BTC rate remained unchanged at 1% this quarter.
ETH and stETH
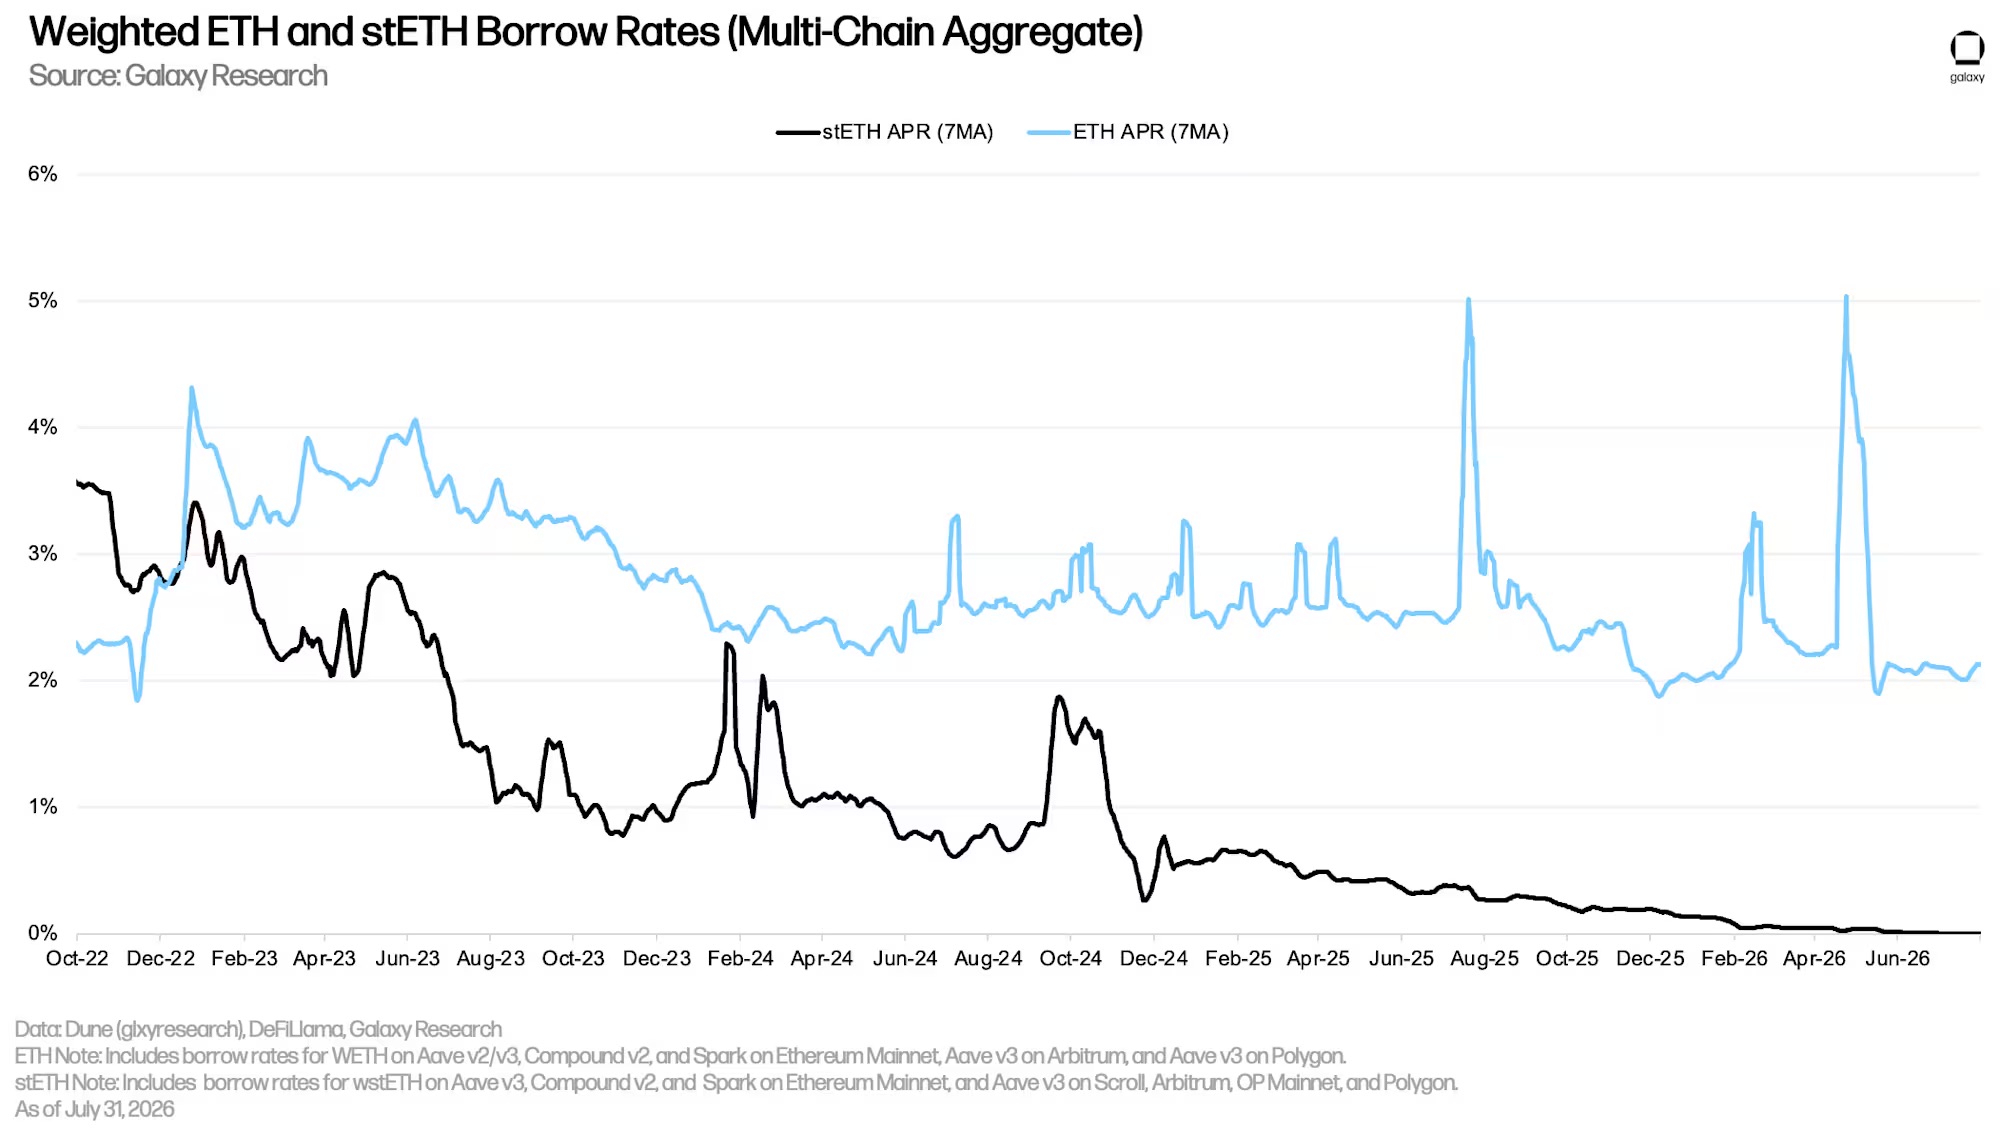
The following chart shows the weighted borrowing rates for ETH and stETH (staking Ethereum generated through Lido protocol) across various lending protocols on public chains. Historically, the borrowing costs for ETH have exceeded those of stETH due to the stronger borrowing demand for ETH.
Users frequently borrow ETH to implement leveraged strategies: staking stETH (the certificate obtained from staking ETH via Lido), borrowing ETH, and gaining leveraged exposure to Ethereum staking annualized yield. Under normal market conditions, the borrowing cost for ETH averages within 50 basis points of the Ethereum staking APY. Once the borrowing cost exceeds the staking yield, the strategy loses its cost-effectiveness, making it difficult for borrowing APY to remain consistently above staking yield.
Similar to WBTC, stETH is mostly used as collateral, so the cost of borrowing stETH is usually very low.
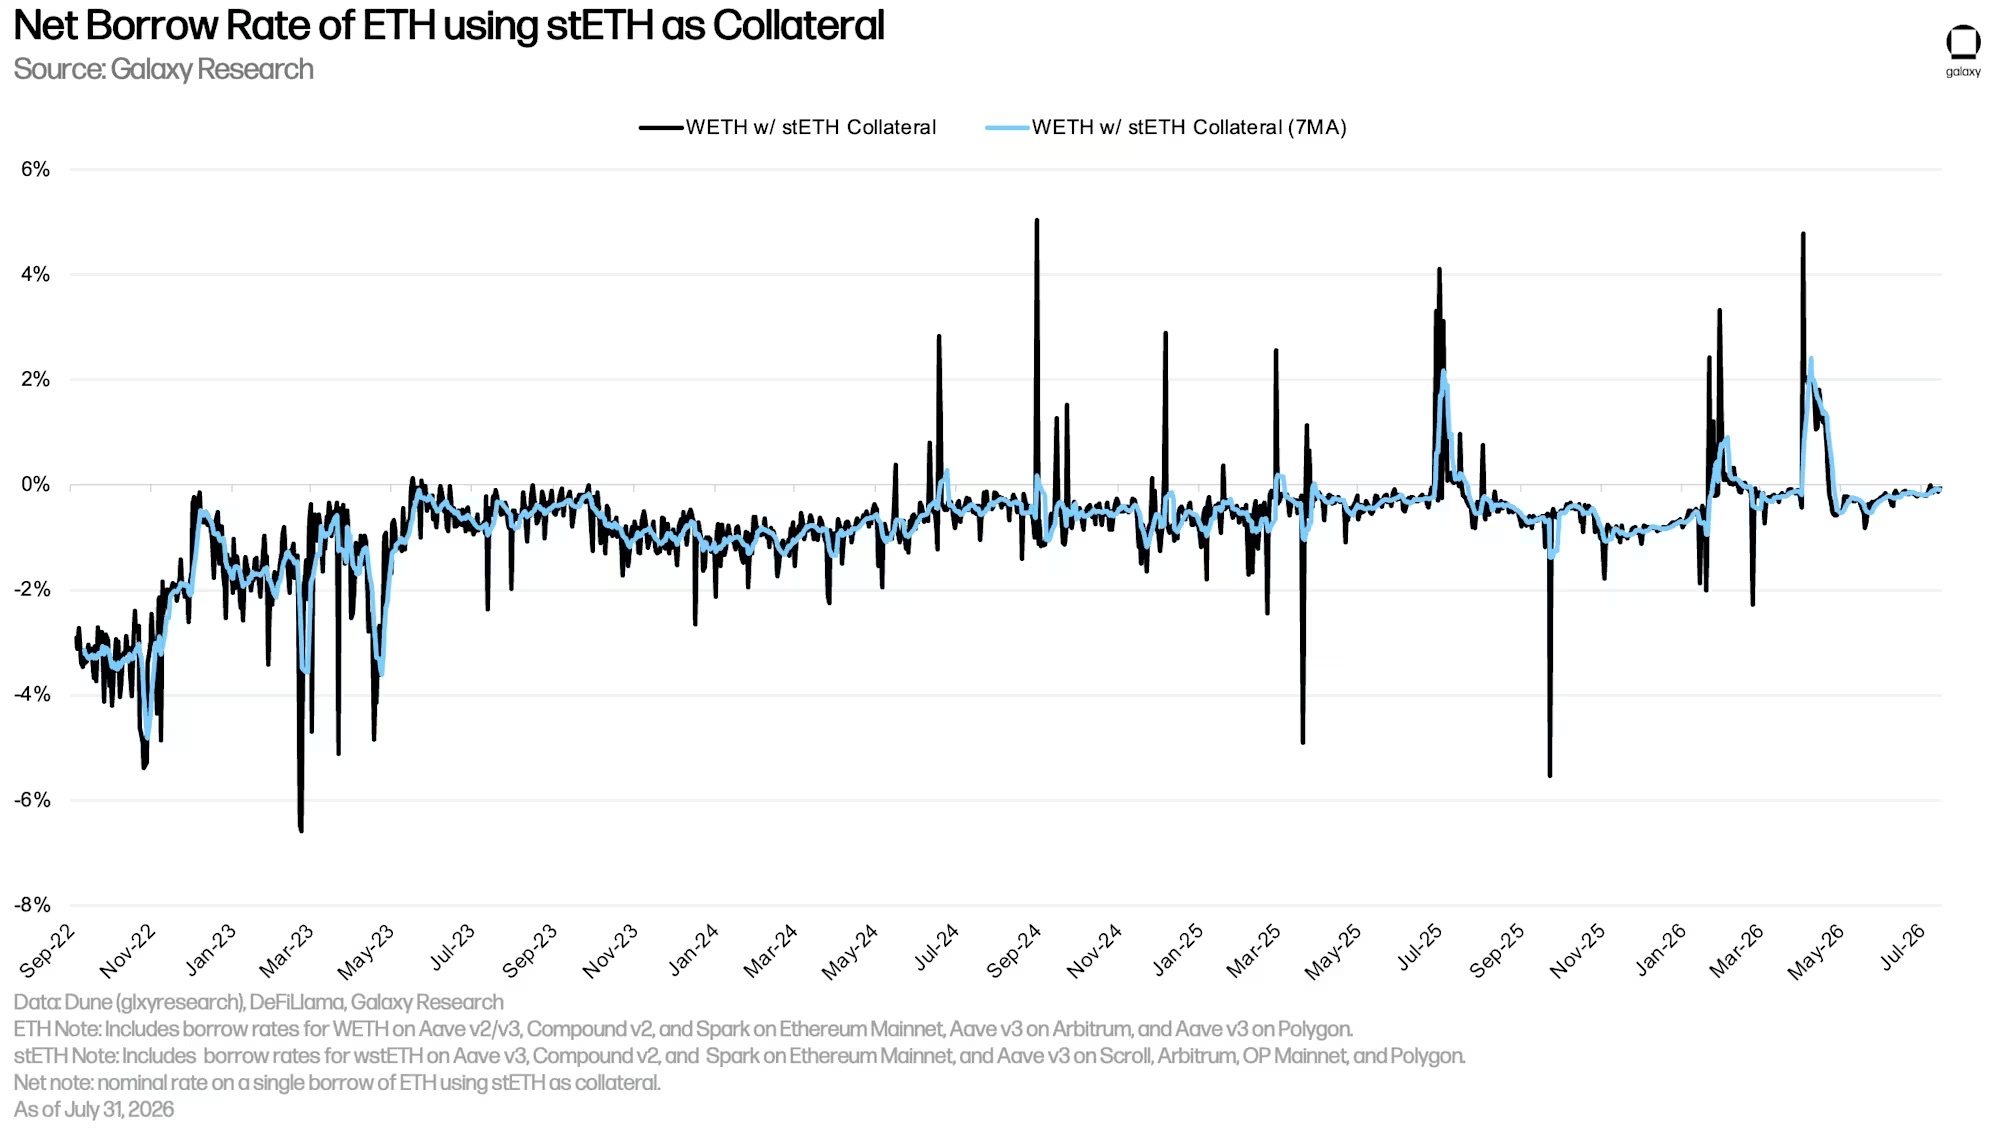
Users can use liquid staking tokens (LST) and liquid re-staking tokens (LRT) that can earn interest as collateral to borrow ETH at very low or even negative net rates. This leads to a classic circular strategy: repeatedly depositing LST/LRT as collateral, borrowing unstaked ETH, then staking the ETH to obtain new LST/LRT, and continuing to borrow more ETH to amplify staking yield exposure. The prerequisite for this strategy to work is that the cost of borrowing ETH must be lower than the annualized staking yield obtainable through LST/LRT. Except for a few special periods, this strategy can usually run smoothly.
ETH Off-chain Borrowing Rates
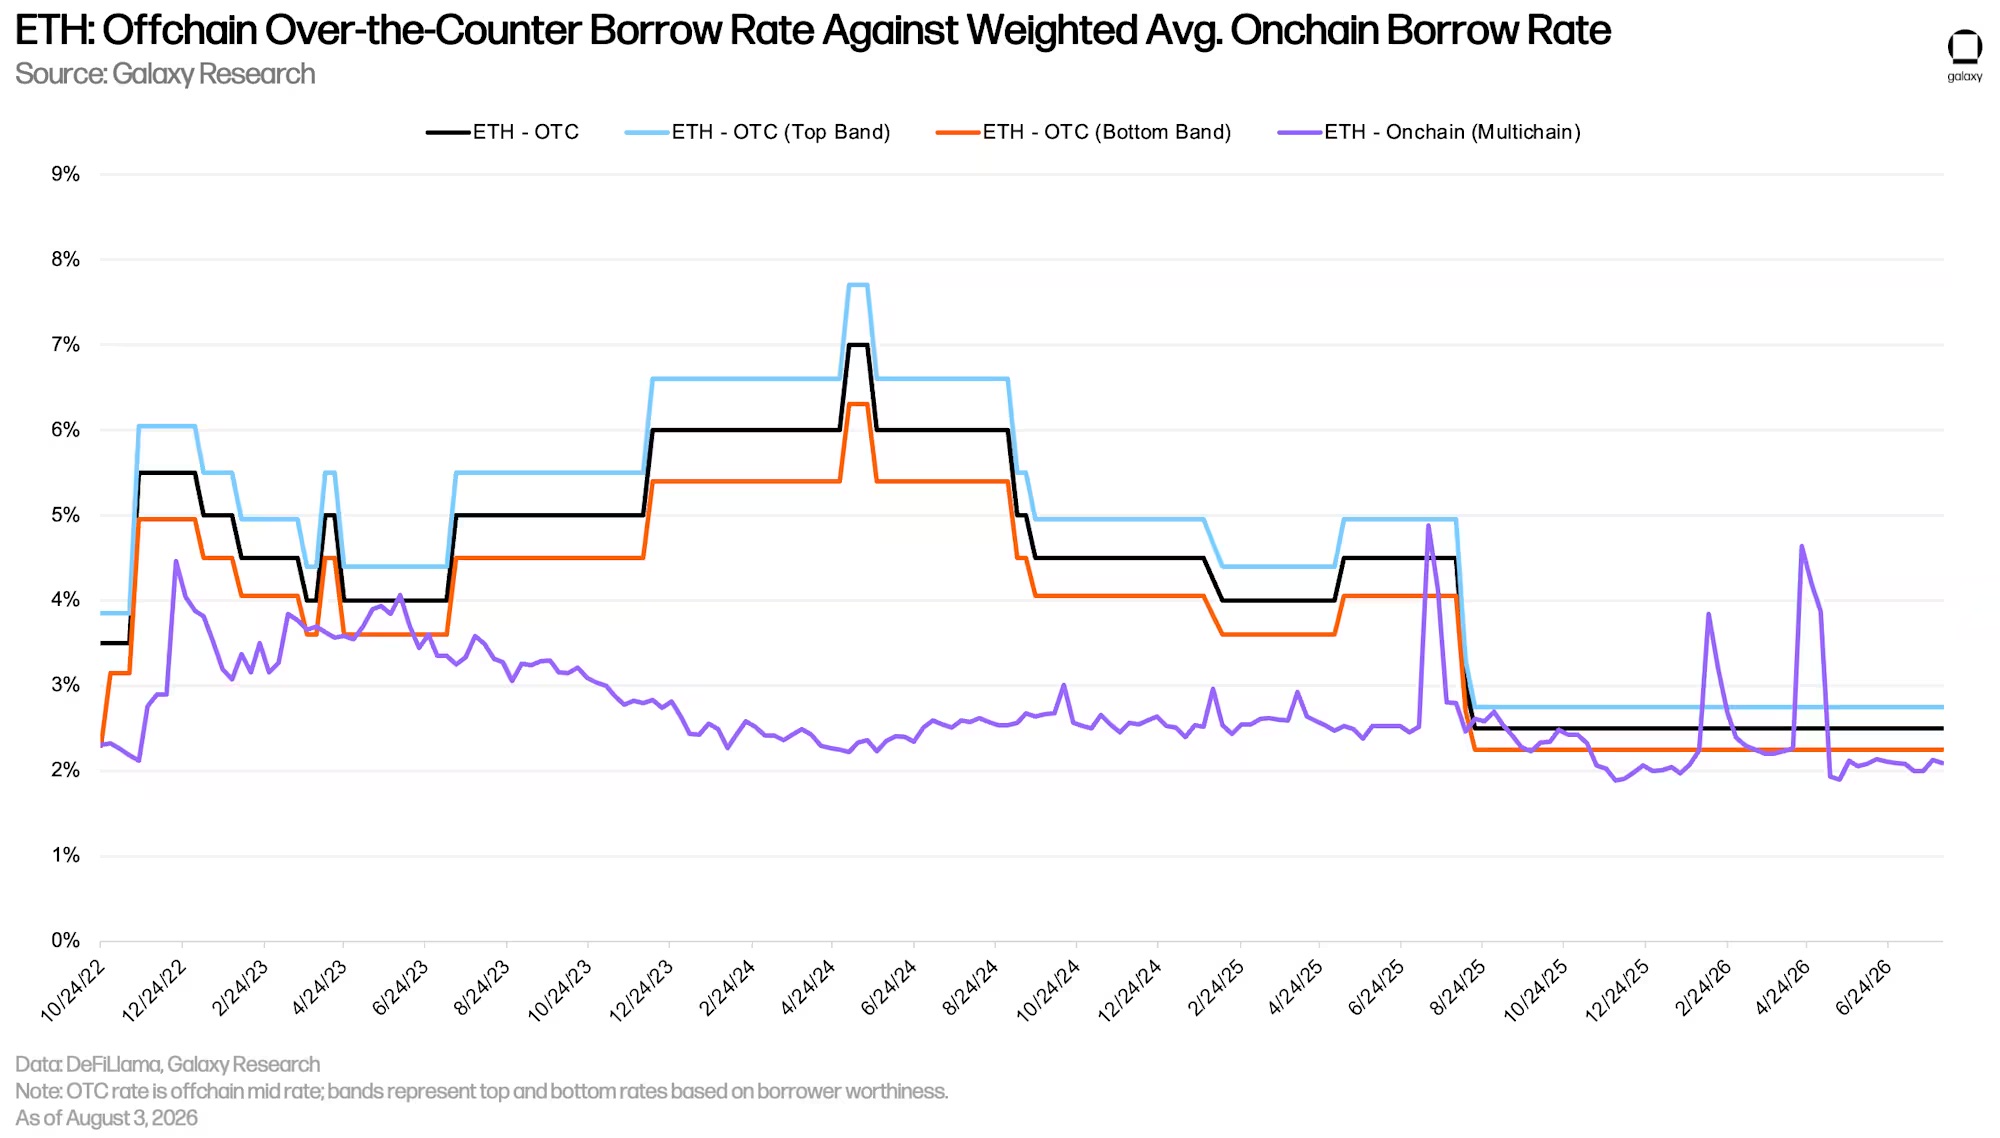
Similarly to BTC: the borrowing cost to borrow ETH through on-chain applications is generally lower than off-chain borrowing. Two main reasons:
- The off-chain borrowing demand from short sellers is not commonly seen on-chain;
- The Ethereum staking yield has become the floor for off-chain borrowing rates: asset suppliers are unwilling to lend assets off-chain at rates lower than staking yields. In contrast, in the on-chain market, the staking yield is often the upper limit for ETH borrowing rates.
Aave Lending Book Analysis
Below is a deep analysis of the Aave V3 core instance (currently the largest on-chain lending market) after applying filtering rules:
- Minimum debt threshold ($100): Aggregated statistics exclude positions below this threshold to filter small garbage positions; however, this will bias the statistical results towards larger loans.
- Health factor HF upper limit (HF ≤ 50): Positions with health factors above 50 at the snapshot are not included in core statistics; these over-collateralized positions are typically of small amounts and have little risk analysis significance. Within the threshold, the weighted average health factor and percentile statistics only include positions with 1 ≤ HF ≤ 50; positions with HF < 1 are not included in health factor statistics, while those with HF = 1 are included.
The higher the health factor, the safer the position; a health factor below 1 indicates the position triggers liquidation conditions. The health factor calculation formula = (Total collateral value × Weighted average liquidation threshold) ÷ Total borrowing amount.
- Debt-to-Equity ratio D/E: Only positions where the value of collateral exceeds the debt (net assets are positive) are included; positions with negative net assets are excluded from D/E distribution and the weighted average D/E. This rule is independent of the $100 debt threshold: even if a loan exceeds $100, if it does not have positive net assets, it is also excluded from D/E statistics.
Based on the snapshot of 2026-08-07, there are a total of 19,073 effective outstanding loans after filtering. The loans categorized as "efficiency mode (e-mode)" account for only 8.91% of the total positions, yet the outstanding debt size of e-mode is almost equal to that of regular loans. The feature of e-mode is that the borrowing asset is highly correlated with the collateral asset (e.g., borrowing WETH with ETH collateral). According to Galaxy’s previous statistics on April 22, e-mode debt accounted for nearly 60:40; this proportion decreased due to the shrinkage of e-mode outstanding debt.

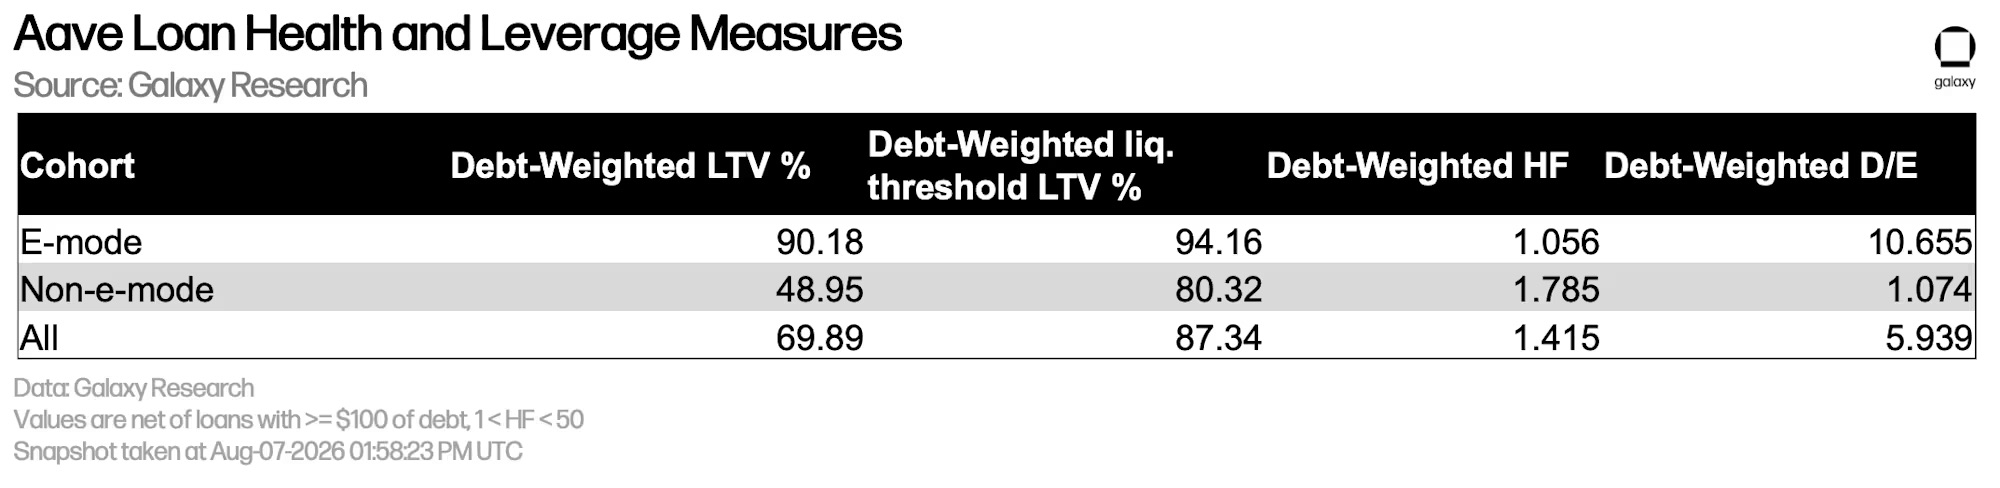
The following table displays the weighted risk indicators for the filtered book, categorized into three groups: all positions, e-mode, and normal mode. Borrowers in e-mode generally take on very high leverage: the weighted debt-to-value ratio (LTV) is about 90%, the weighted health factor is only 1.06, and the debt-to-equity ratio (D/E) is about 10.7; which means a slight shock to collateral prices will push many positions into pressure zones.
Regular mode loans have much thicker safety cushions: the debt-weighted LTV is about 49%, the health factor is 1.79, and the D/E is about 1.07; used to hedge risks unrelated to the collateral and borrowing asset prices, such as using cbBTC as collateral to borrow USDC.
The formula for calculating debt-weighted D/E (only for positions where Ci > Di, i.e., collateral > debt): D/E = Σi (Di × (Di ÷ (Ci − Di))) ÷ Σi Di, where Di represents the debt of a single position and Ci represents the value of collateral of a single position.
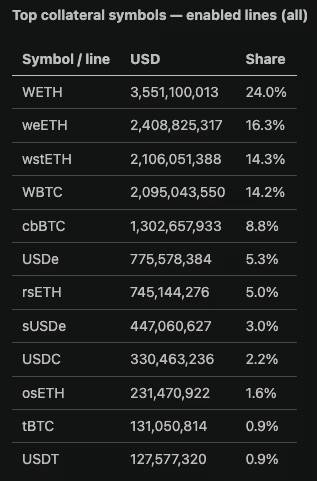
Next, we will collect the dollar value proportions of various collateral assets in the Aave V3 core market. ETH-based collateral dominates: WETH accounts for about 24%, weETH (Etherfi re-staked ETH wrapping certificate) accounts for 16%, and wstETH (Lido stETH wrapping certificate) accounts for 14%, totaling 54.6% of all available collateral; WBTC accounts for approximately 14%. A few assets bear the majority of collateral value in the book, while the rest are stablecoins and other income-generating tokens.
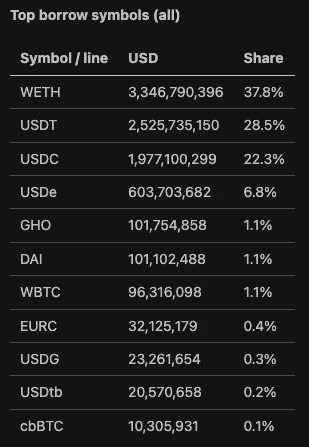
Looking at the asset composition on the borrowing side: WETH comprises slightly over 37% of the total liabilities, which is a typical result of the prevalence of ETH-based collateralized loop leverage strategies. Stablecoin borrowing is also substantial: USDT approximately 28%, USDC around 22%, together accounting for half of the total borrowing scale, while other currencies represent smaller proportions.
Compared to the previous statistics, WETH’s proportion in outstanding liabilities has significantly decreased from 51.1%, consistent with the previously mentioned contraction of e-mode debt.
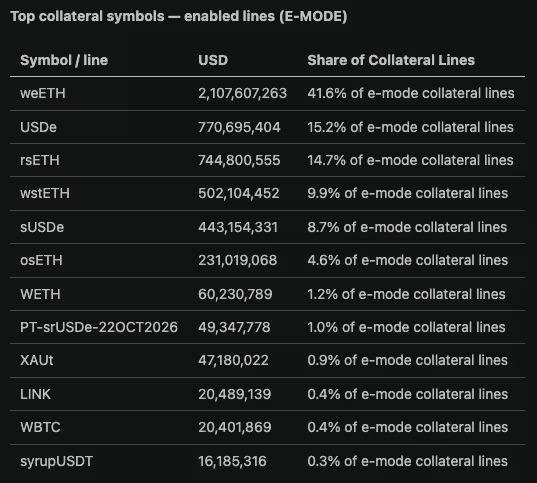
e-mode Sub-views
In e-mode, the collateral assets are highly concentrated in ETH staking/re-staking type wrapping certificates: weETH alone accounts for 42% of this category of collateral; when combined with rsETH and wstETH, these three assets collectively make up 66.2% of e-mode collateral size. This indicates that the risks in e-mode are not diversified collateralization, but essentially concentrated bets on the fundamentals of Ethereum staking.
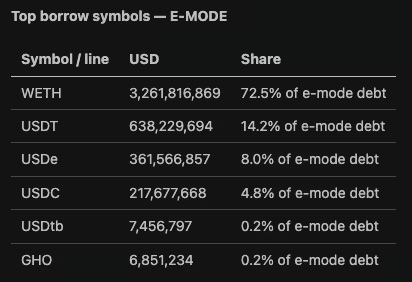
On the borrowing side, the vast majority of e-mode debt is priced in WETH, with WETH accounting for 73% of e-mode debt, perfectly aligning with user behavior of looping borrowed ETH collateralized by ETH. Stablecoins still hold a certain proportion, with USDT, USDe, and USDC collectively accounting for around ten percent of e-mode borrowing scale.
The table below statistically represents the e-mode positions corresponding to each collateral asset, including the debt-weighted risk indicators; it will also calculate the implied loop leverage ratios for sub-samples where the collateral is concentrated 99% on a single asset. This is analogous to a "ranking of which asset has been played the hardest through loop leverage," differing from an ordinary market capitalization sorting table. Liquid-staked and re-staked ETH certificates rank at the forefront, with high debt-weighted LTVs, D/E ratios commonly in the high single digits or teens, and health factors slightly above 1, corresponding to a large number of closely looped ETH leveraged positions.
The implied loop ratio for a single position formula: N_i = ln((1 − (D/E)_i(1 − Li)) / Li) / ln(Li), where Li is the LTV for the position; this is only used for sub-samples with single asset collateral ≥99%. The output result is the debt-weighted average Ni; excluding positions where L is not in (0,1), the logarithmic parameter is non-positive, or the result is a non-finite number. This computation is only output for liquid-staked ETH, liquid re-staked ETH, income-generating stablecoins, and Pendle PT certificates.

Corporate Debt Strategies
Galaxy Research Institute currently tracks $16.1 billion in outstanding debts, which are used by enterprises for directly purchasing or replenishing digital asset treasury strategies. Due to Bloomberg’s limitations in statistical capabilities regarding Strategy’s preferred stock, there are time discrepancies in the time series of increments in the company’s STRC circulating shares, but the total debt scale can accurately reflect actual liabilities.
Strategy completed a $1.5 billion debt repurchase in May, which reduced the outstanding debts of digital asset treasury enterprises (DAT) by $1.5 billion this quarter.
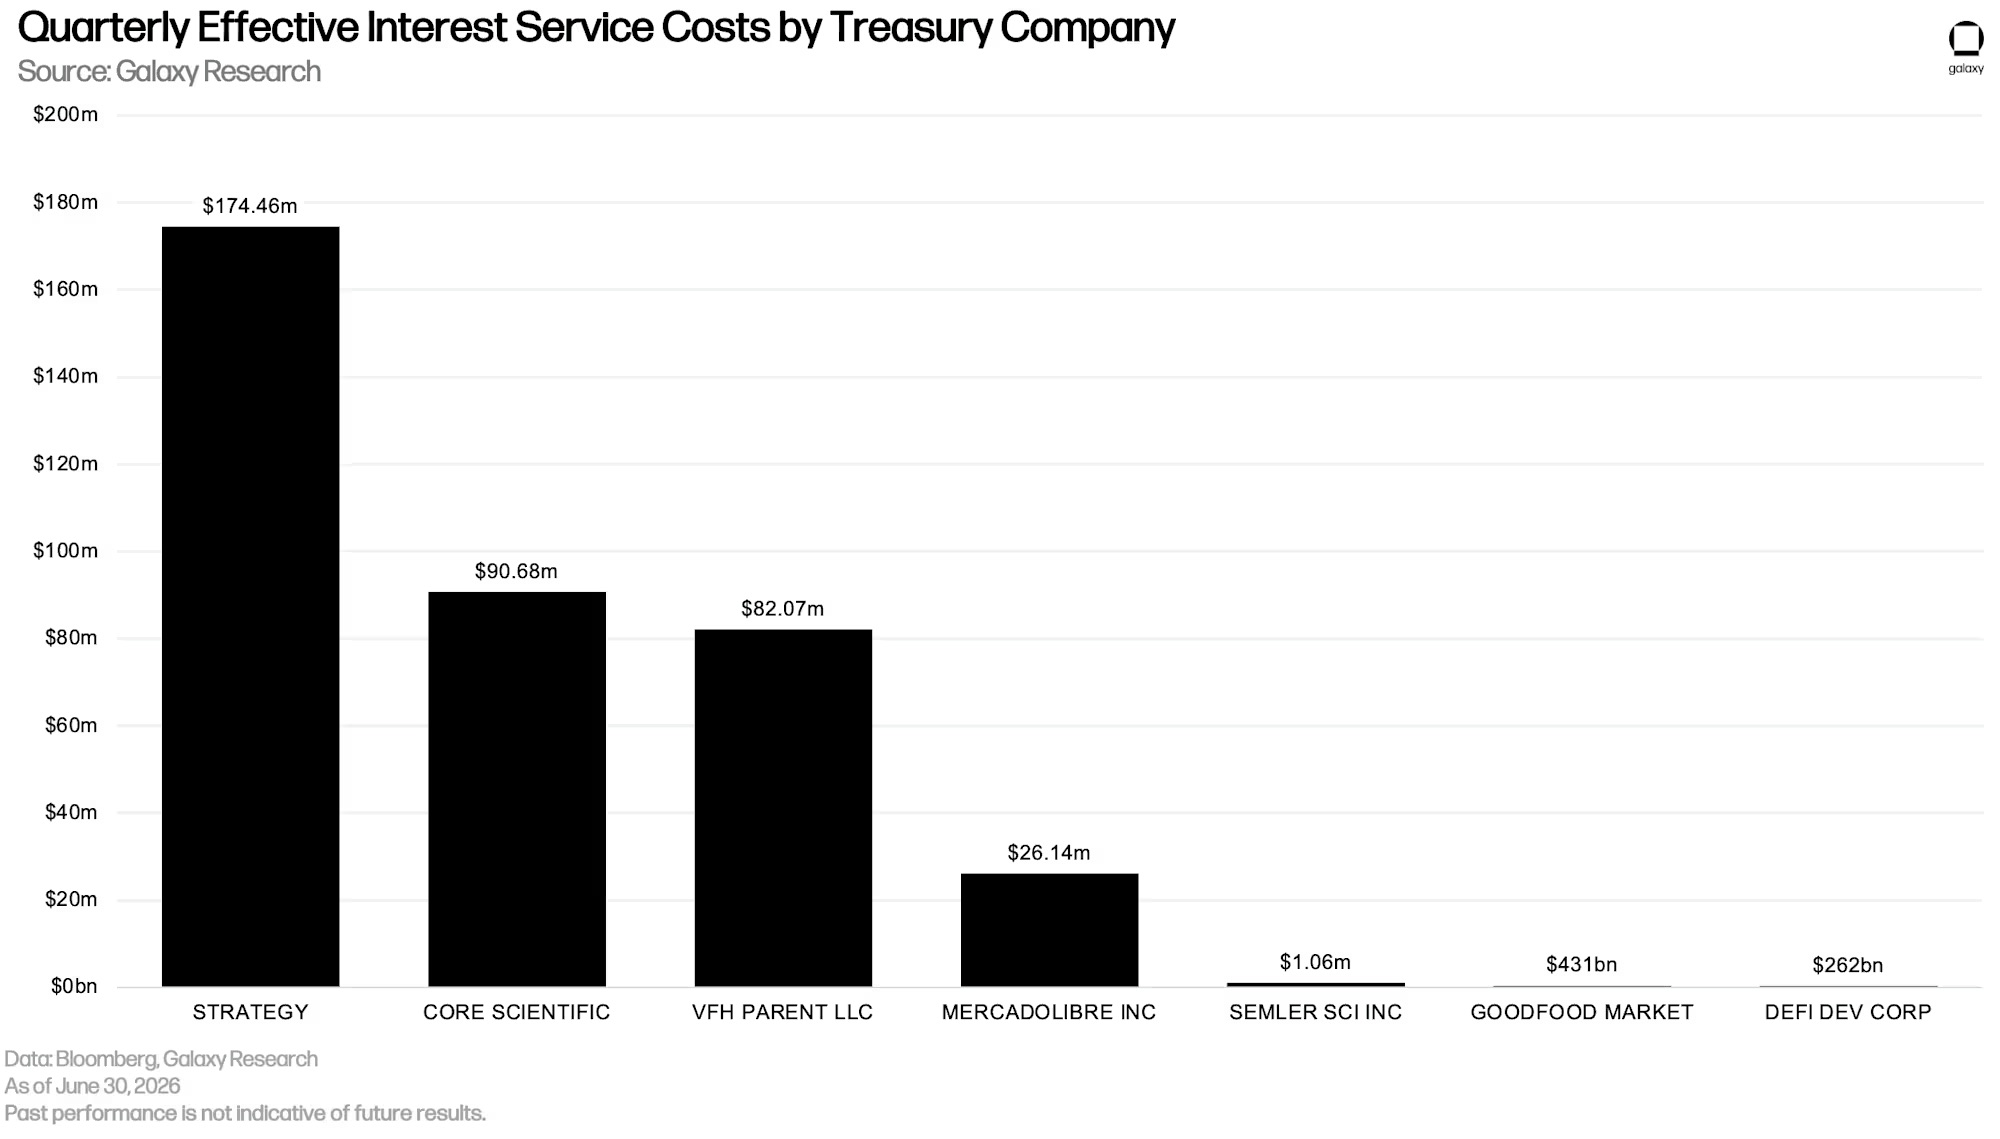
The table below shows the actual interest payments required per quarter for DAT issued debts. Note that dividends on STRC from Strategy must be resolved through board approval and distributed from legally available funds; unpaid dividends will continue to accumulate, and must be prioritized for payment before any returns to subordinate securities. Therefore, the timing of STRC dividends is not fixed, and the amounts are unevenly distributed.
Including DAT corporate debts, the total industry has seen a month-on-month decrease of 15.08% in crypto-related outstanding debts this quarter. Following a historical high in the third quarter of 2025, the total crypto-related debts across on-chain and off-chain channels fell back to $73.2 billion by the end of Q2, marking a decline across three consecutive quarters.
Futures Market
Including perpetual contracts, the open interest (OI) in futures decreased by 3.08% month-on-month, to $103.2 billion; in July, open interest experienced a resurgence, reaching around $114 billion by the end of the month.
Important note: The open interest scale does not equal the total amount of absolute leverage. Some open positions may be hedged by long spot positions, achieving delta-neutral exposures; thus, OI alone cannot directly reveal the overall leverage ratio of the market.
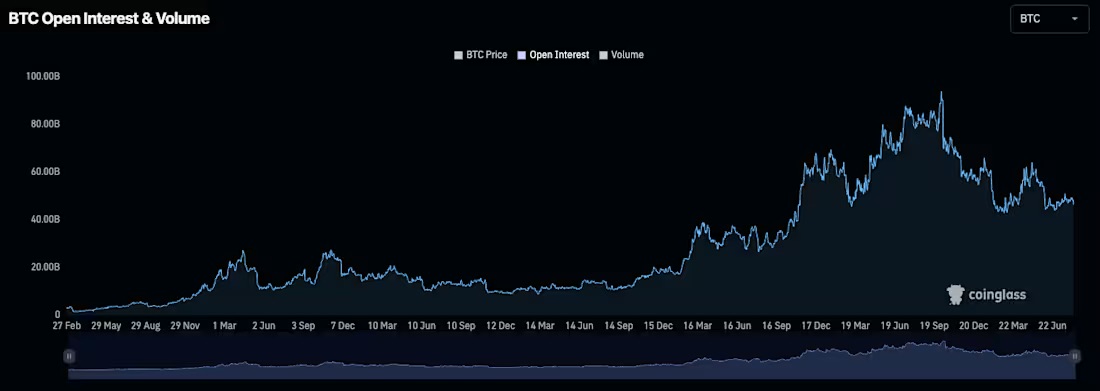
In Q2, BTC futures open interest fluctuated in the range of $44 billion to $62 billion; at the beginning of the quarter it was $48.04 billion, dropping to $45.04 billion by June 30 (‑6.24%). After the end of Q2, it rebounded to approximately $48 billion in early August.
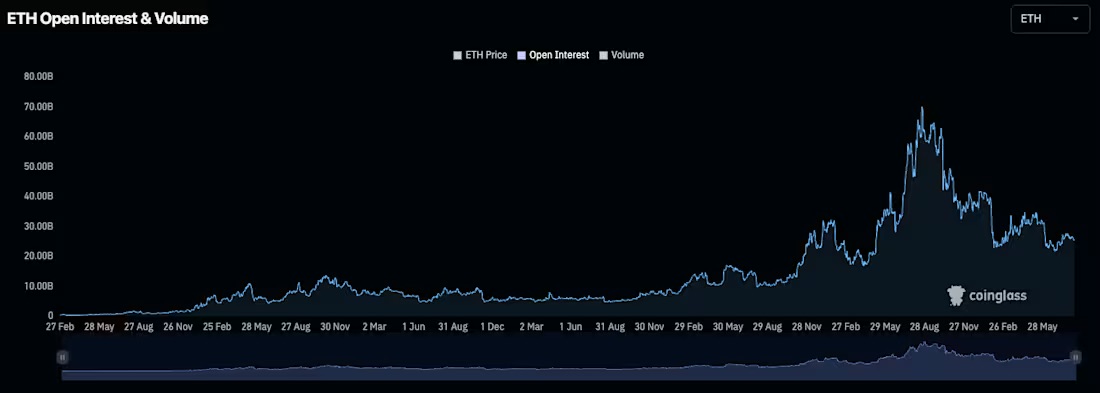
ETH's futures open interest saw a greater decline than BTC: starting at $29.84 billion and ending at $21.99 billion, a drop of 26.31%; after the end of the quarter, it rebounded to $25.74 billion.
At the end of Q2, the combined open interest for BTC and ETH totaled $67.07 billion, accounting for 65% of the entire futures market.
Conclusion
We believe that following the significant decline in the futures market on October 10, 2025, the second quarter of 2026 further confirms that leverage in the crypto market is gradually being digested. The lending market is experiencing a stepwise decline rather than an elevator-like crash, with gentle contractions over three consecutive quarters, rather than the cliff-like declines witnessed in a single quarter of the 2022 bear market.
The corporate treasury debts and futures open interest also reflect controlled retraction, rather than passive forced deleveraging. Data from early July has already shown that futures open interest and DeFi borrowing scales may have approached bottom ranges.
If this trend continues, the market has a stronger capacity to withstand further contractions, likely avoiding the chain liquidations and counterparty cascading failures seen in the previous cycle. As of now, deleveraging is still continuously advancing step by step.
免责声明:本文章仅代表作者个人观点,不代表本平台的立场和观点。本文章仅供信息分享,不构成对任何人的任何投资建议。用户与作者之间的任何争议,与本平台无关。如网页中刊载的文章或图片涉及侵权,请提供相关的权利证明和身份证明发送邮件到support@aicoin.com,本平台相关工作人员将会进行核查。


