As Bitcoin seeks to stabilize above $60,000, its on-chain activity has returned to levels last observed during the 2018–2019 bear market transition, drawing a significant historical parallel. Bitcoin active addresses are the source of the crucial signal. The 30-day EMA of active addresses recently hit a low of about 609,700, while the 100-day EMA reached about 622,000, according to the data provided.
Bitcoin breaking the key barrier
At this point, both averages began to rise. This puts network activity in the vicinity of the 600,000-address range, which signaled a significant change during the 2018–2019 cycle. At that time, the 100-day EMA bottomed at about 605,400 active addresses, while the 30-day EMA dropped to about 570,700. Before finally going into a recovery phase, Bitcoin itself reached about $3,200.
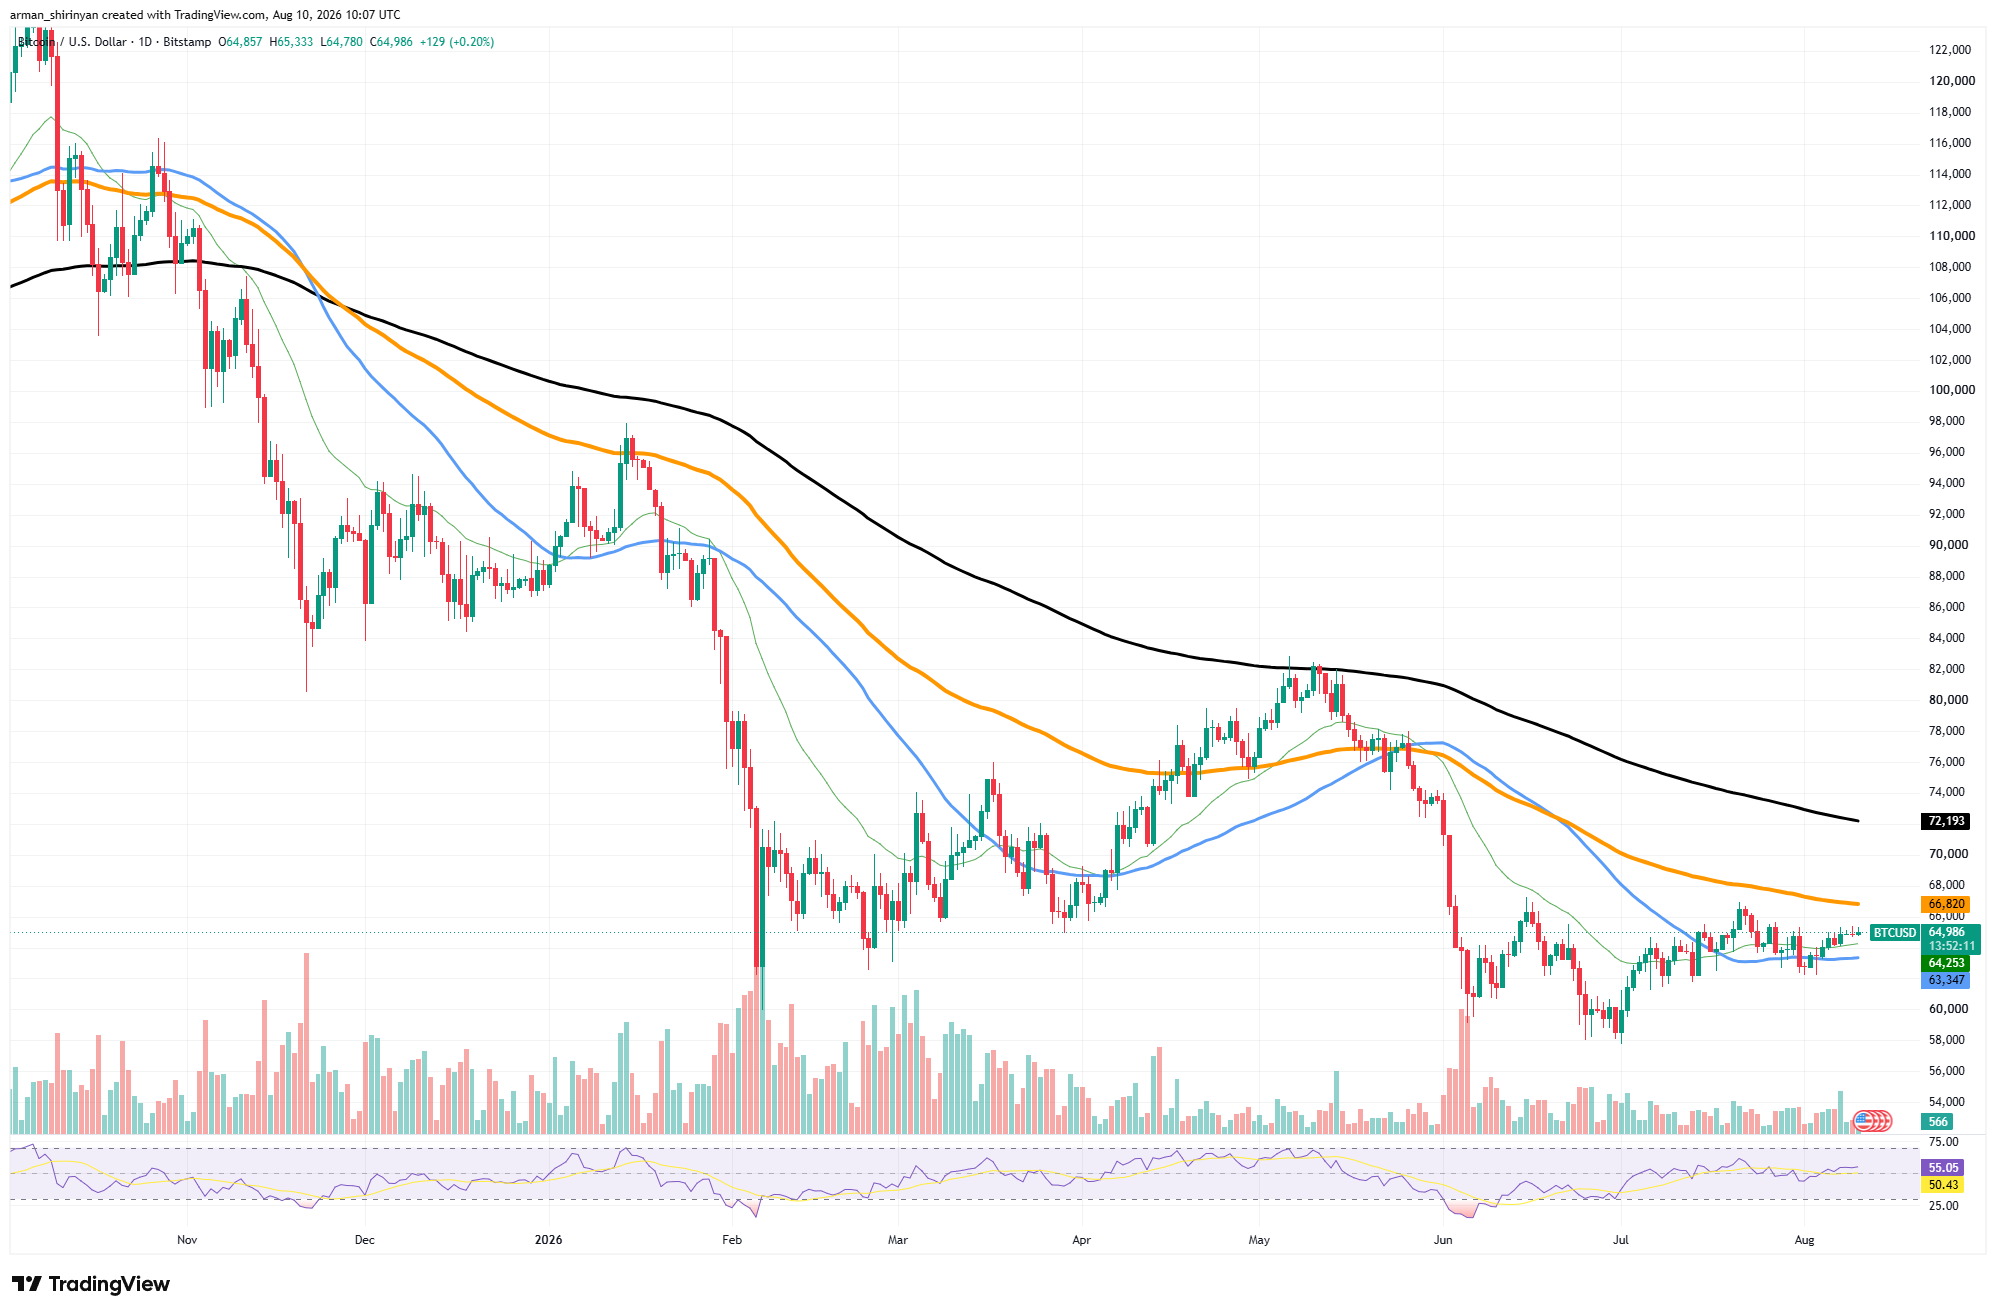
BTC/USDT Chart by TradingView
As a result, even though the price and general market structure of Bitcoin are entirely different, the current numbers are remarkably close in terms of network participation. The bottoming argument receives additional support from the price chart. After rising from a recent low of about $58,500, Bitcoin is currently trading around $64,900.
HOT Stories Veteran Trader Brandt Leans Bearish on Bitcoin's Next Move Shiba Inu (SHIB), Solana (SOL), Hyperliquid (HYPE) and Binance Coin (BNB) Price Analysis for August 10: Can Bulls Establish Control?
Additionally, the asset has recovered its shorter moving averages; the chart indicates support at $64,247 and $63,346. The momentum is now marginally on the bullish side of neutral, as the RSI has recovered to roughly 54.6. The general trend has not yet changed, though.
Bearish tendencies on the market
The larger moving averages of $66,819 and $72,193 are still above Bitcoin. The latter is still falling, indicating that there is still significant overhead resistance for BTC. The short-term structure would be strengthened by a move through $66,800, and a break above $72,000 would offer far more convincing proof that the larger downtrend is losing its grip. Additionally, care should be taken when comparing active addresses.
Similar network activity does not imply that Bitcoin will rebound as it did in 2019. Transaction behavior, exchange activity, batching, and more general changes in the way the Bitcoin network is used can all affect active addresses. The indicator's direction is what counts. The fact that both active-address EMAs are rising after entering historically low territory may indicate that the decline in network participation has stopped.
As of right now, the data suggests a potential bottoming structure rather than a standalone buy signal. Although activity is increasing, momentum has improved, and Bitcoin has stabilized, the price still needs to break through the $66,800–$72,200 resistance range before the technical picture gets significantly stronger.
免责声明:本文章仅代表作者个人观点,不代表本平台的立场和观点。本文章仅供信息分享,不构成对任何人的任何投资建议。用户与作者之间的任何争议,与本平台无关。如网页中刊载的文章或图片涉及侵权,请提供相关的权利证明和身份证明发送邮件到support@aicoin.com,本平台相关工作人员将会进行核查。


