Author: Glassnode
Translated by: AididiaoJP, Foresight News
The global market continues to set new highs, yet Bitcoin remains completely still. This report focuses on this "stillness": a theft occurring while the market is nearly asleep, accumulated bottom signals born from boredom rather than panic, and an options market priced as "inactive," yet emotionally sensitive to any slight movement.
Summary
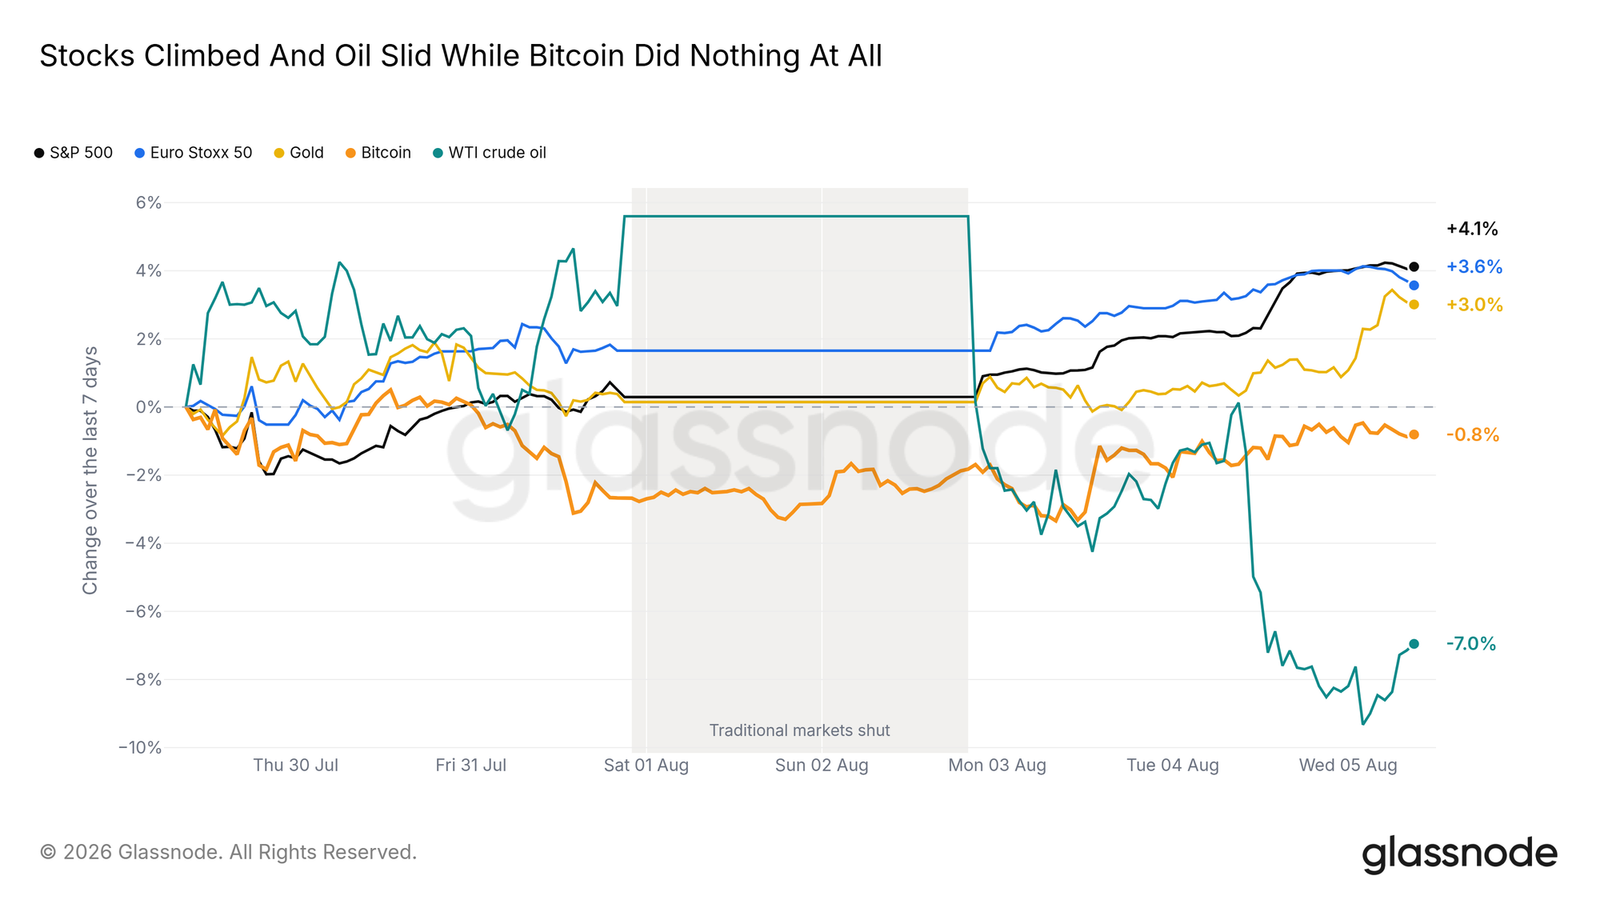
- Stocks and gold exploded, oil was significantly repriced downward, while Bitcoin hardly budged.
- 594 BTC were stolen, with dormant coins flowing at 200 times the amount stolen; prices are indifferent to both.
- Bottom signals are forming through boredom rather than capitulation, but have not yet reached the true bottom of previous bear markets.
- Institutional buying over the past two years is still reversing.
- Options are priced for minimal movement in either direction, while sentiment flips with every slight market fluctuation.
- This deep compression has historically almost always broken upward; however, the demand engine hasn't yet started.
A Week with Bitcoin Absent
Aligning major markets on the same coordinate axis, with zero as a baseline, the week is strikingly clear. Both major stock indices set record highs, gold rose simultaneously, while oil erased its supply risk premium with news of downgrades at the Sunday open, plummeting significantly. Bitcoin is the only asset trading over the weekend but ended slightly lower than last week's report position, lagging the S&P 500 by over four percentage points. Everyone but the protagonist of this report moved. The following content attempts to explain this.
Federal Reserve Holds Steady, Fear Quickly Eases
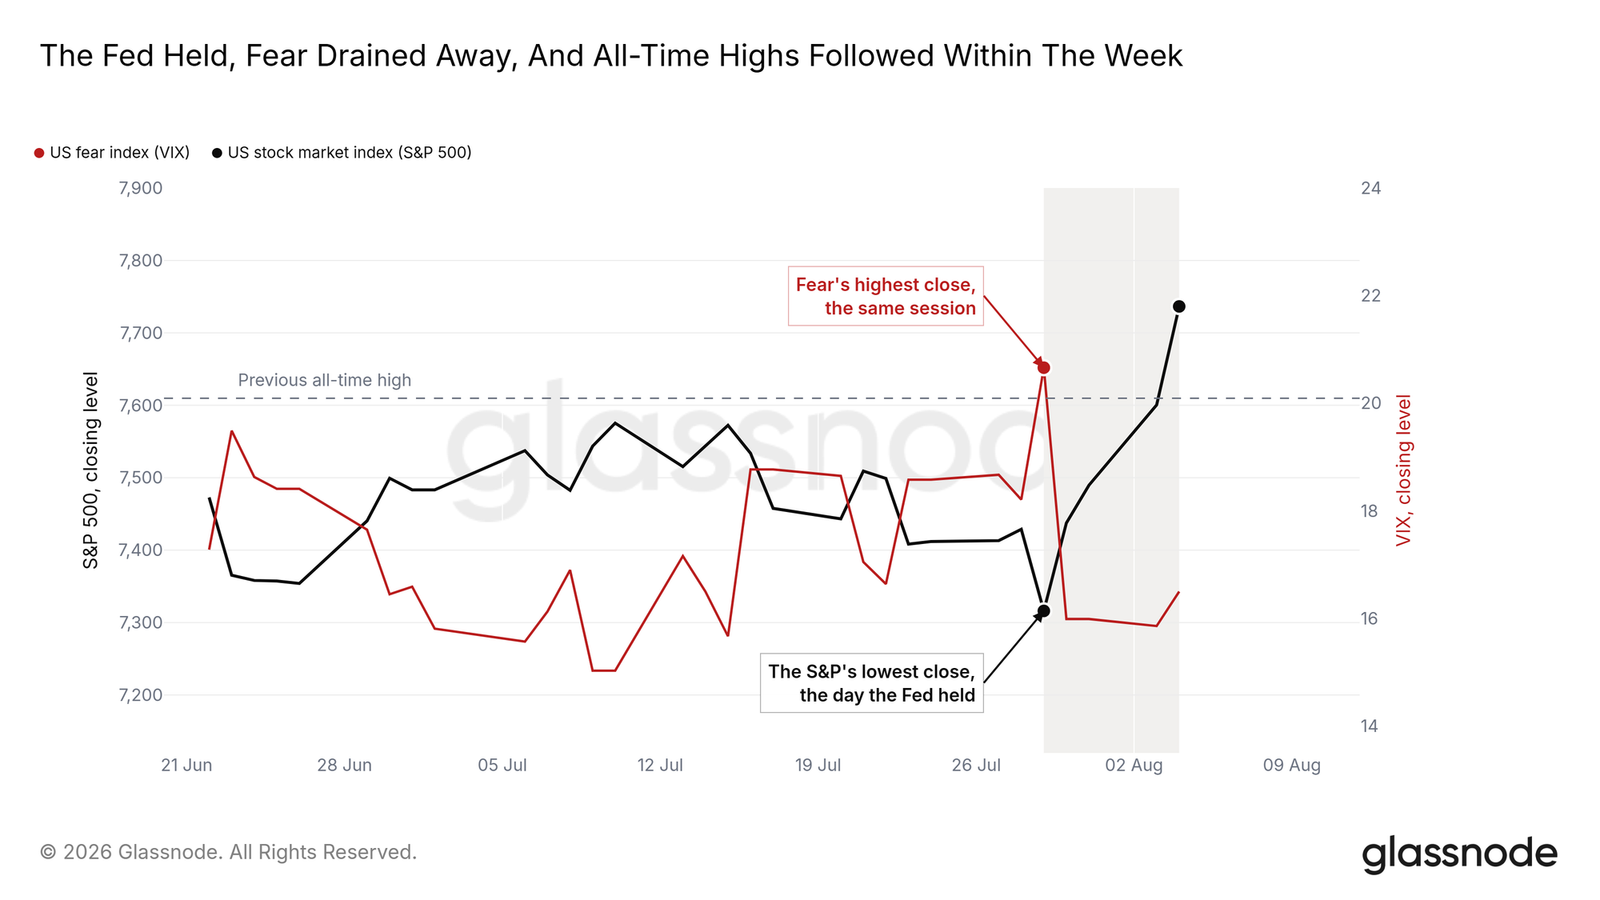
The stock market's action hinged on the FOMC. On July 29, the Federal Reserve kept interest rates unchanged, and the market's first response was to sell: the S&P closed at its lowest point this summer, and fear in the stock market peaked. The reassessment took just one trading day. The speed at which fear receded is at a level seen only ten times since 2009. Four days after the decision, the index closed at 7737, surpassing the record high since June, with the same day seeing the Euro Stoxx 50 also setting its record. The key here is the sequence: the market first sold "patience," took a nap, and then took four days to determine that "patience" was actually good news.
Leading Data Strengthens
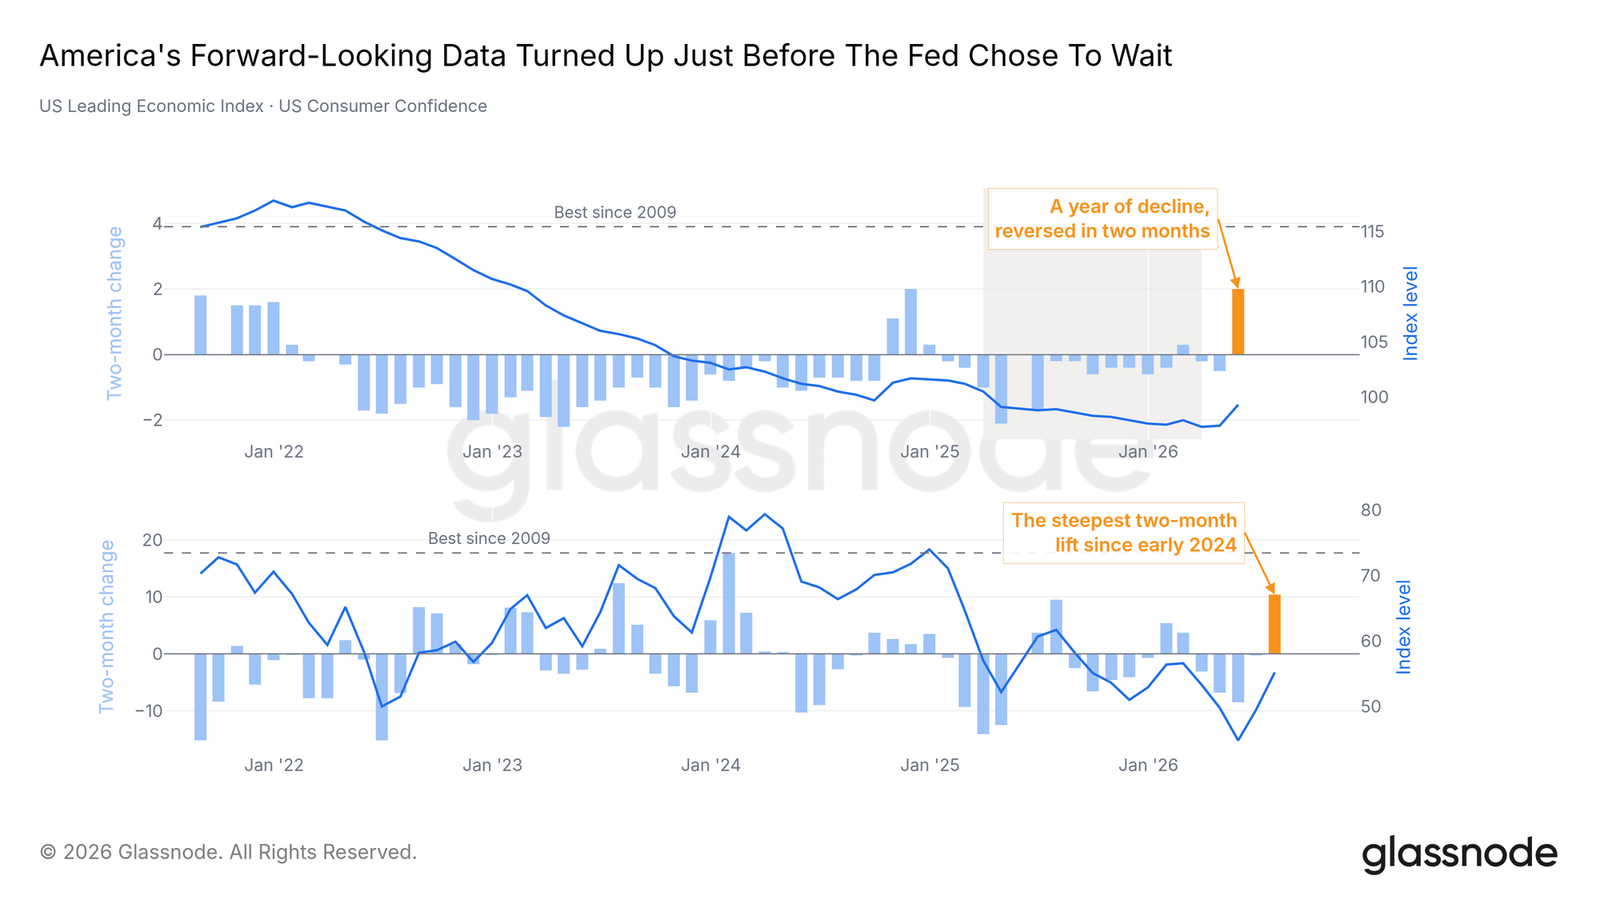
The inaction is read as good news because the underlying data has turned. The leading economic index reversed a year-long decline within two months, and consumer confidence recorded its steepest two-month rise since early 2024. With the central bank standing still and forward-looking data improving, this removes the risk of further tightening, allowing growth to work on its own; the stock market precisely priced this in. Bitcoin has completely disregarded this. Its stillness raises the question of whether it is a sign of weakness or sedation, which future data will clarify.
A 25-Minute Stress Test
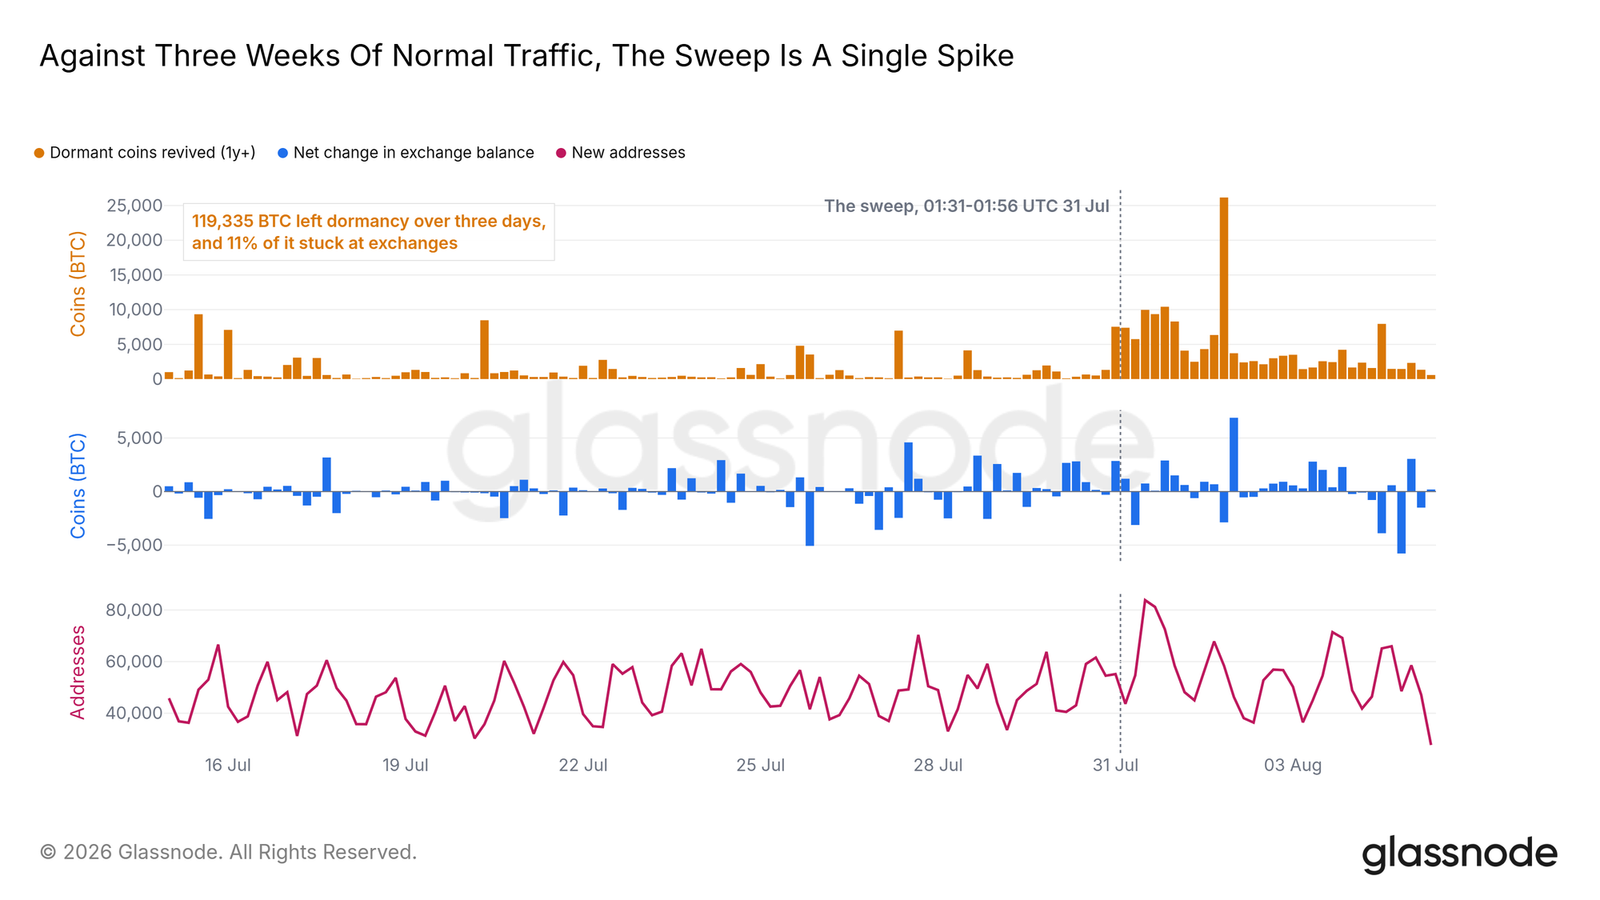
In the early hours of July 31st, the market faced a stress test that no one specifically named. Within 25 minutes, attackers exploited a key generation vulnerability from five years ago in the Coldcard hardware wallet, stealing approximately 594 BTC from about 500 self-custodied wallets, worth around $38 million. The theft was nearly over before it began. However, the reactions it triggered on-chain lasted for days, serving as the clearest natural experiment of holder behavior in this cycle.
The "supply over one year revived" (the amount of coins that have moved after at least a year) surged to about 119,000 BTC over the following three days, 200 times the stolen amount. All holders in the ecosystem moved coins out of seed wallets that could be compromised. Compared to three weeks of normal flows, this event is an isolated spike. Of this, only about one-tenth ended up on exchanges, new address creation returned to baseline within three days, and the supply of wallets holding for less than a month increased by 40% since then and continues to rise. This is a migration to new cold wallets, not a liquidation sale.
In the spot market, this event was hardly registered. The largest scale of old coins in this cycle was forced to move without causing measurable selling pressure or triggering noticeable price reactions. A market that shows indifference to a core self-custody group being robbed has neither active buying nor selling—this reflects the state described by subsequent cycle indicators.
Bottom Area, but No Liquidation Washout
Bottom Signals from Boredom
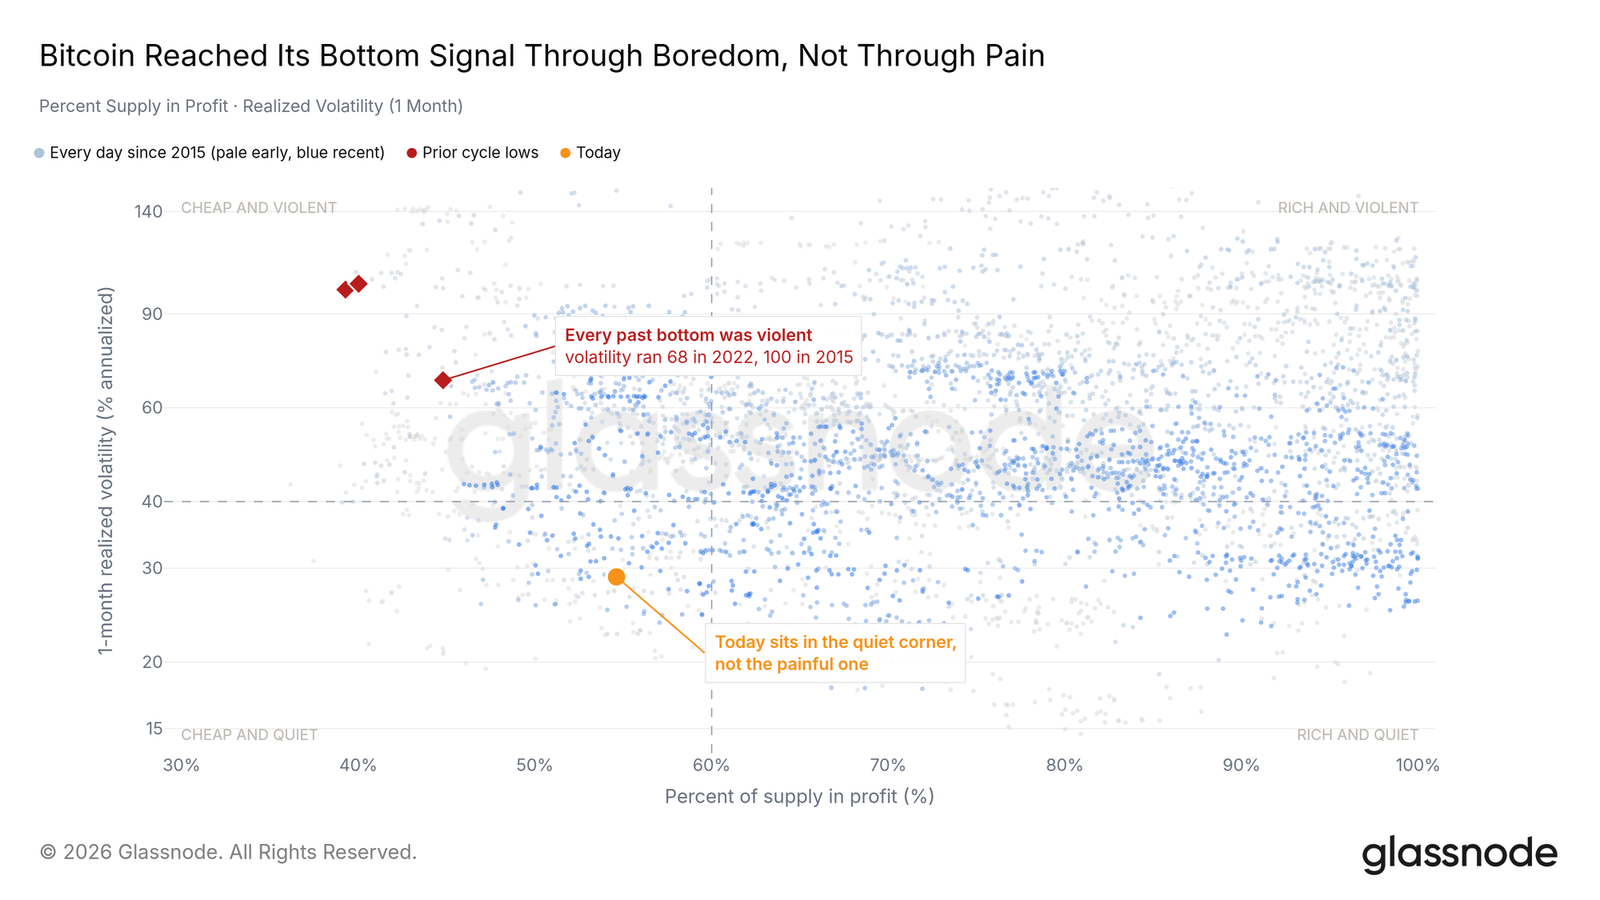
Bottom signals for Bitcoin typically arise from pain: a capitulative sell-off compresses the proportion of profitable supply to extremes, coupled with soaring volatility. This cycle, however, ventured into the same area through boredom. Profit compression is in place, but it has been forged through months of downward drift, arriving when volatility is at the floor rather than the ceiling. The destination is familiar, but the pathway has no precedent in previous bottoms.
Standing at the Door, Not Yet Entering the Room
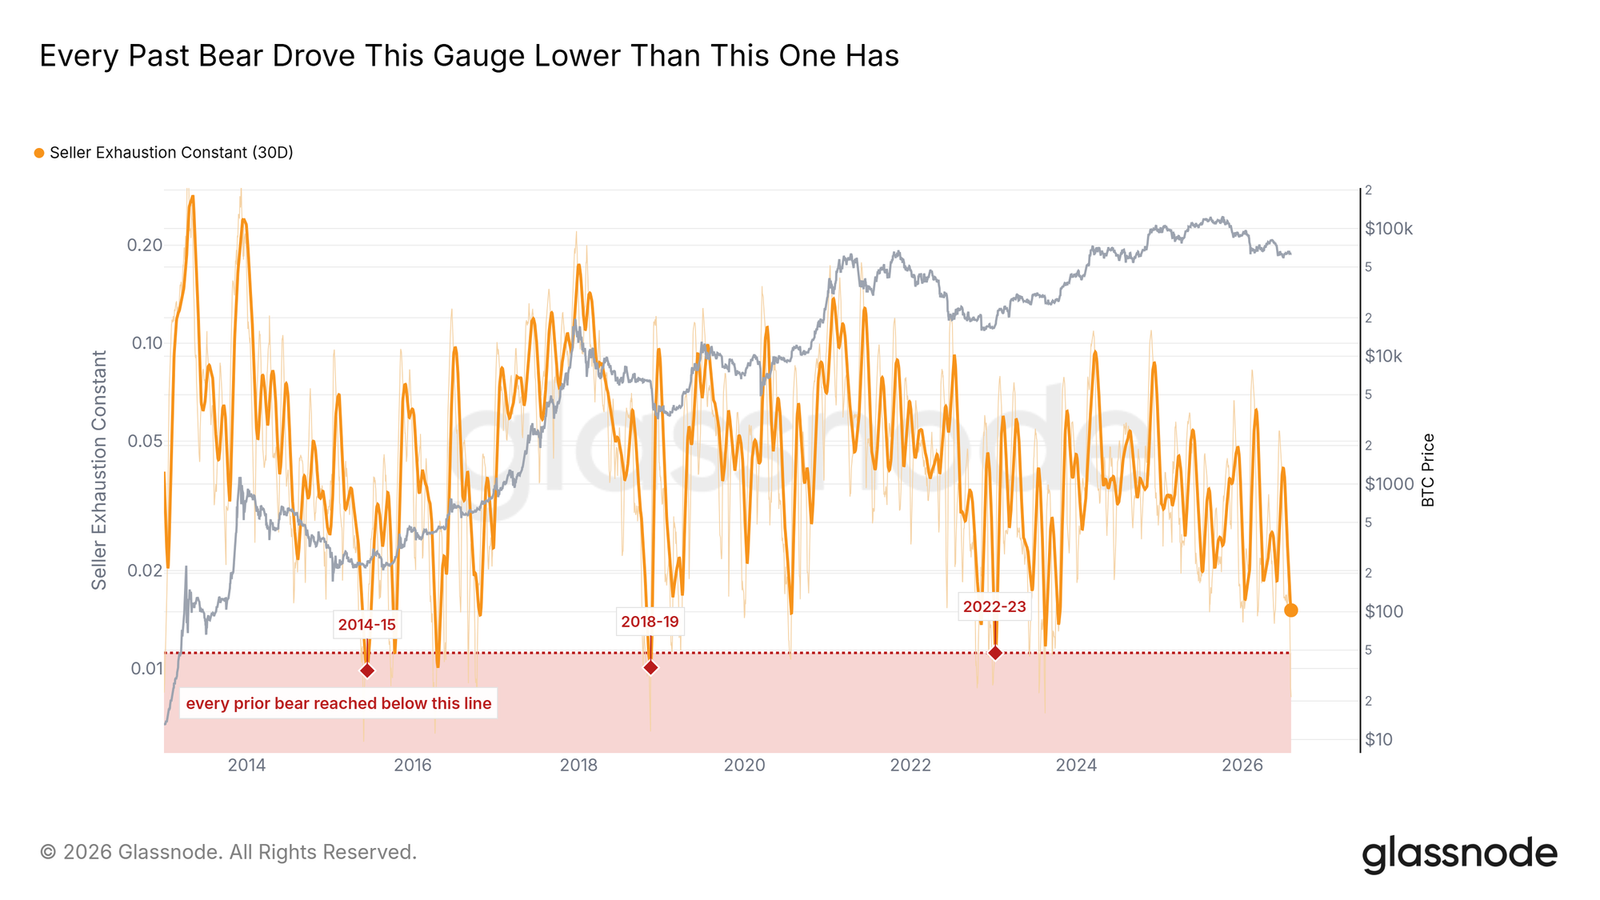
The "seller exhaustion constant" (the proportion of profitable supply multiplied by realized volatility) clarifies this point. Its 30-day average resides at this cycle's low point, having entered the area of every past bottom formation, but still stands about a third higher than the floors ultimately reached in previous bear markets. The indicator stands at the door, not yet in the room: if past cycles are a template, the final drop is not out yet.
Tracks in Reverse Operation
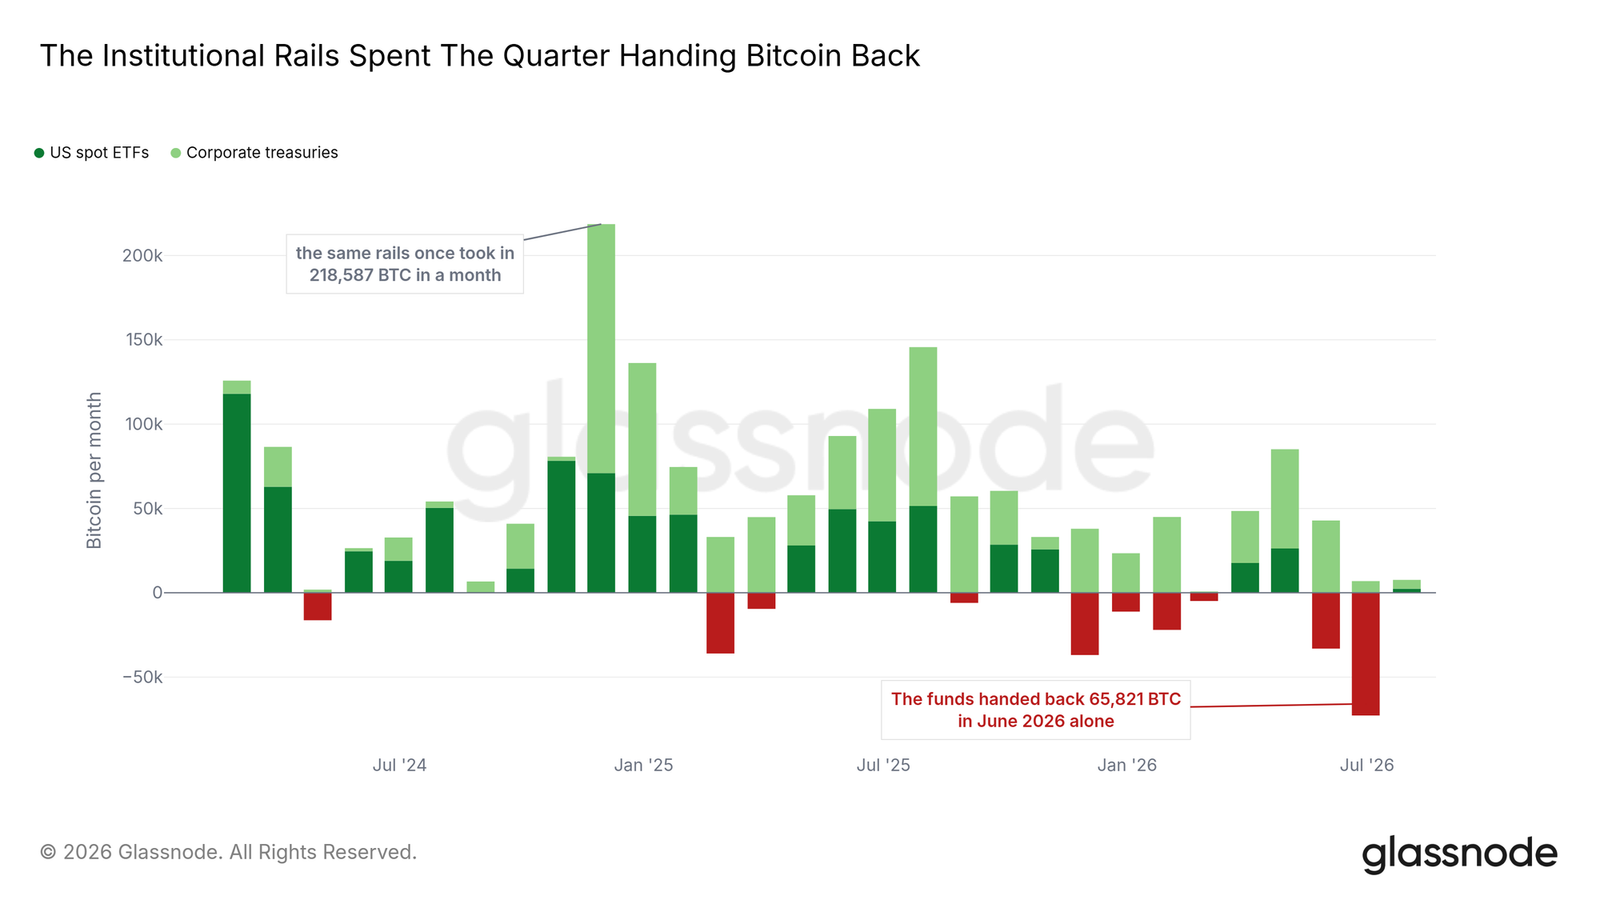
The demand side tells a matching story. The institutional track from the last bull market - U.S. spot ETFs along with corporate treasuries - has been returning coins for the past quarter: only in June did funds see a net outflow of about 65,800 BTC, the worst single month on record, while the best single month net absorption in late 2024 exceeded 218,000 BTC. Corporate treasury purchases continue, but their scale is far from enough to offset fund outflows. Regardless of how the bottom forms, it must occur in the absence of the structural buying that has defined the market for the past two years, until that buying returns.
From Risk Aversion to Defense
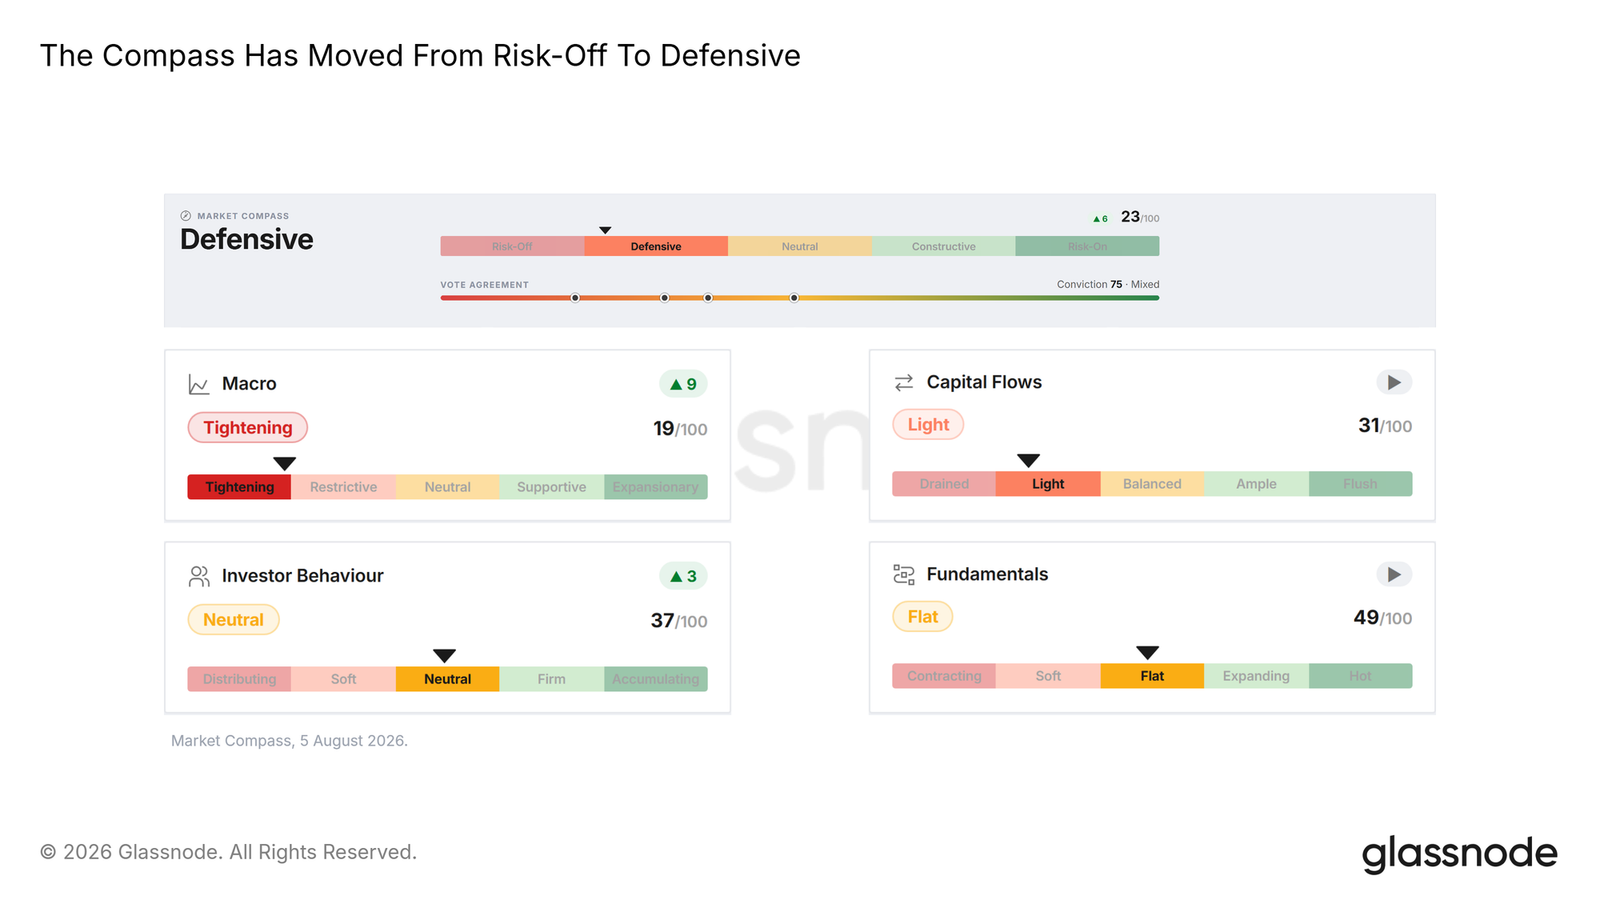
Our market compass summarizes the current state: after being pinned in the risk-averse zone for nearly three weeks, the composite indicator crawled into the defensive zone, with all input items generally consistent. Defense means the market has stopped deteriorating but lacks momentum. Half of the bottom checklist has been ticked, and the unticked half awaits the same missing element: a forced event.
No One Paying for Direction
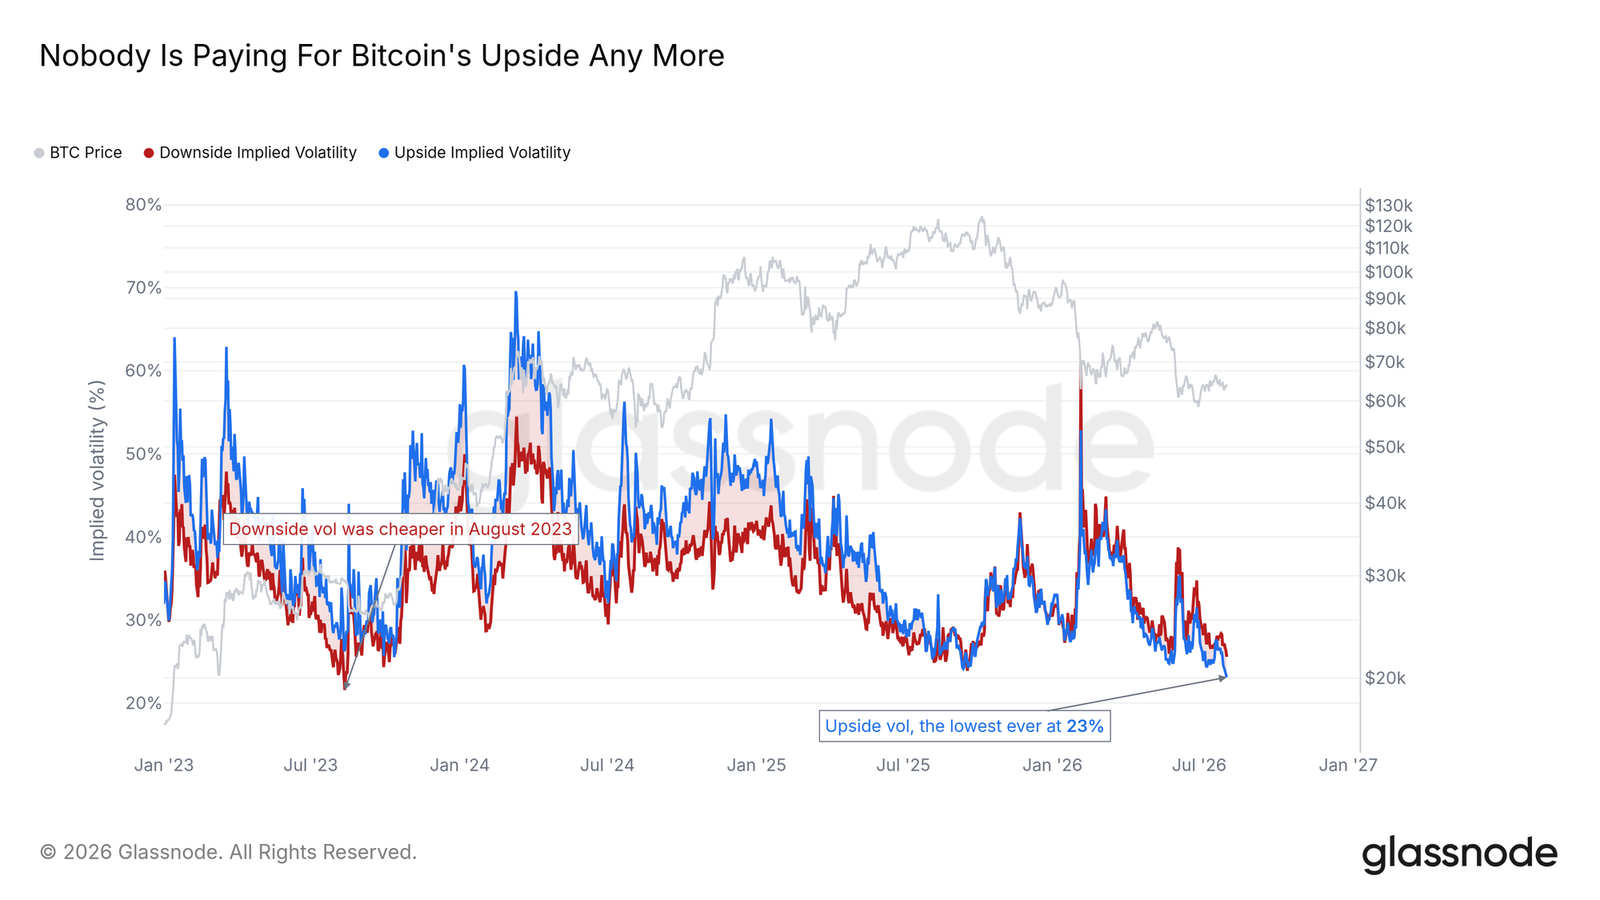
Breaking down the options surface into two wings, the much-discussed "fear premium" in Bitcoin options is indeed more curious. The implied volatility for upside is at the lowest historical levels of this metric, nearing 23%; the downside implied volatility is quite ordinary—the last time it was cheaper was in August 2023. This asymmetry is not about the bidding of put options but the disappearance of buying for call options. No one is paying for upside, nor is anyone paying much for downside.
Sentiment Cannot Stay Still
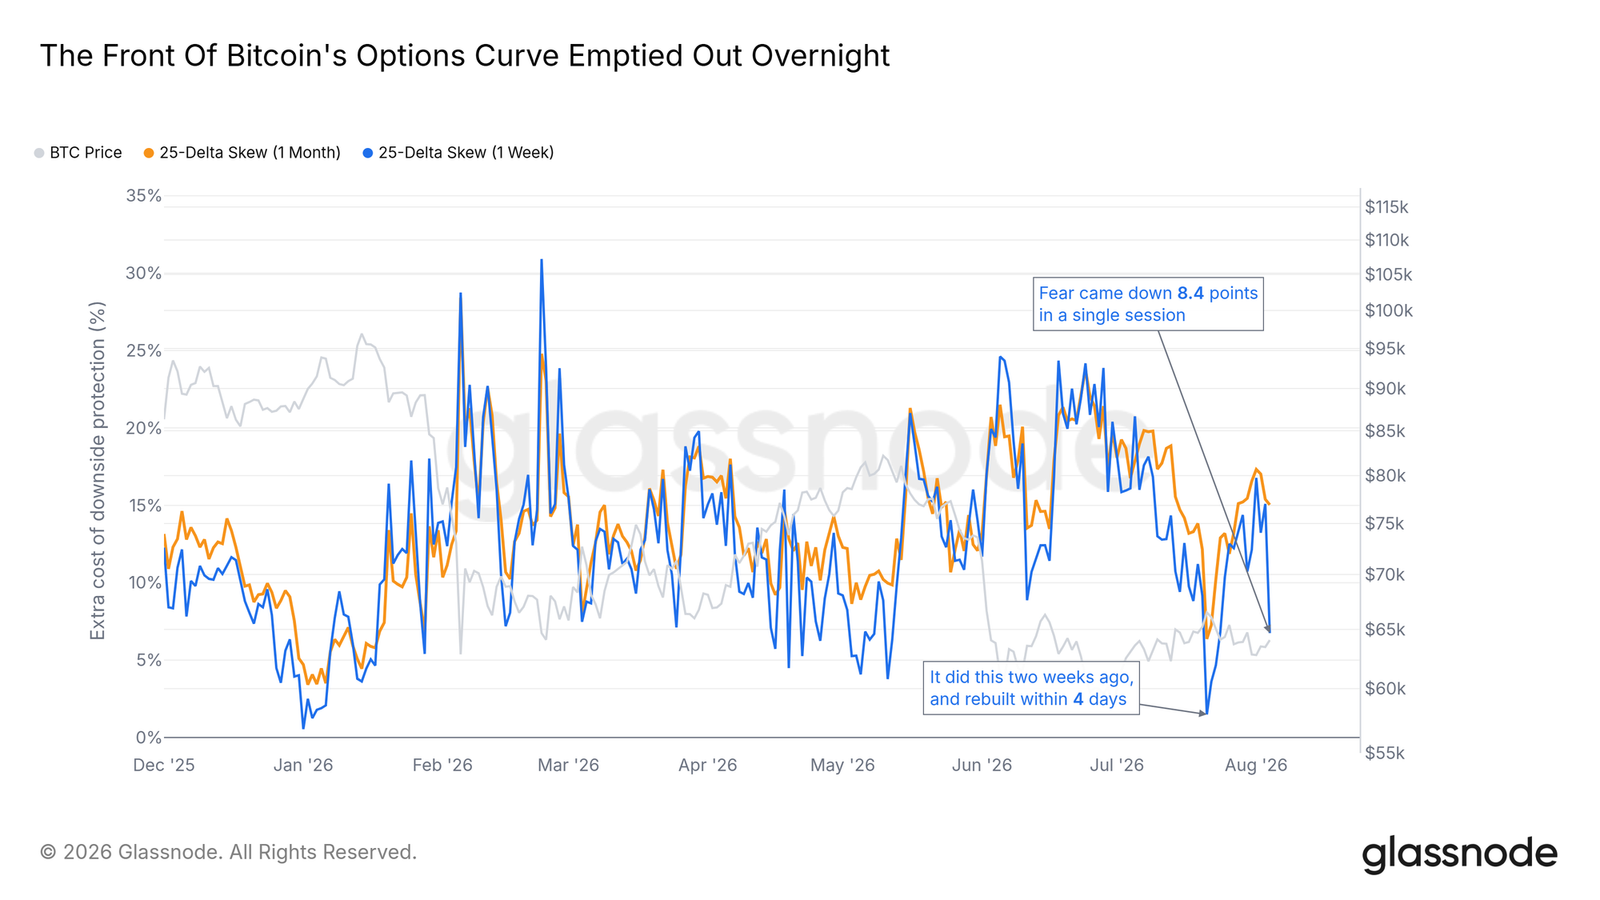
Meanwhile, sentiment cannot stay still. Our fastest position indicator—the 1-week 25 Delta skew—crashed more than eight points on a day when spot was almost unchanged; two weeks ago at the July peak, the same vacuum opened and filled again within four days. Short-term fear pricing flips over just a few percentage points of volatility, while the priced volatility level remains on the floor. This whipping occurs almost entirely within options: perpetual funding rates are pinned to long-term normals so leverage isn't amplifying, sentiment is. The market has bought a week of calm but continues to pay a premium for half a year's risk.
History Has Its Views
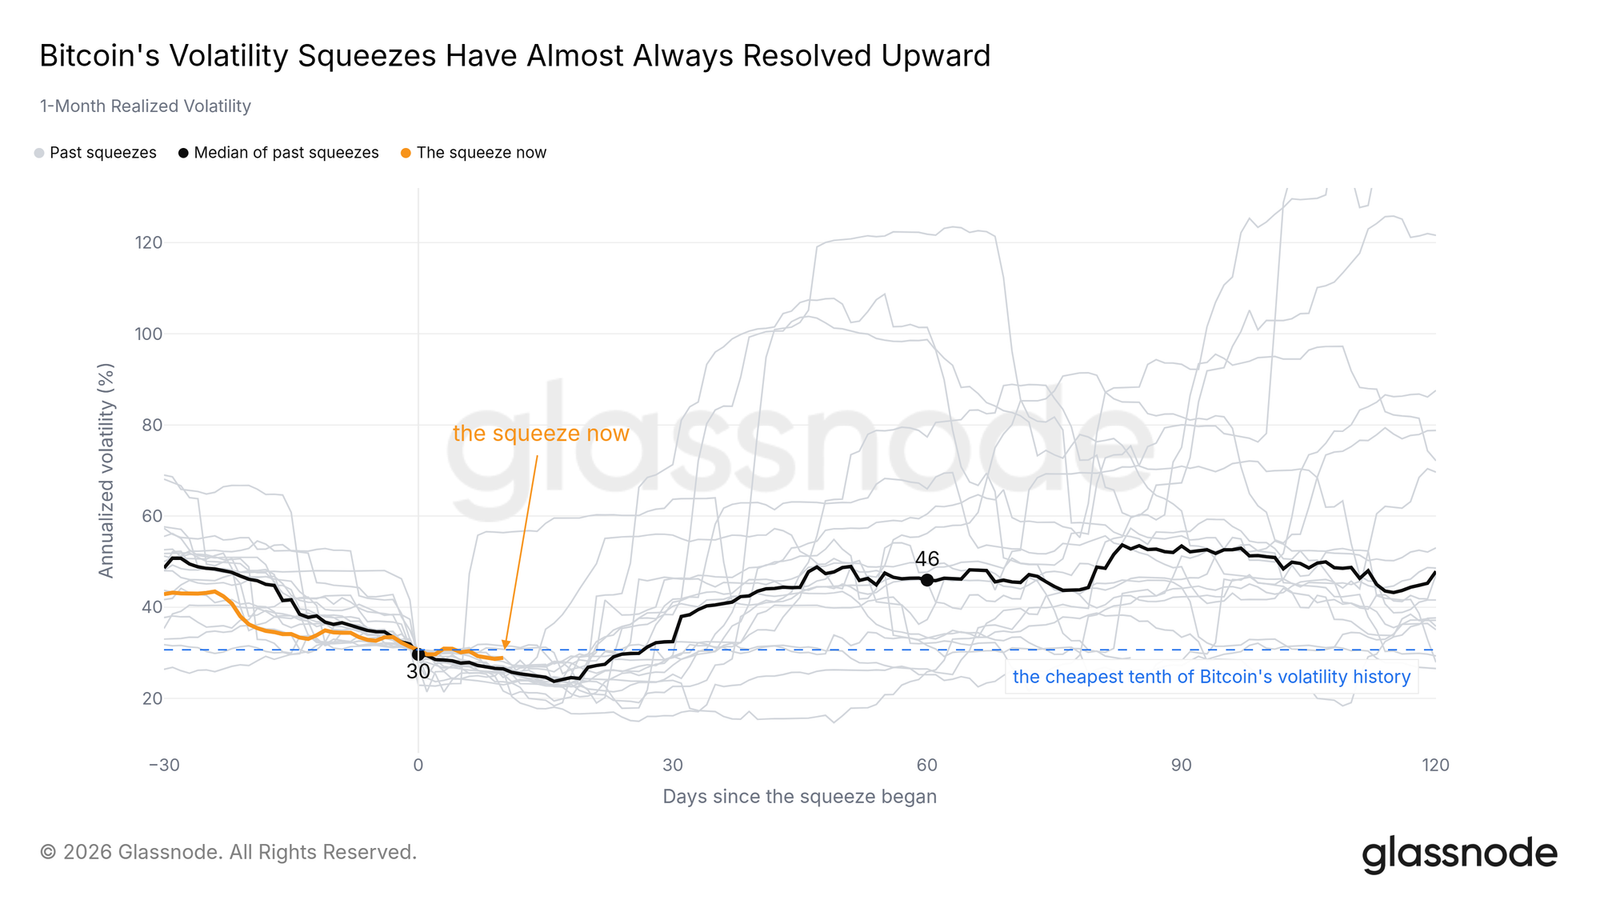
History has its views on this compression. When the 1-month realized volatility is compressed to similar depths, releases almost always resolve upward; this baseline rate is the most constructive data point of this period. But there is a premise: past compressions mostly resolved while the demand engine was idling in the background, while this time, the tracks are in reverse, and the final drop is yet to complete.
Conclusion
To summarize the current system in one sentence: a market that is compressed, under-positioned, and left behind by global risk appetite, with bottom conditions assembling but not yet complete. The compression guarantees that the eventual movements will appear significant relative to any position, while the imminent touch at the front end of the options curve ensures the crowd will chase late. The return of net inflows to the ETF track, or volatility expanding upward from compression, will confirm improvement. The seller constant pushed to the area previously reached in every bear market marks the completion of a classic bottom template. "Priced at zero, overreacting" is not a stable state.
免责声明:本文章仅代表作者个人观点,不代表本平台的立场和观点。本文章仅供信息分享,不构成对任何人的任何投资建议。用户与作者之间的任何争议,与本平台无关。如网页中刊载的文章或图片涉及侵权,请提供相关的权利证明和身份证明发送邮件到support@aicoin.com,本平台相关工作人员将会进行核查。


