
How far has this round of the crypto bear market progressed? Fidelity's Q3 signal report provides a set of coordinates: the weighted NUPL has dropped to -0.01, BTC's dominance rate has risen to 68%, and several indicators are near the historical capitulation range. Referring to the approximately 300-day bottom cycles of 2018 and 2022, the current 203 days of adjustment may have completed two-thirds. The report suggests that October 2026 is a noteworthy window of time, but it does not constitute a bottom prediction.
Author: Fidelity Digital Assets Research Team
Compiler: Jiahua, ChainCatcher
1. Market Overview
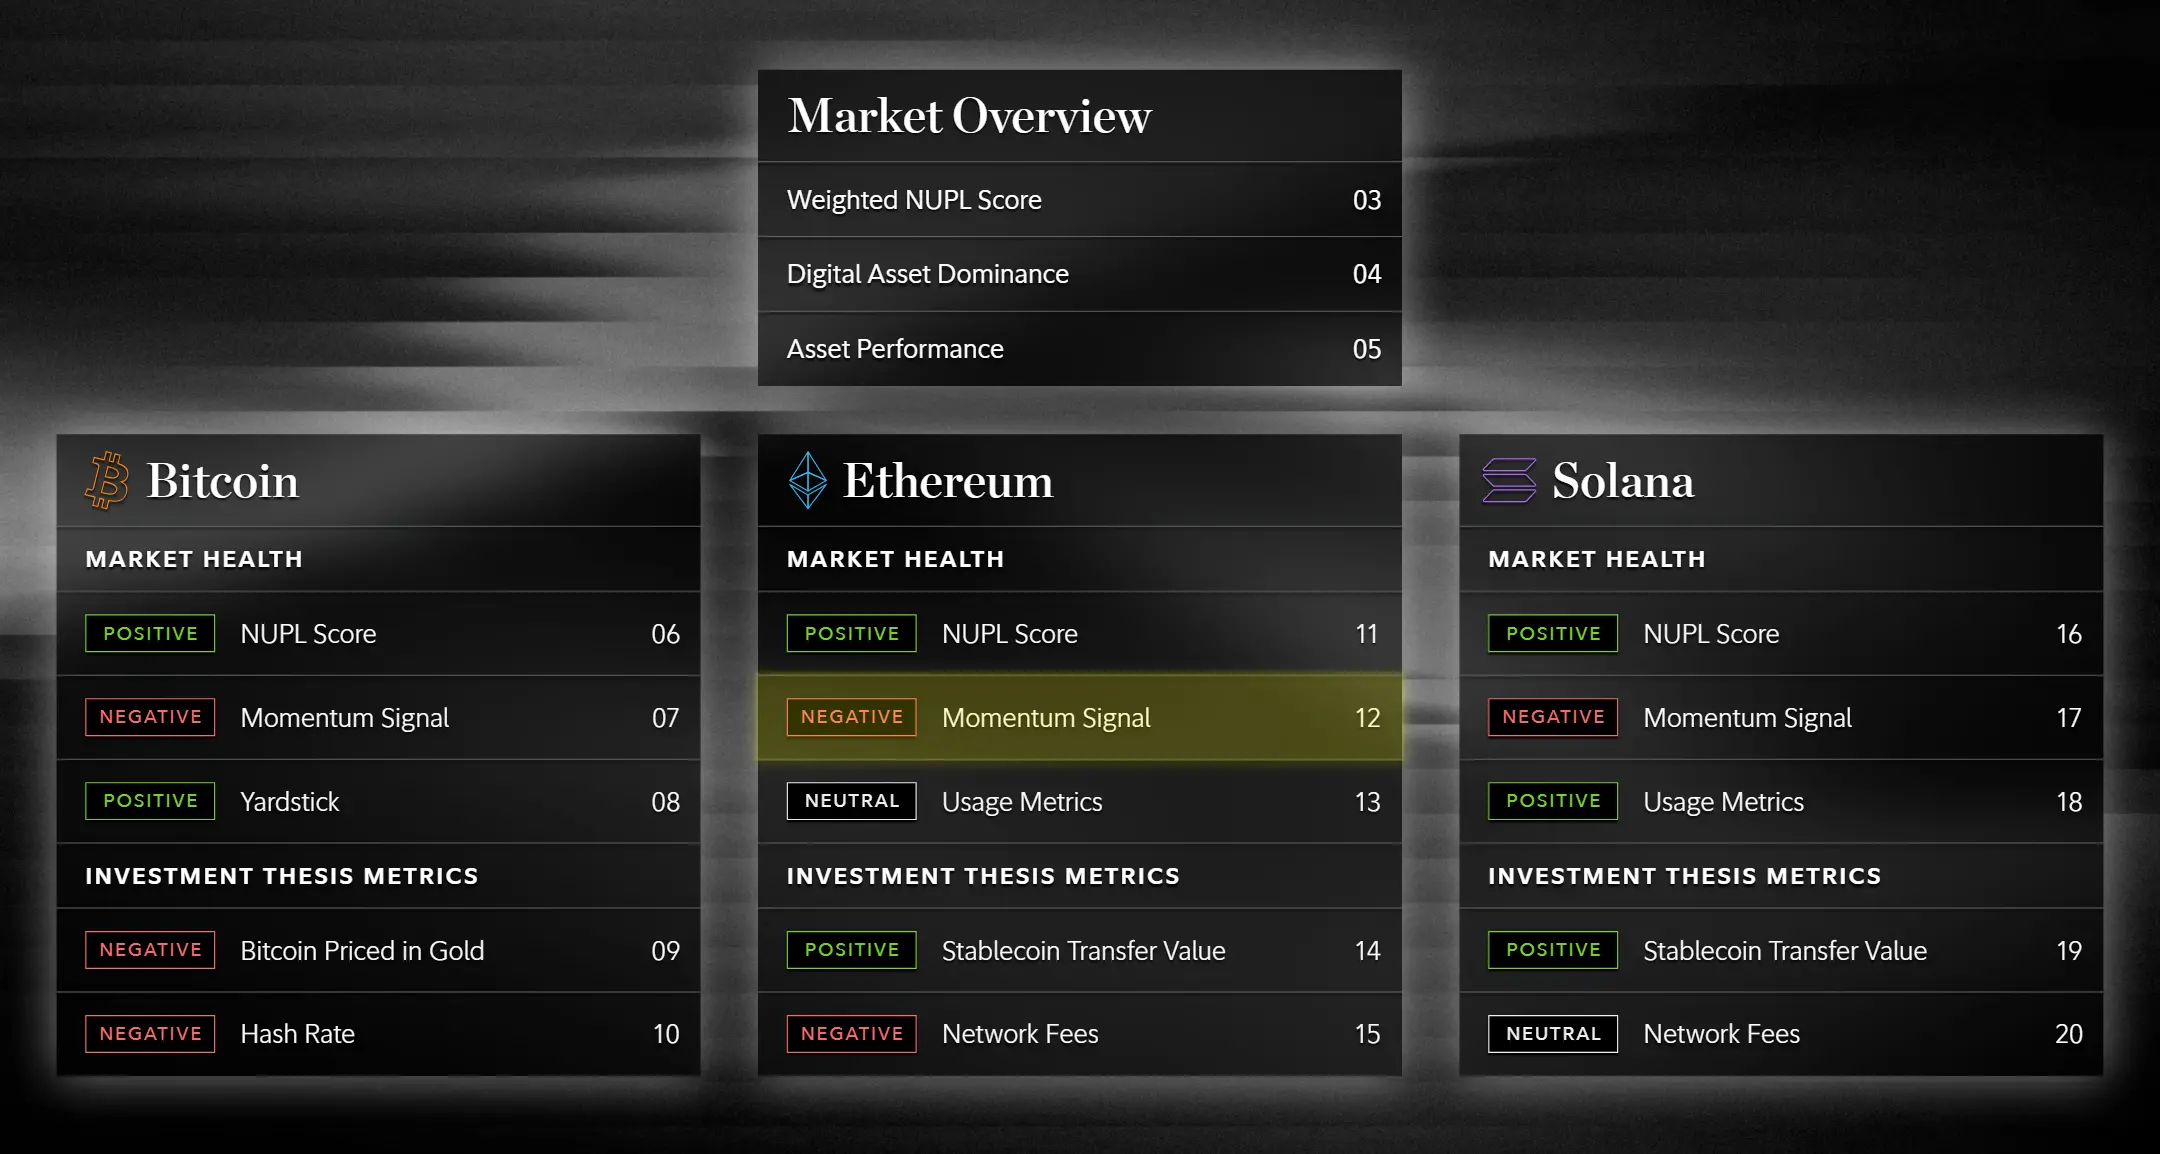
Figure: Overview Panel of Three Major Asset Signals
Weighted NUPL: BTC Solely Supports the Market
The weighted NUPL is used to measure a market-cap-weighted digital asset portfolio, indicating whether it is in a state of unrealized profit or unrealized loss. Given that BTC's market cap share far exceeds that of ETH and SOL, the current metric is largely determined by BTC.
At present, only BTC among the three assets still records unrealized profit, while both ETH and SOL are in a state of unrealized loss. After comprehensive calculation, the weighted NUPL is -0.01, indicating that the market overall is slightly below breakeven.
In other words, the only unrealized profits left in the market are concentrated in BTC, rather than coming from an overall improvement across various assets. BTC acts as a stabilizer, partially offsetting the loss pressure from ETH and SOL, but is still insufficient to bring the entire portfolio back to positive territory.
If the three assets had equal weight, the portfolio would be in a weaker state due to the deeper losses of ETH and SOL. Therefore, although the weighted NUPL has turned negative, the current market structure is still slightly healthier than the scenario of "losses evenly distributed among all assets."
This further reflects BTC's status as a barometer in the digital asset market. ETH and SOL are continuously weakening relative to BTC, showing a clearer preference from investors for the largest and most liquid asset, while remaining cautious about other digital assets that have historically been more volatile.
For investors, the current market resembles a bottom-seeking process in a repair phase, rather than entering a broadly profitable stage at the end of the cycle. BTC's relative strength has not spread to other assets, and market participation remains highly concentrated.
In Q2 2026, BTC's NUPL further retreated, and the weighted NUPL for the three assets dropped to -0.01. Before more assets re-enter a state of unrealized profit, the market is more likely to maintain a consolidation phase or continue to be under pressure, rather than quickly recovering to a comprehensive expansion.
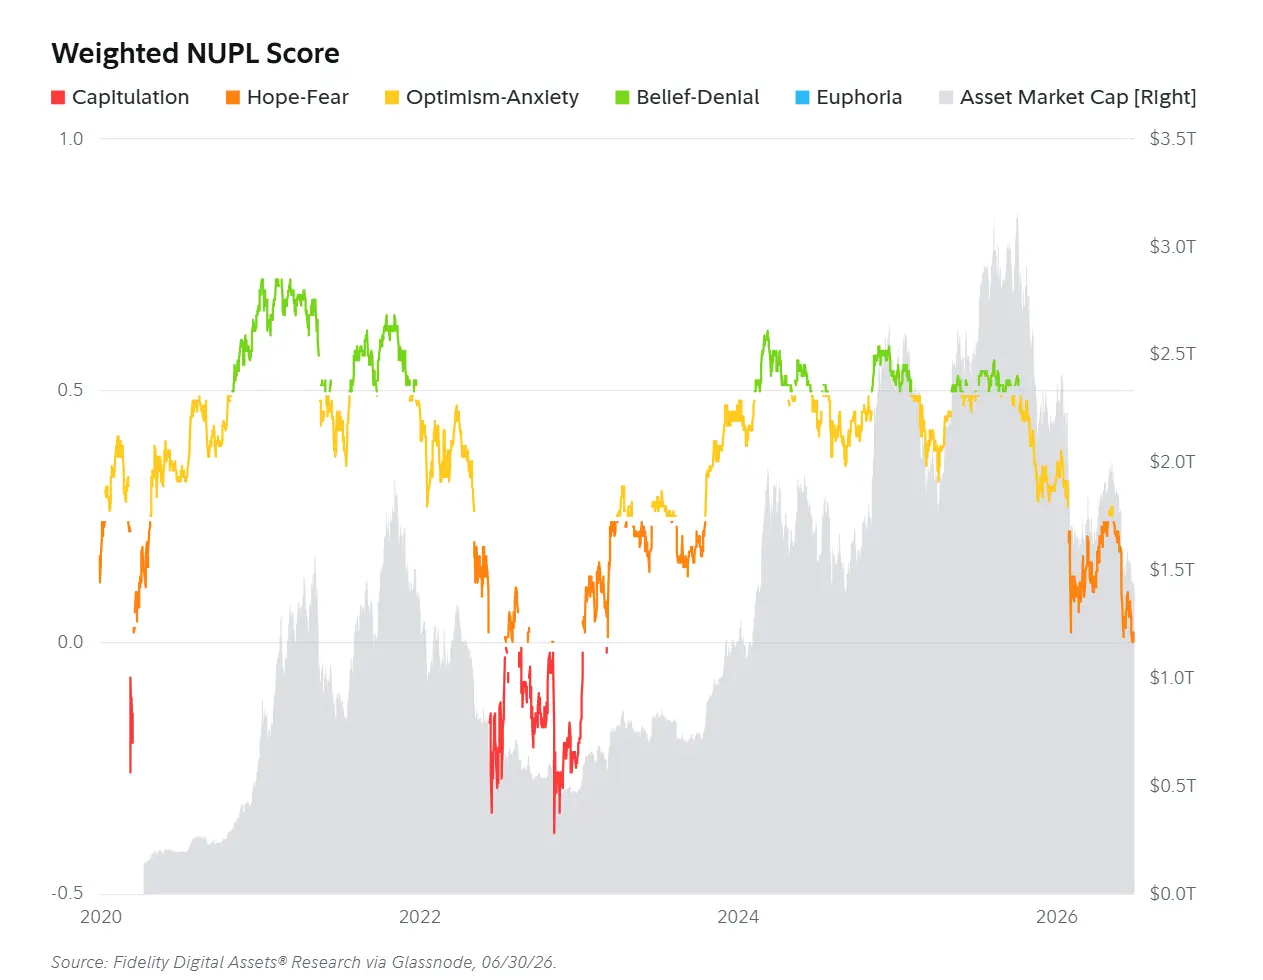
Figure: Weighted NUPL Scores
BTC Dominance Rate Rises to 68%, Asset Rotation Has Yet to Appear
After a continuous decline in the second half of 2025, BTC's dominance rate has slowly risen again, and the long-term upward trend has not been broken.
Historically, an increase in BTC's dominance rate usually accompanies other digital assets underperforming BTC. This reflects a tendency for funds to flow towards the most liquid and mature assets in environments of increasing uncertainty and pressured valuations.
The consistently higher low points of BTC's dominance rate, together with a relatively stable upward slope, indicates that this preference is not a short-term phenomenon.
The current dominance level suggests that funds are still concentrated in BTC, with market risk preferences showing clear selectivity. Participation in assets other than BTC is limited, and the overall market has not yet returned to a broadly relative strength.
In Q2 2026, BTC's dominance rate slightly increased from 67% to 68%, with signs of funds rotating towards other digital assets still weak.
If the BTC dominance rate begins to decline or turn sideways in Q3, it may mean that risk preferences are recovering, allowing other digital assets to regain fund attention, which could also serve as an early signal of a changing market structure.
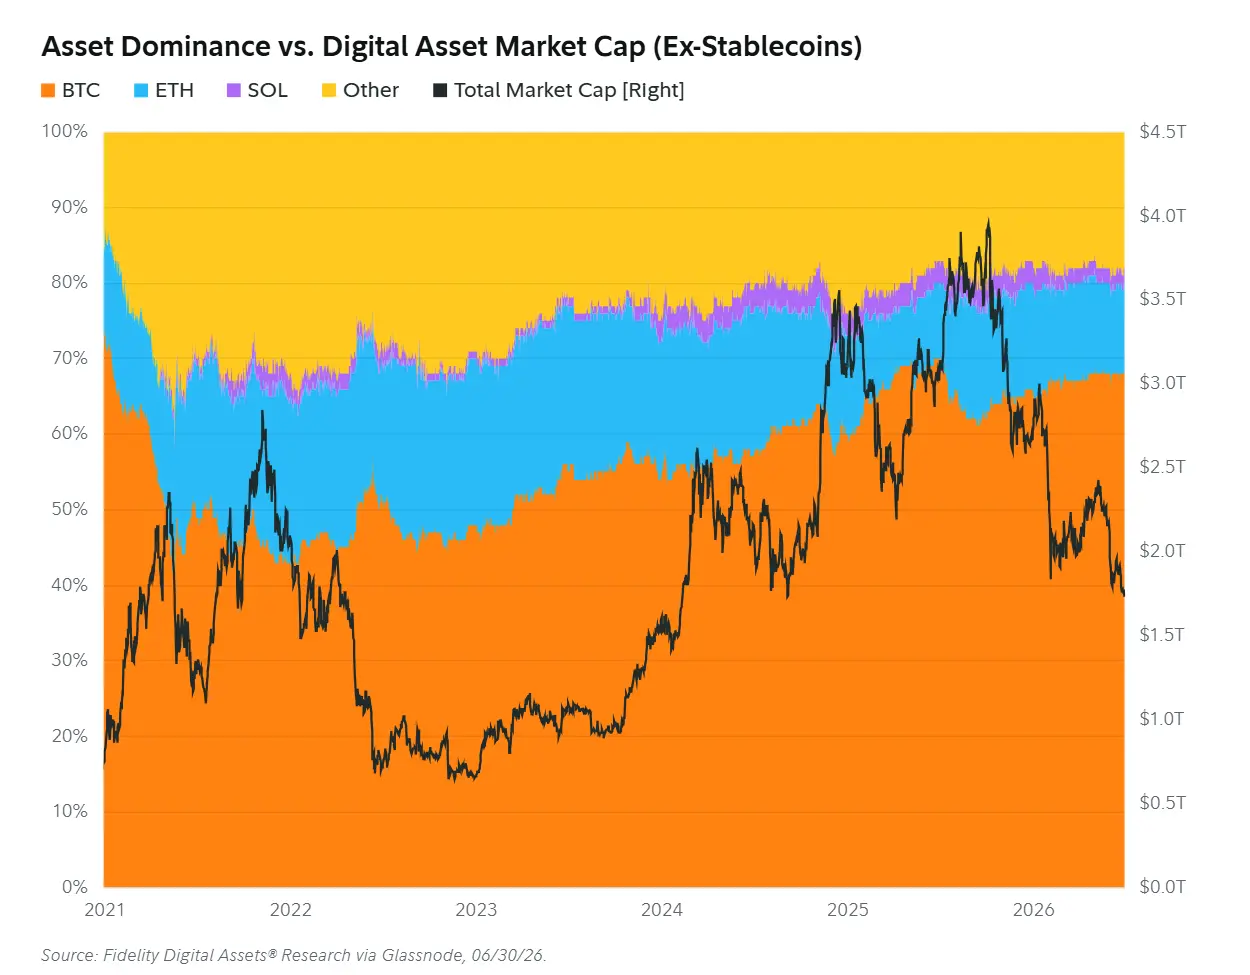
Figure: Asset Dominance Rates and Total Market Capitalization of Digital Assets, Excluding Stablecoins
Asset Performance: BTC, ETH, SOL Decline Across the Board
Based on rolling returns over the past year, BTC has fallen about 45%, ETH has declined 37%, and SOL has dropped 53%.
Year-to-date, all three assets have similarly performed weakly, with BTC, ETH, and SOL respectively down 33%, 47%, and 41%.
By the end of Q2, BTC had broken below the 200-week moving average, with market sentiment in a state of extreme pessimism, and the entire digital asset market also weakened in sync.
Adverse macroeconomic conditions, a shift of funds towards AI-related investments and the stock market, coupled with a continuous decline in market momentum, have collectively amplified this round of declines. At present, multiple indicators are approaching or have reached historical capitulation ranges.
Spot ETP fund flows continue to be negative. Since the beginning of 2026, there has been a cumulative net outflow of $5.4 billion from spot ETPs, of which $4.9 billion occurred in Q2.
In just the month of June, spot ETPs recorded a net outflow of about $4.5 billion, marking the worst month since the launch of the spot Bitcoin ETP.
From June 1 to 4, the market experienced nearly $6 billion in consecutive liquidations. Passive liquidations further amplified the selling pressure and disrupted the original position structure.
The macro and geopolitical environment also poses a drag. Inflation remains elevated, energy prices continue to be under pressure, and the market has significantly adjusted its expectations for monetary policy: at the beginning of the year, the market believed that there would be no rate cuts in 2026; by the end of Q2, the expectation had shifted to a possibility of rate hikes by the end of the year.
Short-term volatility remains high, and it usually takes time for the market to form a bottom.
However, the current valuation levels, along with an increasingly evident negative correlation between digital assets and traditional risk assets, may provide attractive entry points for long-term investors, provided that the adoption trend of the underlying networks can continue to strengthen.
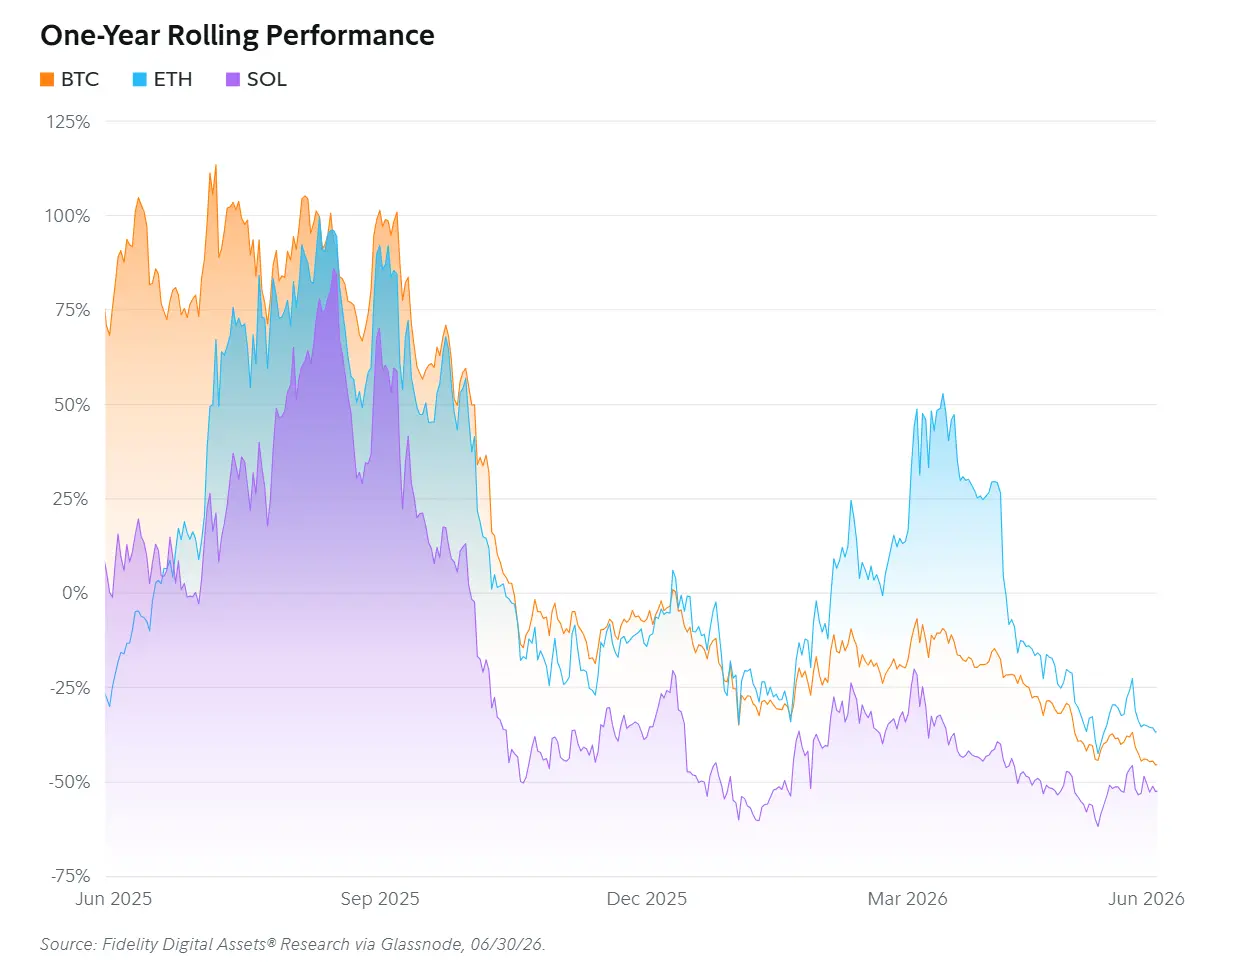
Figure: BTC, ETH, SOL One-Year Rolling Performance
2. Bitcoin
NUPL 0.09: Positive
At the end of Q2, BTC's NUPL was 0.09, in the "Hope-Fear" range, indicating that there are still a small amount of unrealized profits in the market but investor sentiment is becoming cautious.
Some holders are still in profit, but a general consensus that "the bottom has been established" is far from being formed.
In Q2, BTC dropped 14%, and the NUPL fell from 0.21 to 0.09, a decrease of 0.12. This appears more as a moderate contraction of unrealized profits among holders rather than a large-scale capitulation.
According to current data, BTC's market price is about 10% higher than the overall network average cost basis, with investors collectively holding about $108 billion in unrealized profits.
For most of April and May, BTC's NUPL was in the "Optimistic-Anxious" range, as the market gradually believed that a bottom might have been reached.
Recent metrics have retreated back to the "Hope-Fear" range, indicating that market sentiment has shifted from persistent optimism to caution and uncertainty.
Historically, during BTC bear markets, the NUPL has further dropped into capitulation territory; thus, the current state still needs to be viewed conservatively.
From historical data, when BTC's NUPL is around 0.09 +/- 0.05, the median one-year return thereafter is 53%, and the three-year annualized compound growth rate is 69%, with a total of 73 occurrences.
The correlation coefficients of NUPL with one-year and three-year returns are -0.26 and -0.80 respectively, indicating that the lower the NUPL, the higher the subsequent long-term returns tend to be. This is also the reason Fidelity classifies a lower NUPL as a positive signal.
However, the historical relationship may weaken or even fail; a judgment must still be made in conjunction with the macro environment and overall market structure.
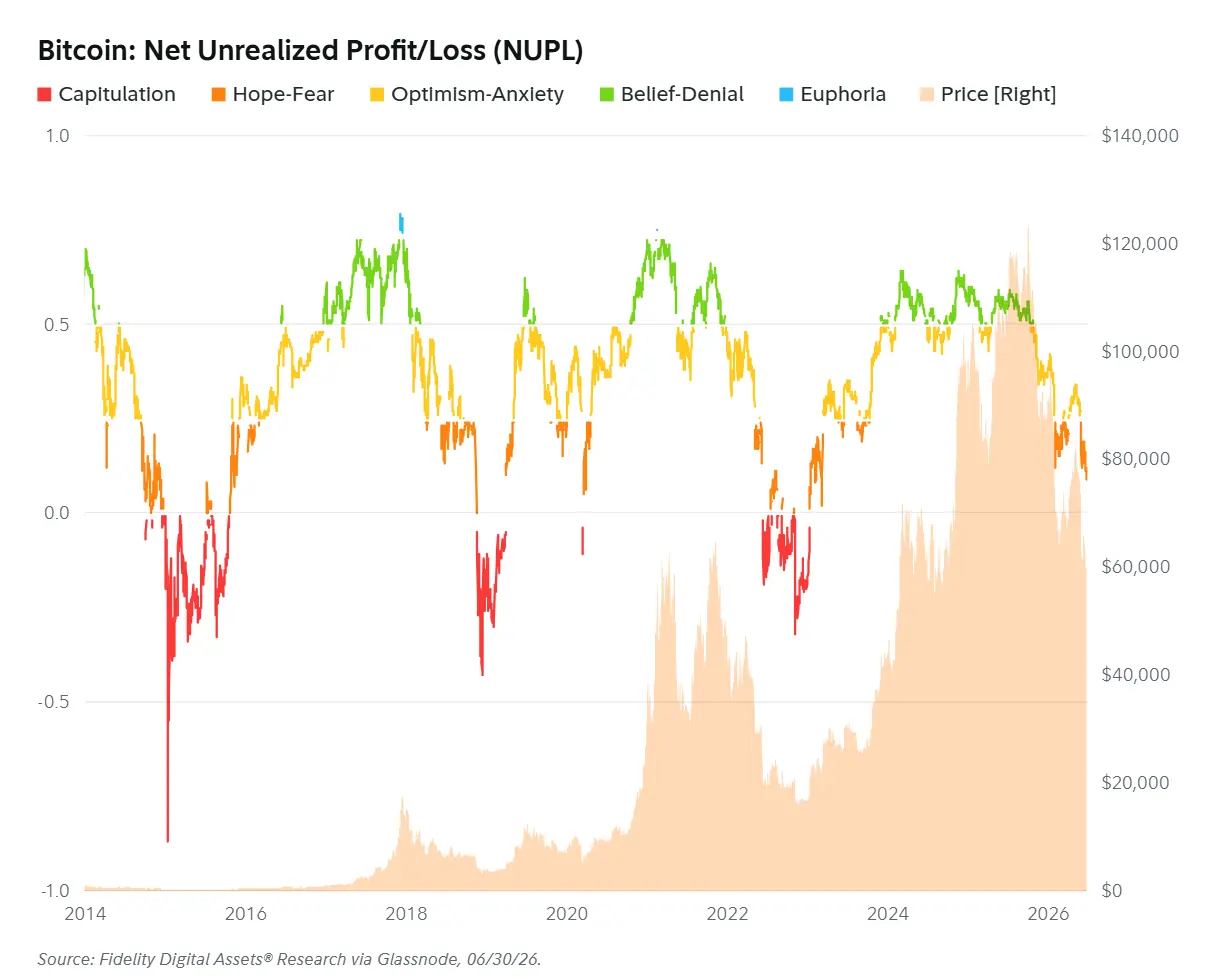
Figure: Bitcoin Net Unrealized Profit and Loss (NUPL)
Momentum Signal: Negative
BTC's current momentum indicators reflect that this round of decline has formed a bearish impulse, with prices failing to maintain higher highs over the past quarter.
The signal turned positive on April 21, 2026, when BTC was priced at $78,317, with both short-term volatility and price momentum rising above mid-term averages.
However, this rebound was not sustained. On June 1, the signal turned negative again when BTC was priced at $66,540, indicating that momentum had exhausted and prices were unable to hold steady.
In Q2, BTC's price fluctuated between $58,500 and $82,256, especially with severe fluctuations in April and May.
This quarter's momentum model experienced a false positive: the initial positive fluctuations at the beginning of Q2 were once judged to potentially continue but ultimately reversed rapidly.
This is an unavoidable cost of trend-following models. The aim of such models is not to accurately capture every top and bottom but to participate as much as possible once an upward trend has formed while controlling downside risks.
Since the signal turned negative on June 1, BTC has fallen about 10%, remaining in the negative momentum zone.
BTC's short-term realized volatility is about 34% annualized, below the 40% mid-term volatility. For the momentum signal to turn positive again, either short-term volatility must moderately recover, or mid-term volatility must decrease further.
It should be emphasized that this indicator is not used to predict exact tops and bottoms but to identify phases where price direction and volatility change in sync. Historically, these phases often correspond to accelerated market action.
The current reading still points to caution rather than a restoration of upward momentum.
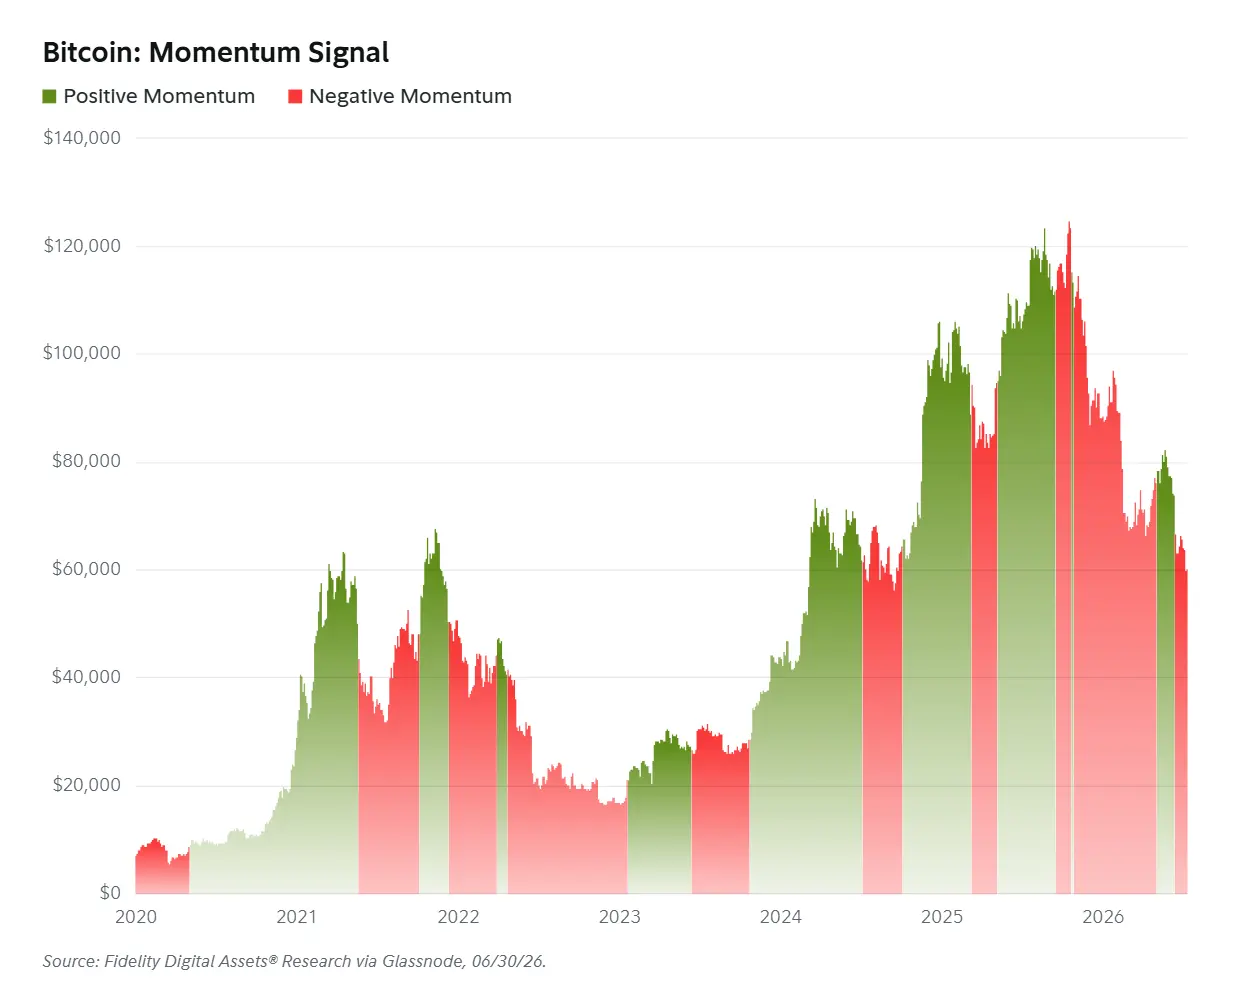
Figure: Bitcoin Momentum Signal
Yardstick: Positive
BTC's price has fallen more than 50% from its historical highs, but the overall network hash rate has only declined about 22% from its peak.
Miners are under significant pressure, but the entire network still shows strong resilience.
As a result, the Bitcoin Yardstick has approached historical lows, suggesting that relative to the hash rate required to maintain and protect the network, BTC may be significantly undervalued.
However, this cycle has some differences, including a decrease in price volatility and an increasingly mature mining industry.
BTC's price is a direct input variable for the Yardstick. After price volatility decreases, the relative impact of hash rate on this ratio becomes more pronounced.
Meanwhile, mining companies have improved their management capabilities regarding energy costs and operational efficiency, allowing for more flexible adjustments in operating rates, equipment migrations, or optimizing electricity contracts based on profitability.
Thus, mining capacity can be adjusted more flexibly with price changes, and the price-energy input relationship is less likely to diverge as drastically as in the past.
The combination of falling prices and declining hash rate has pushed the Yardstick into the "undervalued" zone. In the past 92 days, there have been 76 days—about 83% of the time—when the indicator was below one standard deviation of the long-term average.
Historically, this area typically corresponds to stages of market accumulation or relative bottoms.
In 2018, the Yardstick stayed in a similar range for 298 days; in 2022, it lasted for 299 days before market sentiment gradually recovered.
This current bear market has lasted approximately 203 days as of now. For investors focused on cyclical rhythms, October 2026 can serve as a noteworthy observation window, but it does not mean the market will necessarily bottom out at that time.
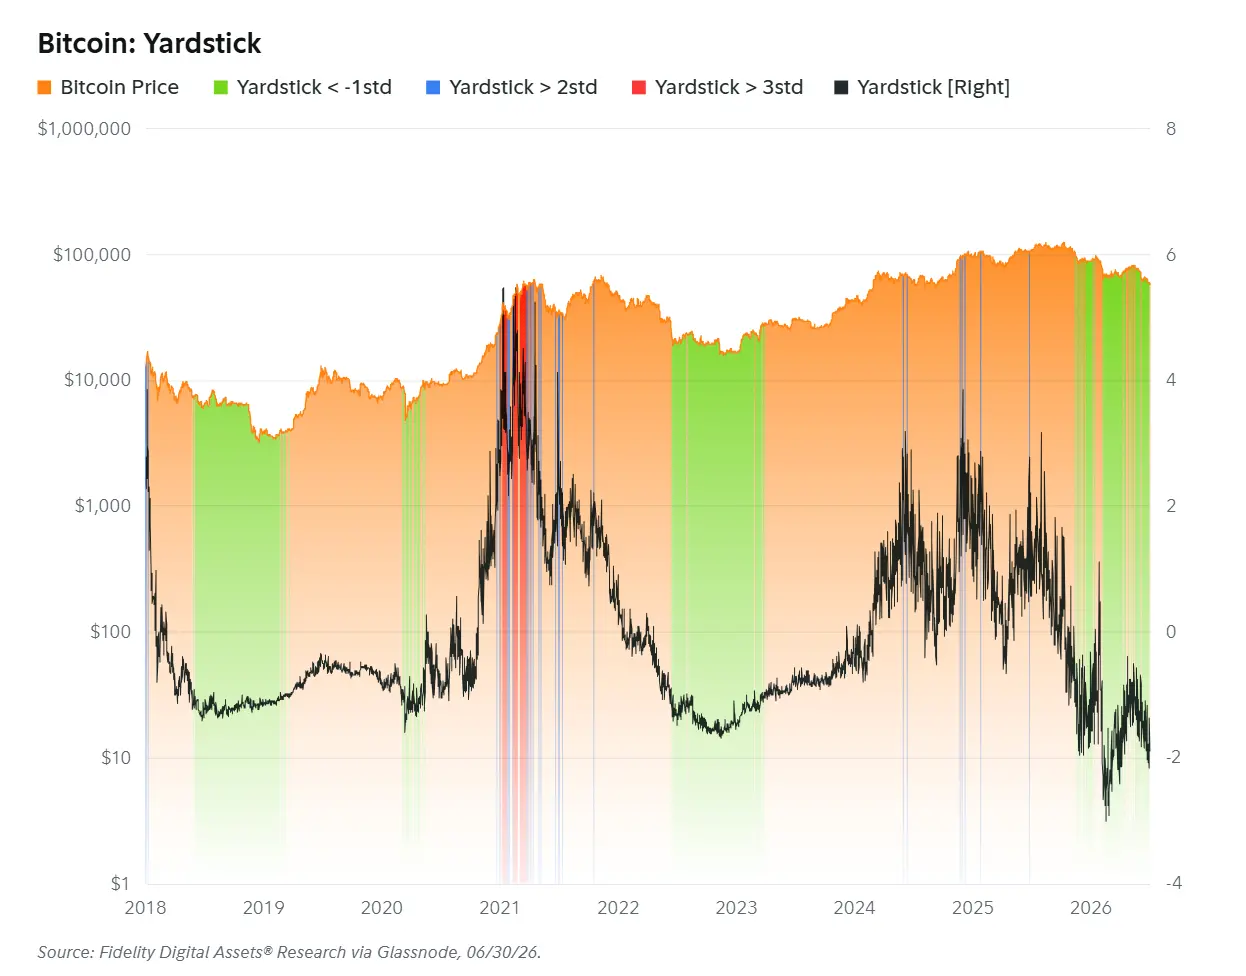
Figure: Bitcoin Yardstick
Relative Performance to Gold: Negative
One of the core investment logics of BTC is its potential as a store of value.
Using gold as a valuation benchmark allows for measuring BTC's performance relative to another traditional safe-haven asset, rather than just observing its price changes relative to fiat currencies.
Recently, the substantial price volatility has indeed weakened BTC's narrative as a store of value in the short term, but it is still insufficient to prove that its long-term investment logic has failed.
In Q2 2026, although BTC fell 14% against the dollar, its relative price to gold remained basically unchanged.
After about a year of continuous underperformance, investors' preferences between BTC and gold may be rebalancing.
Since February 28, BTC has risen 15% relative to gold. Against the backdrop of ongoing geopolitical uncertainty, the relative trends of both have begun to stabilize.
The strong performance of gold over the past year is largely due to the continued buying by central banks around the world. In this context, the relative relationship between BTC and gold may be forming a more stable balance.
Meanwhile, on-chain indicators still point to an accumulation phase, with some indicators even showing signs of capitulation.
For long-term allocators, BTC's previous relative underperformance against gold may make the current valuation more attractive.
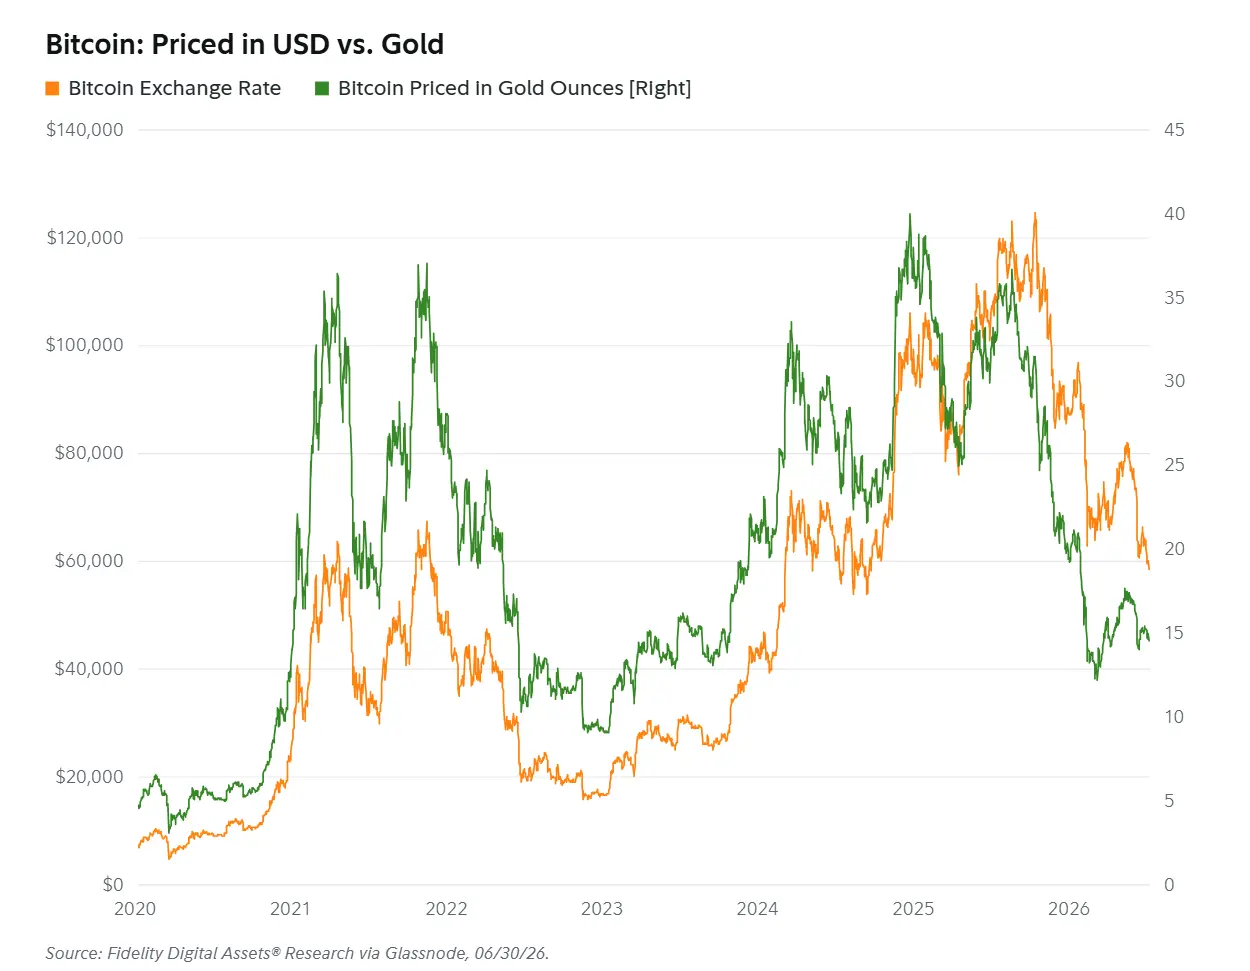
Figure: Bitcoin Performance in Dollars vs. Gold
Hash Rate: Negative
BTC's average daily hash rate and 30-day average hash rate are still below the historical milestone of 1 ZH/s, first achieved in September 2025.
The main reasons behind this include: first, AI and high-performance computing businesses are increasingly attractive to power, land, and data center resources; second, the bear market has compressed the profit margins for Bitcoin mining.
Some mining companies may be redirecting their power capacity, data center infrastructure, and new capital expenditures towards AI or high-performance computing businesses.
Under the current low BTC price environment, AI hash rate contracts often provide more stable and predictable income, making reallocating infrastructure economically reasonable for mining firms.
It is important to note that Bitcoin ASIC mining machines are highly specialized hardware and typically cannot be directly applied to AI computing. Therefore, mining companies' shift towards AI is more about reusing electricity, land, machine rooms, and cooling facilities rather than directly converting existing mining machines into AI servers.
Idle mining machines are also unlikely to remain dormant for long. The more common approach is to sell the equipment or relocate it to areas with lower electricity prices instead of permanently withdrawing from the network.
Since BTC's price peaked in October 2025, hash rate has continuously declined. Meanwhile, mining difficulty has remained high over the long term, failing to drop synchronously with the price.
Price declines and compressed margins have led miners on the cost edge to shut down operations sequentially.
Historically, the deterioration of mining economics during bear markets can also result in periodic declines in hash rate. However, the competition for infrastructure resources posed by AI data centers and power contracts may cause this round of hash rate decline to last longer than historical averages.
In Q2, the average daily hash rate rose by 8% quarter-on-quarter, but the 30-day average hash rate declined by 6% in the same period.
Since 2026 began, BTC's price has fallen over 29%, while hash rate has only decreased by about 12%, indicating that while miner economics are under pressure, the network as a whole still displays some resilience.
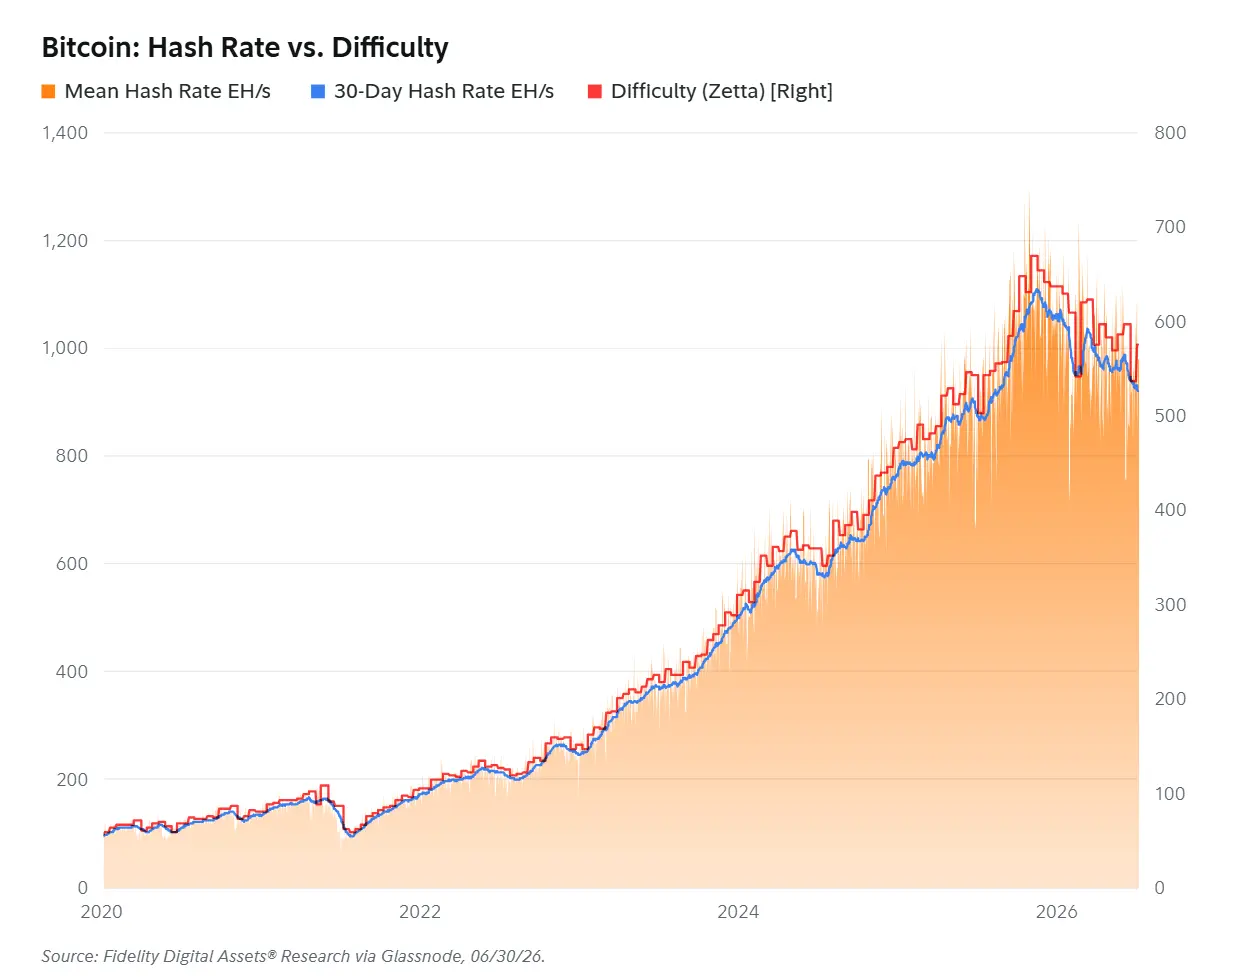
Figure: Bitcoin Hash Rate and Mining Difficulty
3. Ethereum
NUPL -0.43: Positive
In Q2, ETH's NUPL continued to probe deeper into the "capitulation" range, with market sentiment further deteriorating.
During the quarter, ETH's price dropped 25%, with NUPL falling from -0.12 to -0.43, a decline of 0.31, and investors' unrealized losses were significantly expanded.
According to the current data, ETH's trading price is about 30% lower than the overall network average cost basis, with total unrealized losses around $87 billion.
On June 6, ETH's NUPL touched a stage low of -0.46, after which it has not dipped further.
Although the indicator still has the potential to make new lows, this low point is currently being held, possibly marking a level worth noting for long-term investors.
Historically, when ETH's NUPL is around -0.43 +/- 0.05, subsequent returns tend to be substantial.
Since 2018, similar readings correspond to a median one-year return of 70% and a three-year annualized growth rate of 133%, with both time frames containing 90 observations.
The correlation coefficients of NUPL with one-year and three-year returns are -0.13 and -0.81, respectively, indicating a more pronounced negative relationship with long-term subsequent returns. This is also the basis for Fidelity classifying a lower NUPL as a positive signal.
However, historical patterns may weaken or fail, and broader market conditions must also be considered in the judgment.
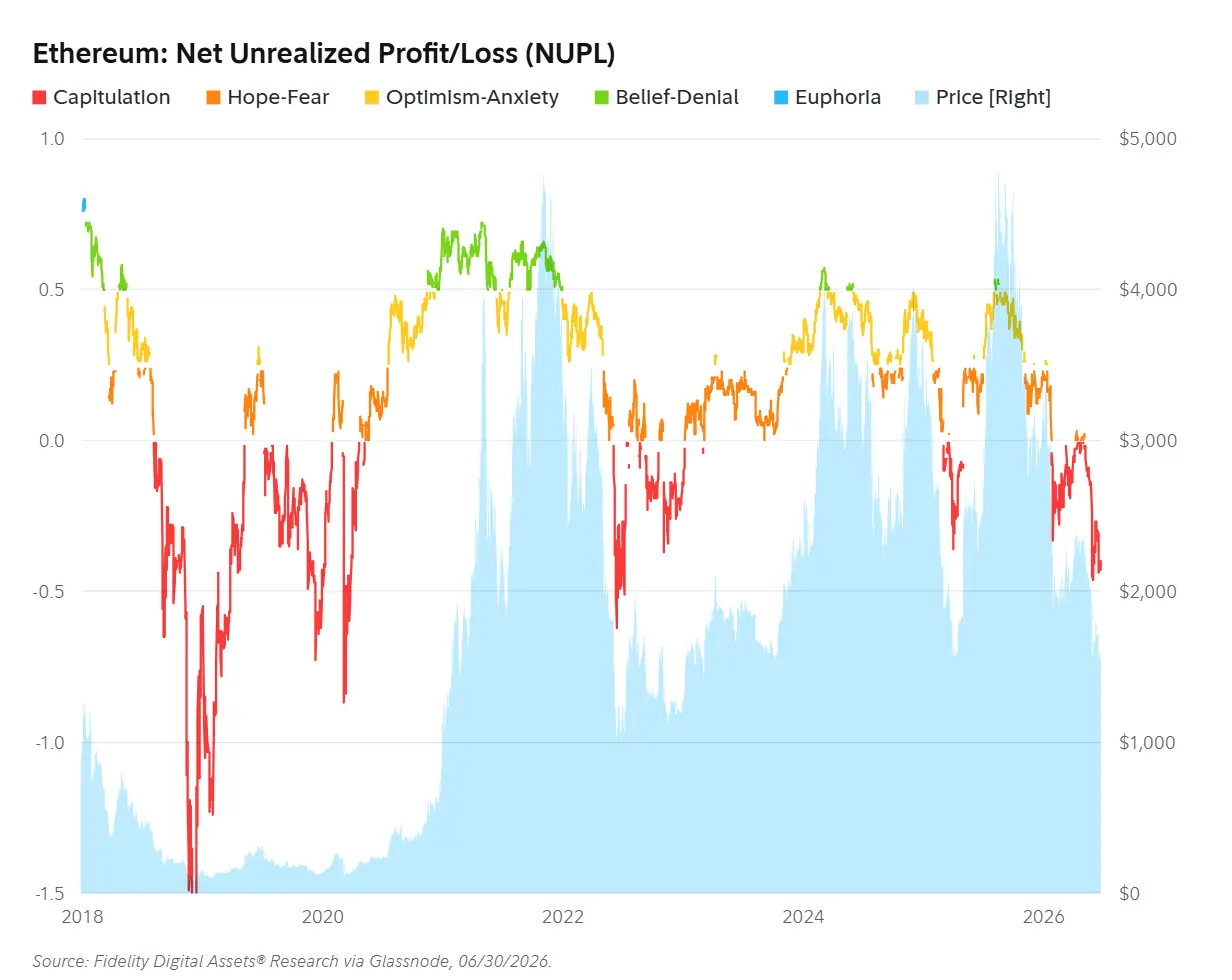
Figure: Ethereum Net Unrealized Profit and Loss (NUPL)
Momentum Signal: Negative
ETH's momentum signal turned positive on April 16, 2026, when the price was $2,350, with volatility and price momentum both above their mid-term averages.
However, ETH failed to maintain its increase. On May 17, the signal turned negative again when the price fell to $2,130.
Throughout Q2, ETH fluctuated between $1,564 and $2,422, with particularly volatile conditions in April and May.
Similar to BTC, ETH's momentum model also experienced a false positive this quarter.
Since the signal turned negative on May 17, ETH has fallen about 25%, remaining in the negative momentum zone.
Short-term realized volatility is maintained at about 50% annualized, significantly lower than the mid-term volatility of 71%.
For the signal to turn positive again, either short-term volatility must significantly recover, or mid-term volatility must decrease substantially.
The current indicators reflect that price and volatility are sliding together rather than upward momentum having been restored.
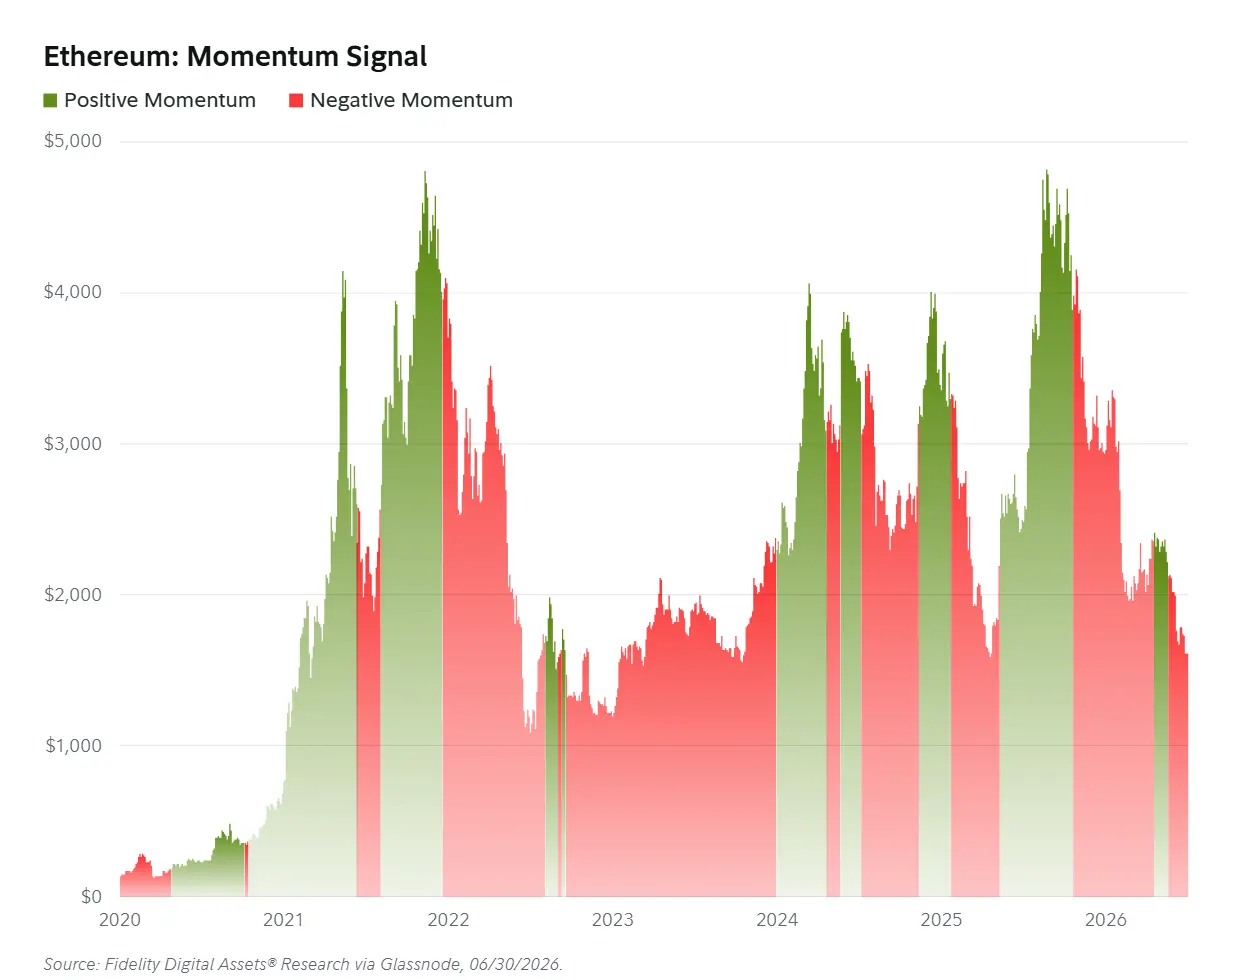
Figure: Ethereum Momentum Signal
Usage Indicators: Neutral
In Q2, the fundamentals of Ethereum's base layer showed overall cooling, consistent with the continuing decline in ETH prices and decreasing volatility.
However, total transaction counts continued to show some resilience, declining only 5% during the quarter, with daily transaction volumes consistently above 2 million.
Transaction fees remain far below historical averages, but still sensitive to short-term demand changes.
On April 22, Ethereum's median transaction fee briefly surged to $0.42, then continued to decline, falling to about $0.02 by the end of the quarter.
Active addresses and new addresses saw significant retreats after reaching historical highs in the previous quarter, decreasing by 10% and 31%, respectively.
Considering the weak price performance during the quarter, the correlation between on-chain activity and asset prices remains strong.
In Q2, the proportion of addresses with real economic activity slightly increased, but a substantial number of addresses still do not contribute significantly to Ethereum's revenue or security.
This trend may continue into 2026. The upcoming Glamsterdam upgrade is set to focus on enhancing base layer capacity, which may further increase block space supply.
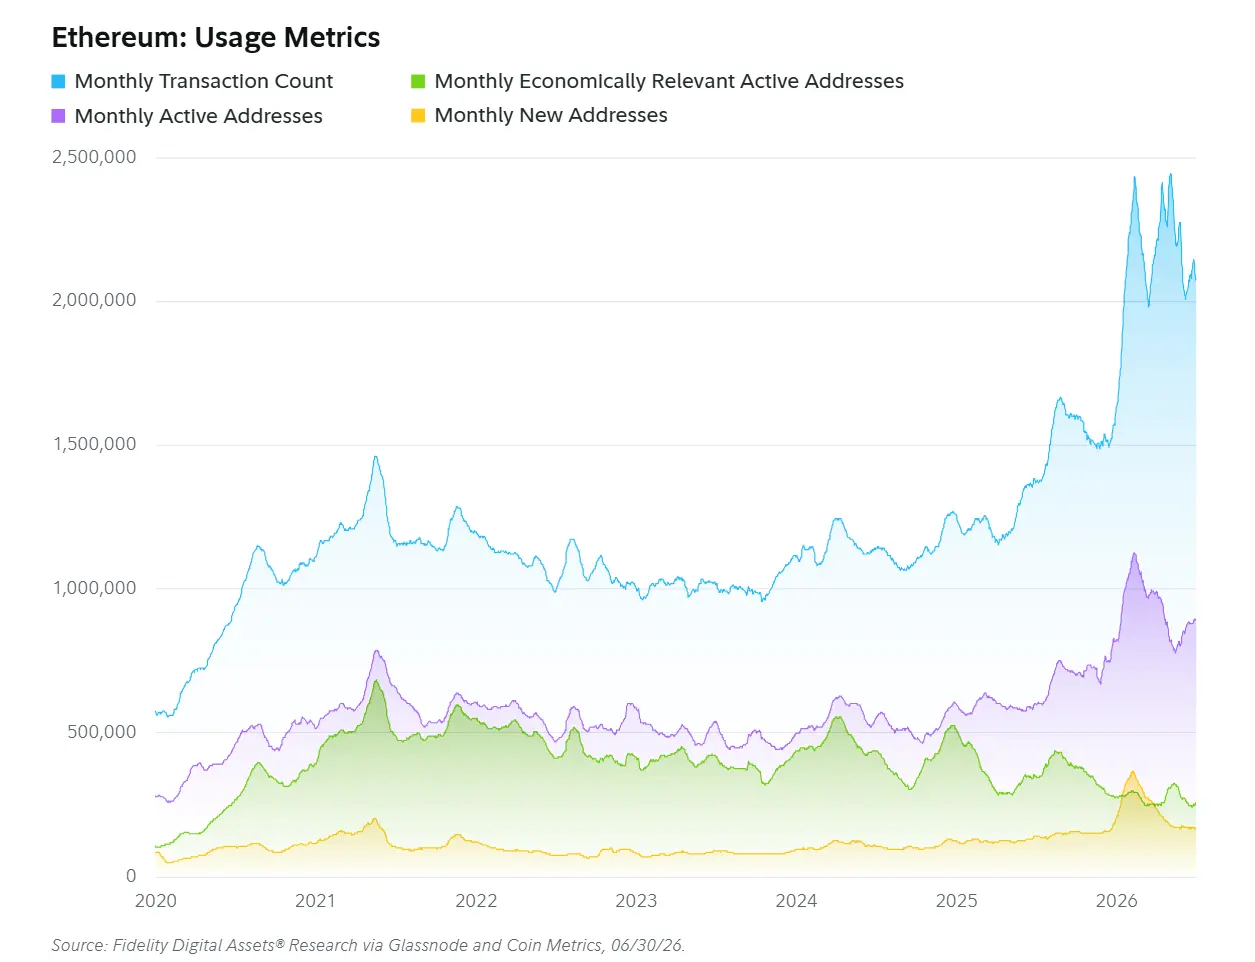
Figure: Ethereum Usage Indicators
Stablecoin Transfer Volume: Positive
Driven by expansion progress and an improving regulatory environment, stablecoin transfer volumes on Ethereum have surpassed historical averages.
Over the past 12 months, total stablecoin transfers have consistently hit new highs, accumulating over $20 trillion.
However, growth rates have begun to show signs of slowing. The average daily stablecoin transfer volume in June was about 9% lower than in the previous three months.
Over the past year, the stablecoin market has experienced rapid expansion, and growth rates may begin to return to more stable levels over the next year.
Notably, despite the overall decline in digital asset prices, stablecoin transfer volumes on Ethereum continue to grow.
This indicates that the real demand for stablecoins is gradually disengaging from market sentiment and asset prices, being increasingly used for payments, settlements, and globally acquiring on-chain dollars, rather than solely serving speculative trading.
The average transfer cost of stablecoins has remained below $1 for three consecutive quarters, further validating the practical effects of previous expansion measures.
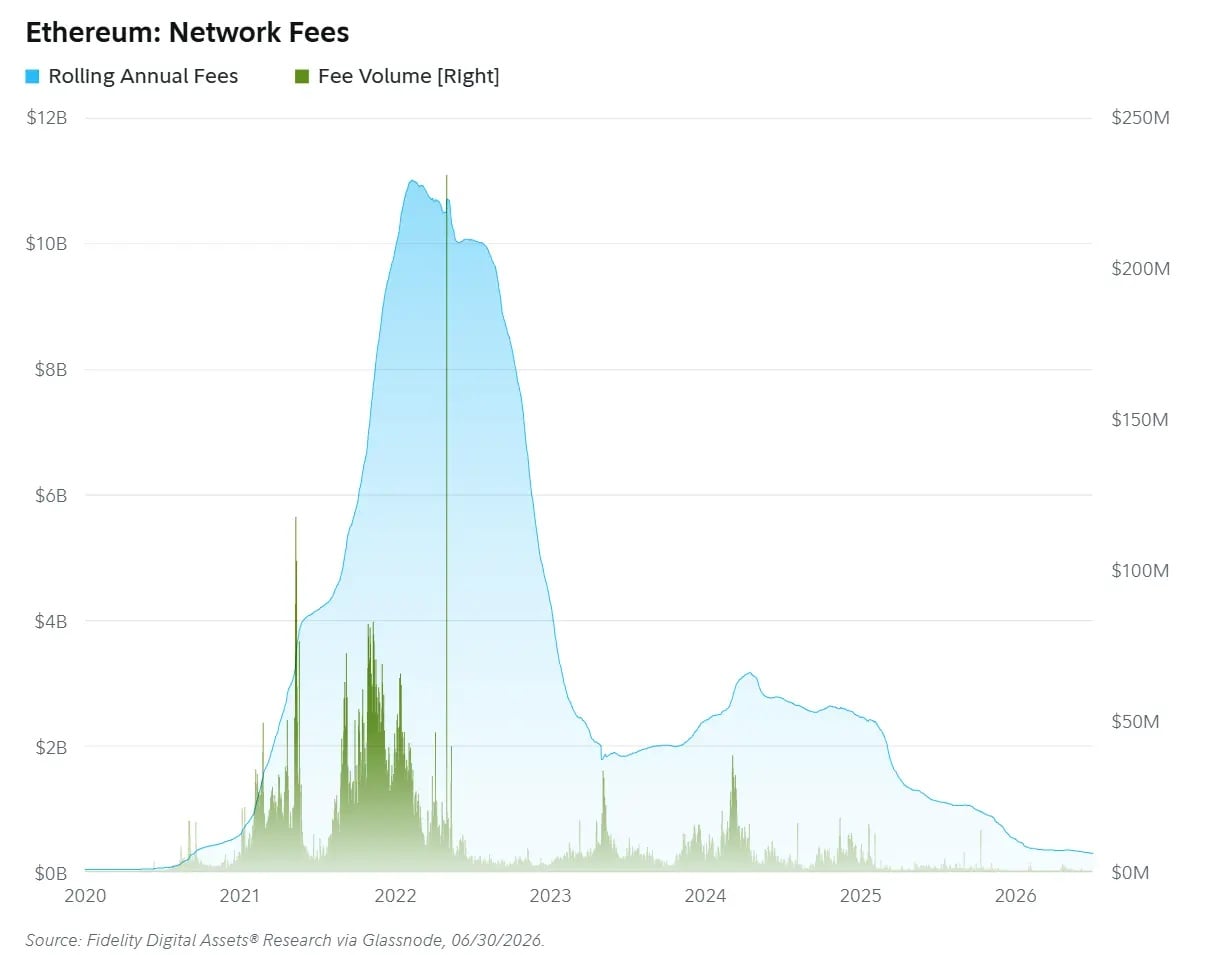
Figure: Total Stablecoin Transfer Volume on Ethereum
Network Fees: Negative
Over the past year, the fees collected by the Ethereum network have continued to decline.
In Q2, the rolling 12-month network fees dropped from $344 million to $294 million, a decrease of 15%.
The speed of scalability in protocols and infrastructure layers continues to outpace the growth in block space demand. As developers refocus on base layer scalability, this trend may have a long-term nature.
The upcoming Glamsterdam upgrade is expected to further expand block space capacity, suggesting that Ethereum network fees may still face downward pressure over the next year.
The levels of Ethereum's fees fluctuate significantly, making it difficult to determine a reliable long-term equilibrium value.
In Q2, Ethereum's daily network fees fluctuated between $145,000 and $2.75 million, with an average of about $575,000 per day.
One of the signals investors need to closely observe in the coming years is how core developers balance network growth with value capture.
As a technology platform that is still evolving, Ethereum has previously emphasized user adoption, ecosystem expansion, and network utility rather than short-term revenue.
Unless developers and researchers invest more effort into improving value capture mechanisms, network fees and protocol revenues may continue to face headwinds.
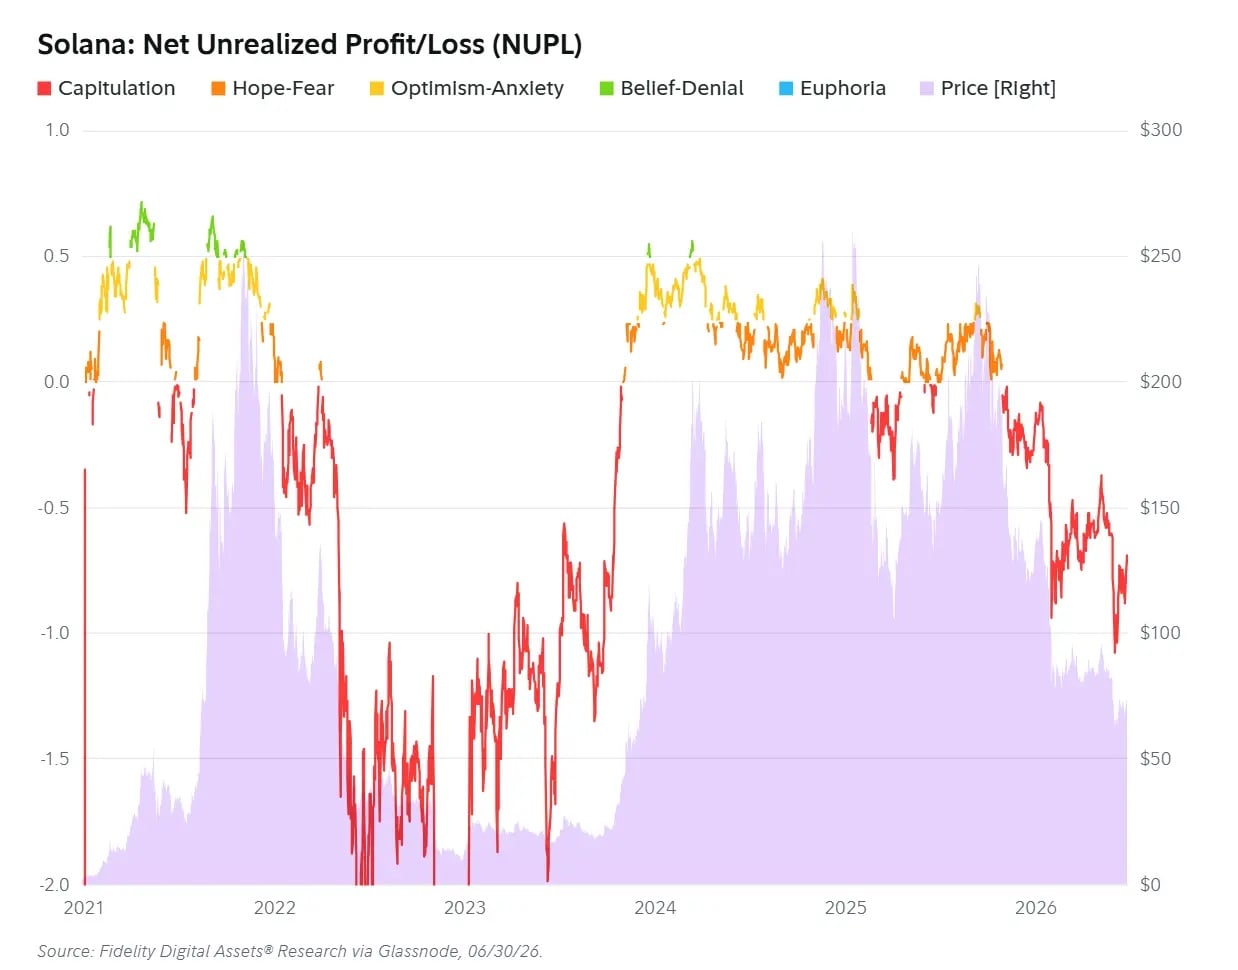
Figure: Ethereum Network Fees
4. Solana
NUPL -0.72: Positive
In Q2, SOL's NUPL consistently stayed in the "capitulation" range.
During the quarter, SOL's price dropped 12%, with NUPL falling from -0.67 to -0.72, a decrease of 0.05, and unrealized losses further expanded.
According to the current data, SOL's trading price is about 41% lower than the overall network average cost basis, with total unrealized losses around $29 billion.
On June 6, SOL's NUPL rebounded significantly from a stage low of -1.08, reflecting SOL's characteristic high volatility in this bear market.
The recovery from the low point may signify that a considerable portion of early holders has sold off their positions, and new investors are beginning to take over at lower prices.
Historically, instances where SOL's NUPL falls within the range of -0.72 +/- 0.05 are very rare, but subsequent market performance tends to be strong.
Since the inception of the Solana network, similar readings have occurred 21 times. The corresponding median one-year return is 542%.
Due to the lack of sufficiently long historical data, it is currently not possible to calculate a reliable three-year return.
SOL's current NUPL has a correlation coefficient of -0.56 with one-year returns, indicating a relatively strong negative correlation.
However, given Solana's short operational history and limited sample size, this historical relationship must be viewed with caution, as it may not be repeatable in the future.
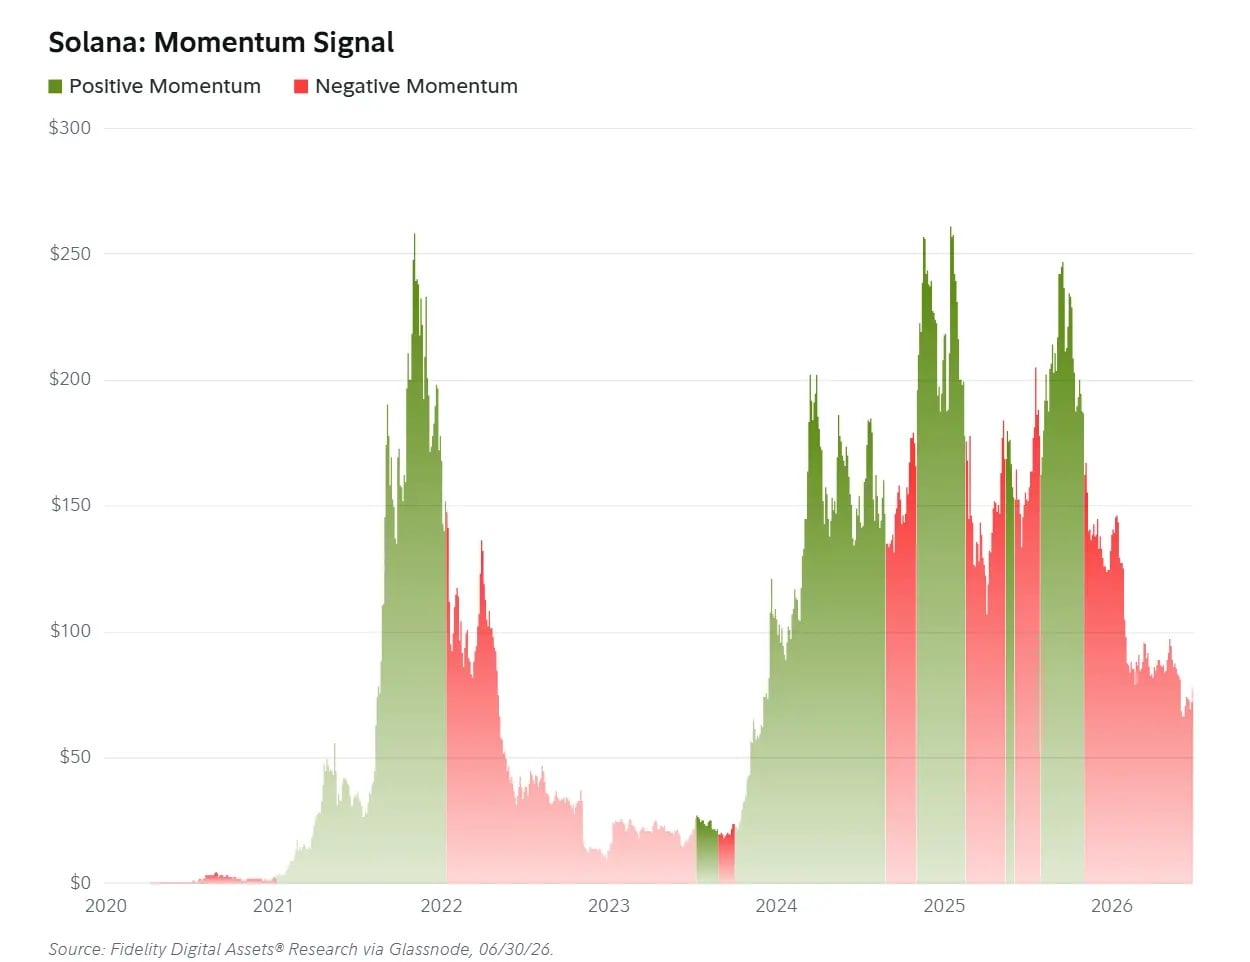
Figure: Solana Net Unrealized Profit and Loss (NUPL)
Momentum Signal: Negative
SOL's momentum signal has remained negative since October 28, 2025, with overall price and volatility declining in sync, and the market environment remains cautious.
However, recently SOL's short-term realized volatility has risen above mid-term volatility, with annualized figures of about 63.5% and 61% respectively.
Historically, this state sometimes appears around momentum reversals. If prices can strengthen in sync, it would provide stronger support for forming a temporary bottom.
Notably, SOL has not experienced a false positive in momentum signals during this quarter, unlike BTC and ETH.
For most of Q2, SOL fluctuated between $63 and $97, with the price around $81 at the quarter's start.
According to SOL's own model parameters, even when the price briefly soared to $97, the momentum was still insufficient to turn the signal positive, and then the price set new lower lows.
When the signal first turned negative on October 28, 2025, SOL's price was approximately $194. Since then, the price has fallen around 60%, and the adjustment has not yet completely finished.
The current indicators are closer to "attempting stabilization" rather than upward momentum having been restored.
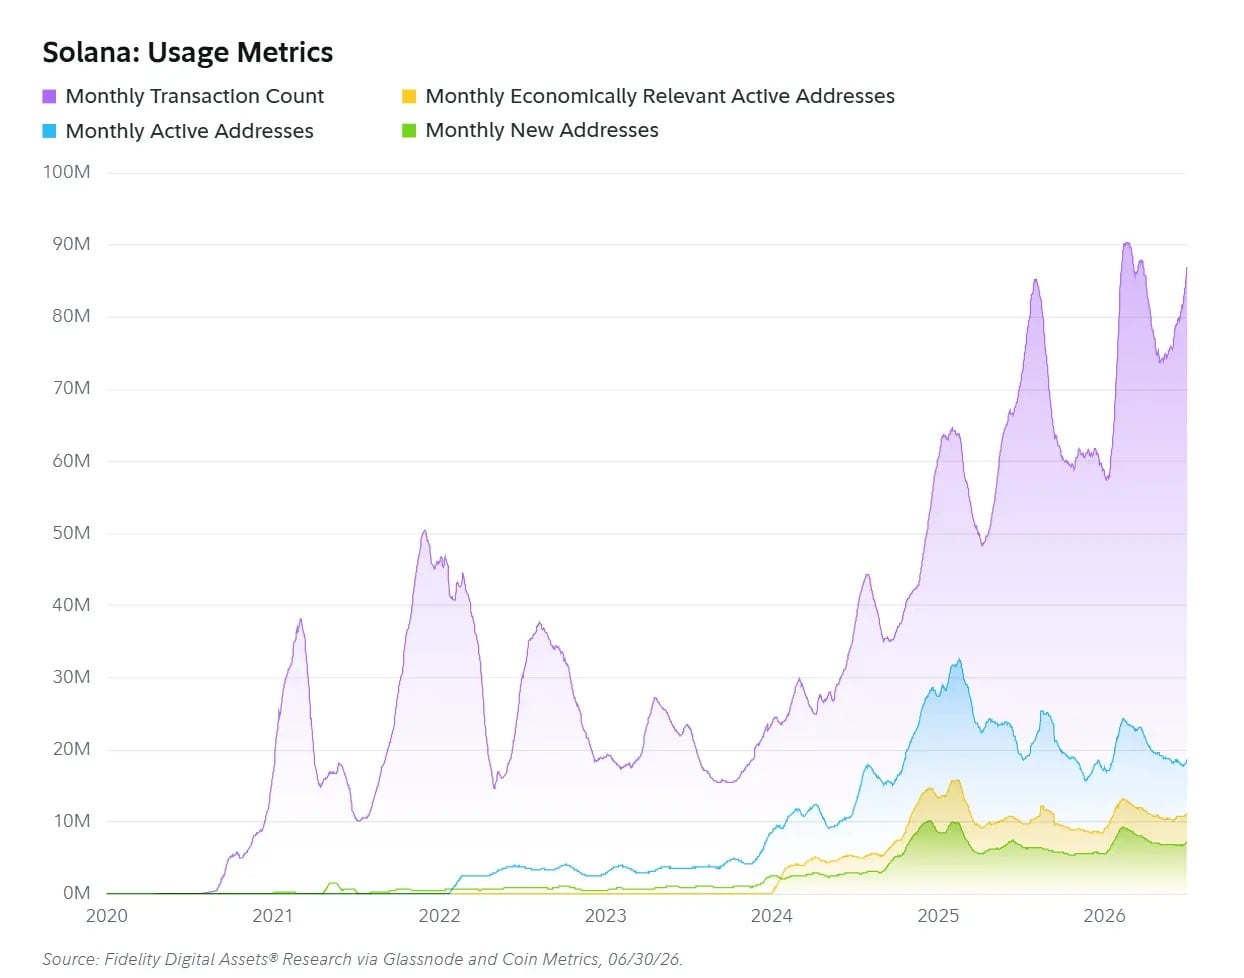
Figure: Solana Momentum Signal
Usage Indicators: Positive
Despite being in a bear market, Solana's fundamentals still show strong resilience. Asset prices continue to weaken, but on-chain activity demand has not shrunk proportionately.
Monthly transaction counts continue to rise, with a 1% quarter-on-quarter increase in Q2, still on track to set historical highs.
However, the growth rate of user numbers is slower than the growth rate of network activity, suggesting that the average number of transactions initiated per user is increasing.
In Q2, monthly active addresses and new addresses decreased by 15% and 7%, respectively, while addresses with actual economic activity only decreased by 4%.
In the current market environment, economically meaningful on-chain activity remains relatively stable, in contrast to the trends observed in Ethereum.
Another advantage of Solana is its stable transaction costs.
Throughout the quarter, Solana's median transaction fee stayed below 0.1 cents, showing little fluctuation, providing users and investors with strong predictability regarding costs.
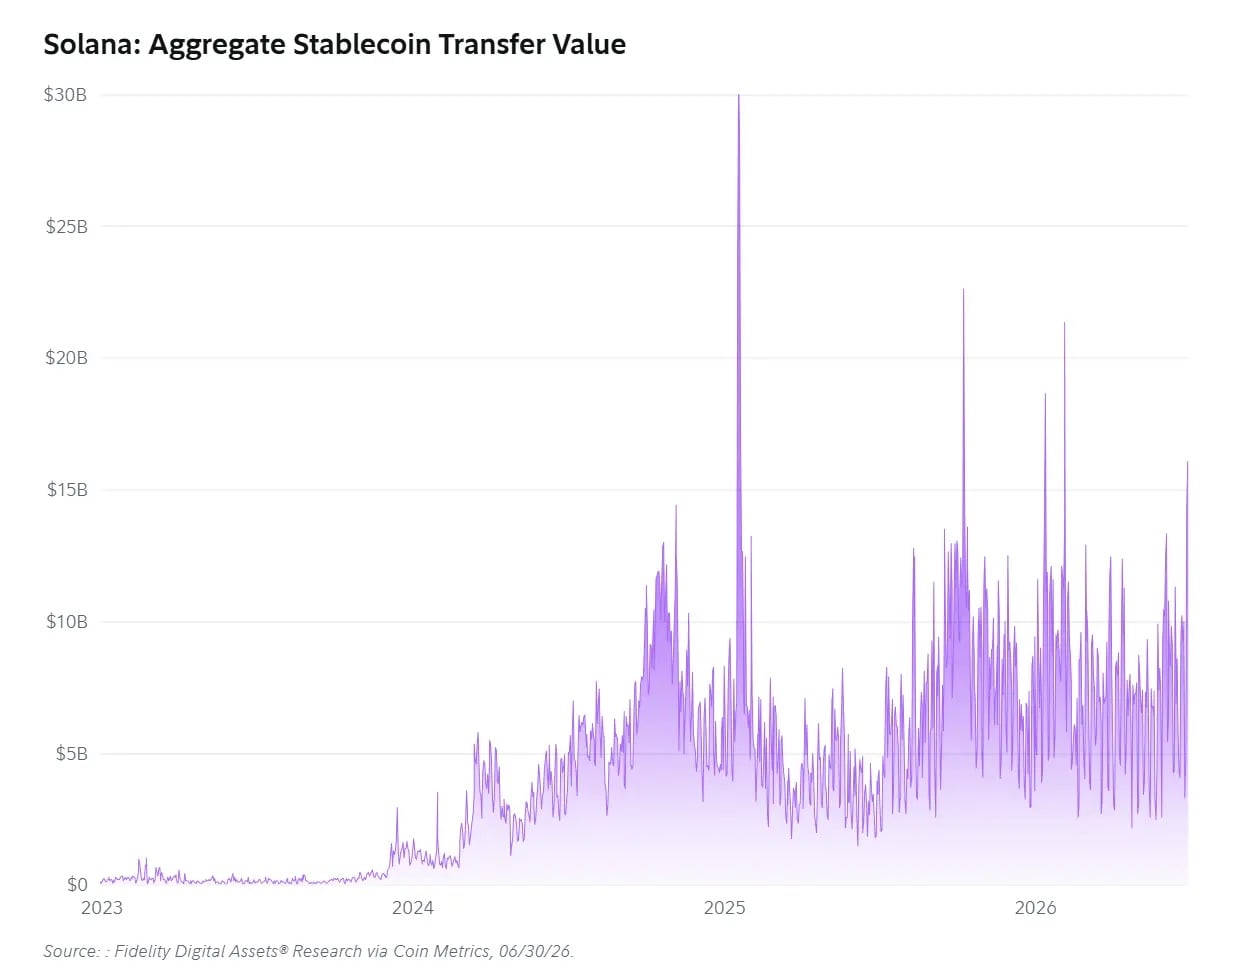
Figure: Solana Usage Indicators
Stablecoin Transfer Volume: Positive
The stablecoin transfer volume on Solana has historically been volatile but has shown clear growth since more than a year ago, maintaining a long-term upward trend.
Currently, Solana's average daily stablecoin transfer volume stabilizes at over $8.4 billion, representing a 17% quarter-on-quarter growth.
Compared to Ethereum, the average stablecoin transfer amount on Solana is smaller, reflecting differences in user structure and usage scenarios between the two networks.
Over the past 12 months, Solana has processed more than $2.6 trillion in stablecoin transfers.
While the price of SOL has significantly dropped, stablecoin trading volumes and other on-chain activities have remained stable.
Similarly to Ethereum, a considerable portion of stablecoin demand on Solana shows strong stickiness, with little correlation to short-term market fluctuations.
If on-chain activity continues to grow, Solana's stablecoin ecosystem is also expected to expand in tandem.
In Q2, the entire stablecoin market shrank by about 1.3%, while the stablecoin supply on Solana actually grew by approximately 3%, adding about $300 million.
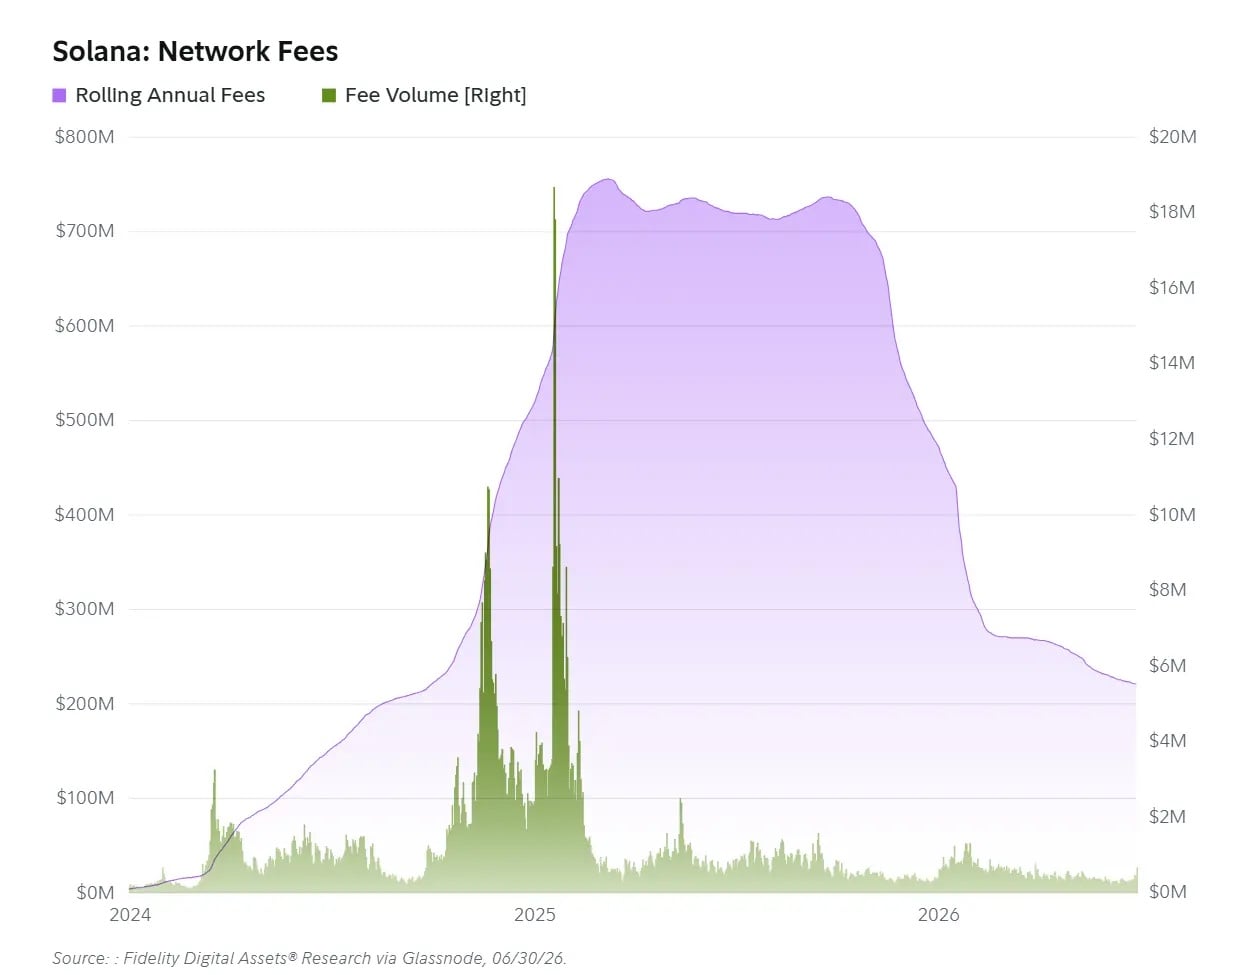
Figure: Total Stablecoin Transfer Volume on Solana
Network Fees: Neutral
Solana's network fees remain on a downward trend, but signs of gradually finding a balance level have started to appear.
In Q2, rolling 12-month network fees fell by 18% to $22.1 million, with daily fee revenues of around $390,000.
If the Q2 network fees are annualized, the annual income would be about $141 million, significantly narrowing the gap with the rolling 12-month data.
At the same time, Solana's on-chain activities continue to grow, and various Solana Improvement Proposals (SIMD) are beginning to place more emphasis on enhancing SOL holders' value capture capabilities.
These advancements further reinforce Solana's positioning as a technology platform capable of generating protocol revenue, with SOL at its economic core.
According to Fidelity's assessment, Solana's network fee revenues might be nearing a cyclical bottom.
If on-chain activity continues to grow, and proposals related to value capture are gradually implemented, Solana's fee revenue is expected to start recovering over the next year.
Appendix: Indicator Method Explanation
Momentum Signal
The momentum signal assesses the current momentum state of digital assets through a comprehensive evaluation of price trends and volatility changes.
On one hand, the model compares short-term price variations with long-term trends; on the other hand, it evaluates whether current volatility is expanding or contracting relative to recent benchmarks.
These two dimensions are integrated into a momentum classification to identify phases where price direction and volatility are in sync, diverging, or transitioning.
The model's look-back window and other parameters are selected through an optimization process aimed at creating a relatively clear and stable distinction among different market conditions.
However, this indicator is solely used to describe the current market state and does not constitute price predictions, investment advice, or trading signals.
Yardstick
The Bitcoin Yardstick, also known as the "Hash Rate Yardstick," can be understood as an approximate price-to-earnings ratio indicator for the Bitcoin network.
Traditional price-to-earnings ratios are calculated by dividing stock prices or a company's market value by its earnings, while the Yardstick uses BTC's total market value divided by the overall hash rate to measure BTC's valuation relative to network security investments.
A lower ratio means BTC is cheaper relative to the hash rate required to protect the network, analogous to how a lower price-to-earnings ratio is generally interpreted as a low stock valuation.
However, hash rate is not equivalent to corporate earnings, so the Yardstick can only serve as a relative valuation framework and cannot be directly equated with stock price-to-earnings ratios.
NUPL
On one-year and three-year time scales, the relationship between NUPL and future returns is one of the stronger on-chain indicator relationships found in Fidelity's research.
However, Ethereum and Solana’s network histories are significantly shorter than Bitcoin's, leading to fewer available observations, thus the reliability of historical relationships is also relatively low.
Theoretically, when a network's realized market cap exceeds twice the total market cap, NUPL could drop below -1.0.
During the early phases of BTC, ETH, and SOL, a large amount of asset supply was moved or allocated in the absence of public market prices.
For instance, some early BTC tokens were transferred before market prices were established; ETH and SOL involved early token sales, pre-sales, pre-mining, seed funding, and foundation distributions, etc.
These early allocations can affect realized prices and might sometimes be recorded at costs exceeding subsequent public market prices.
When market prices fall below realized prices, the cumulative unrealized losses across the entire network may exceed the current total market value, pushing NUPL below -1.0.
As networks mature and on-chain transaction histories accumulate, realized market cap will increasingly reflect actual market transactions rather than early distribution events.
Therefore, NUPL's reference value generally increases as the network matures.
免责声明:本文章仅代表作者个人观点,不代表本平台的立场和观点。本文章仅供信息分享,不构成对任何人的任何投资建议。用户与作者之间的任何争议,与本平台无关。如网页中刊载的文章或图片涉及侵权,请提供相关的权利证明和身份证明发送邮件到support@aicoin.com,本平台相关工作人员将会进行核查。


