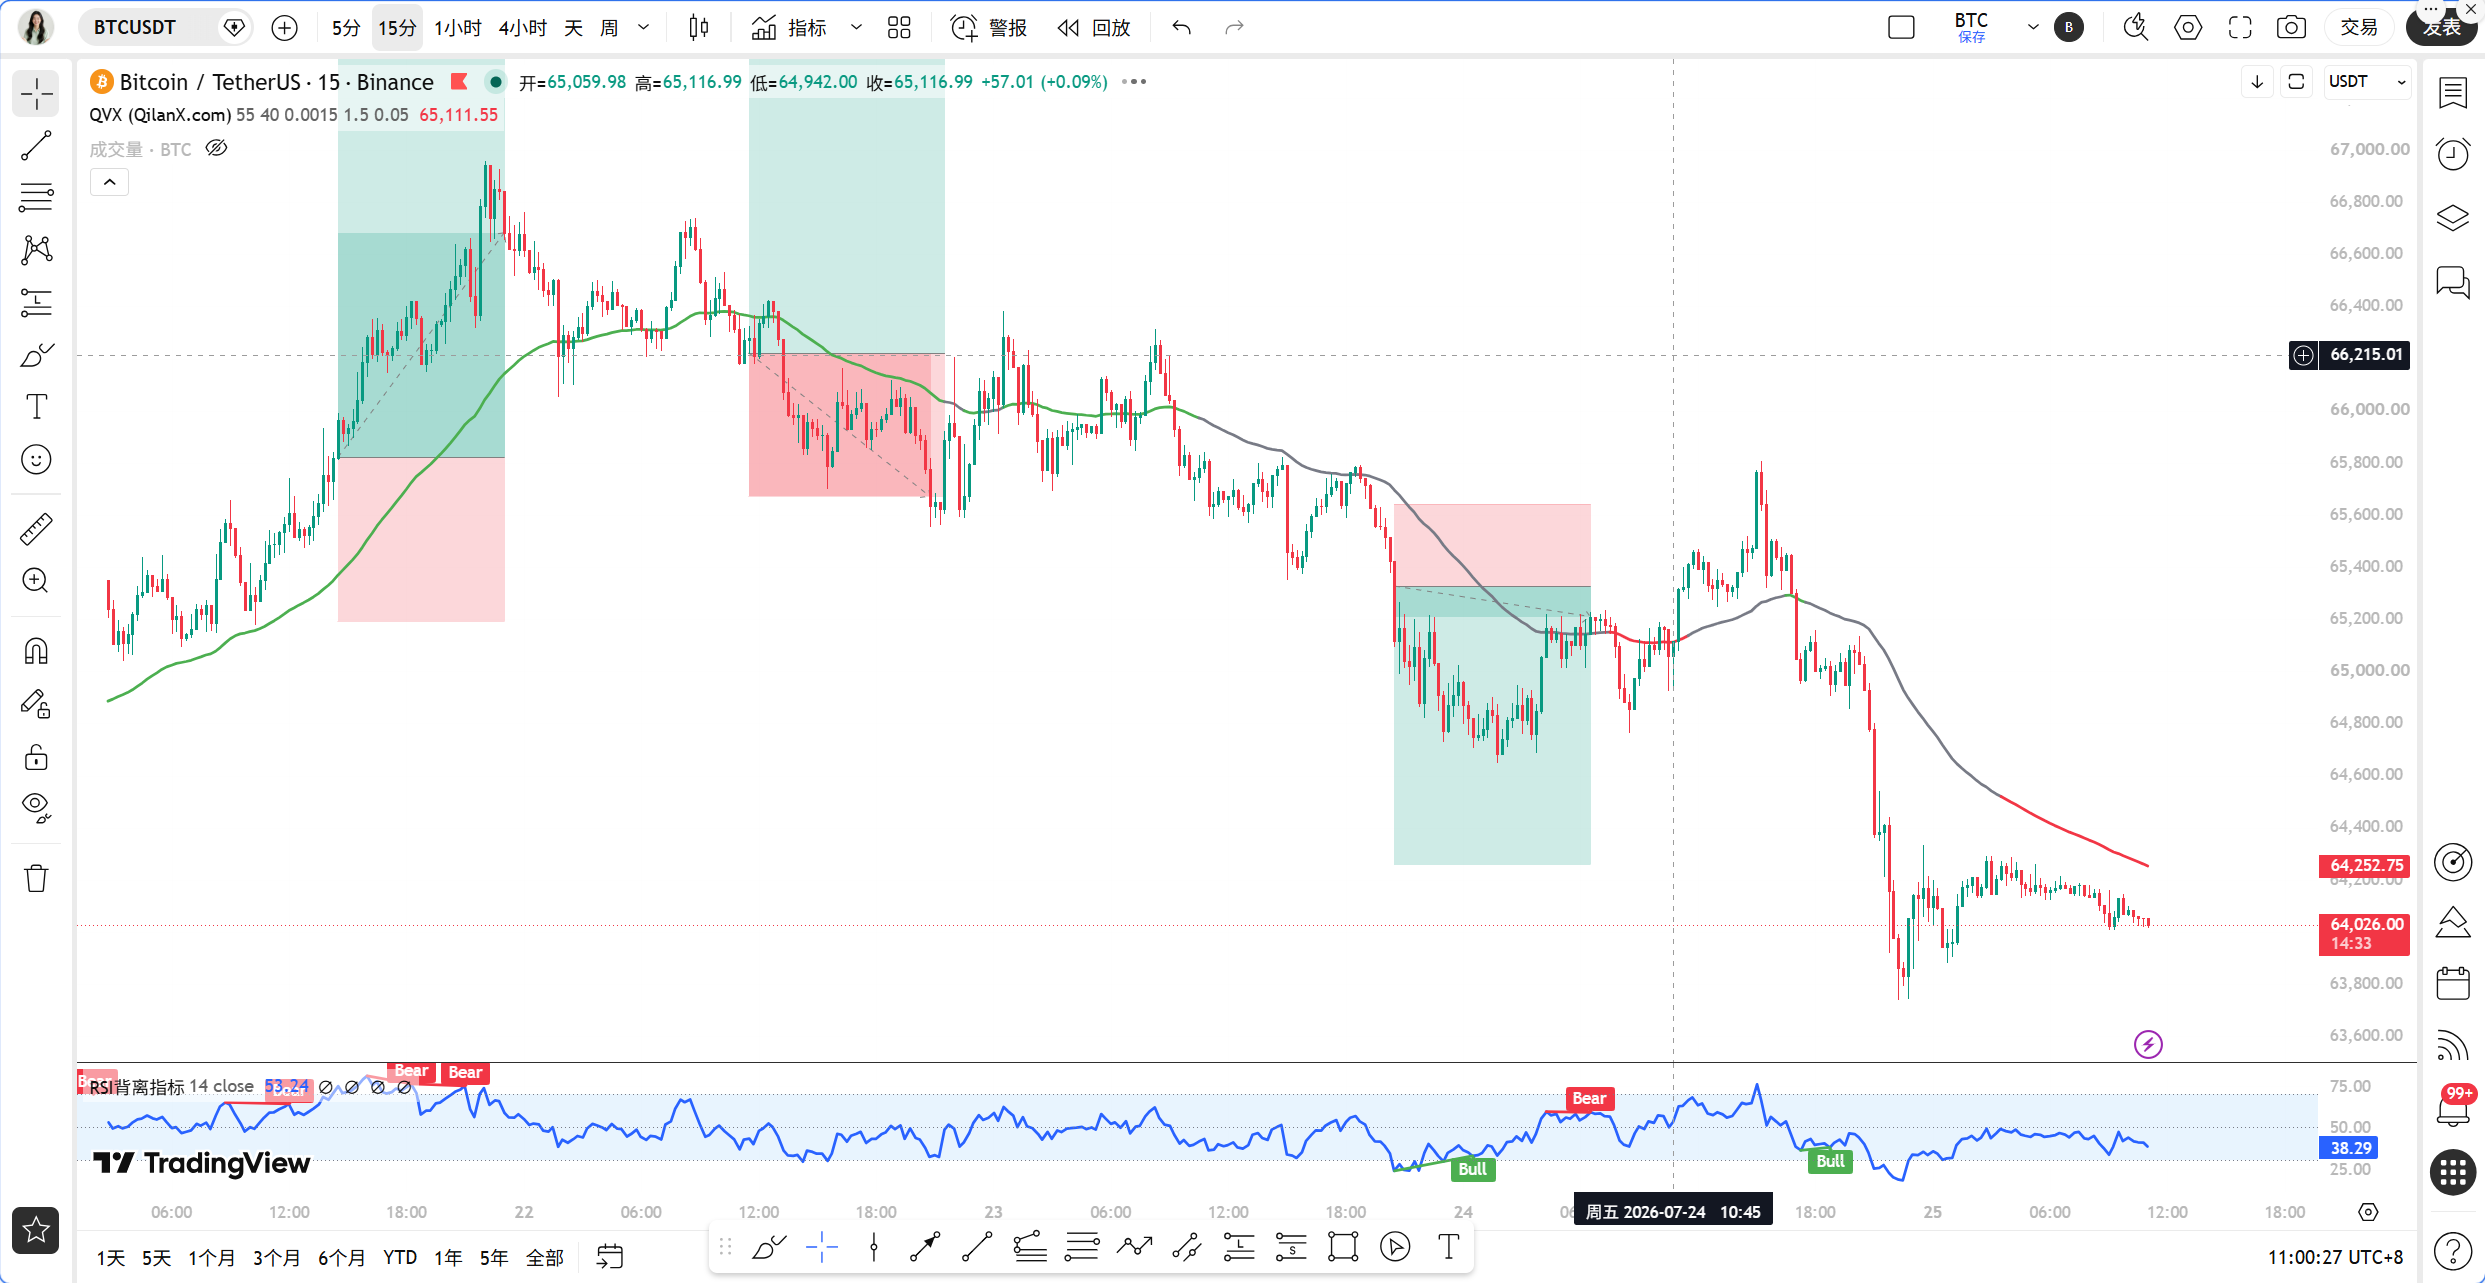
Dear teammates, this morning a regulatory news has caused a stir: Futu Niuniu, as the first licensed broker in Hong Kong, officially launched BNB real-time trading. This means that the channels for compliant funds entering the crypto market have widened a step, and the BNB ecosystem directly benefits, indirectly boosting market sentiment. On the other hand, the listed company KULR Technology sold 333 bitcoins to pay off debts, leading to short-term selling pressure, causing bitcoin to fall directly below the $64,000 mark, triggering a liquidation of $117 million in one hour. On one side is the long-term positive impact of compliance, while on the other side is real cash flow selling pressure, leading to fluctuating market sentiment. Qinglan wants to remind everyone: news can only impact short-term fluctuations; the real direction should still be based on technical structure. Today, we will use the Qinglan TPV system to clarify the truth of the long and short game near the $64,000 mark.
Current price and time
Current time: July 25, 11:22
Bitcoin price: 64070 USDT
24-hour decline: 1.99%
Fear and Greed Index: 27 (Fear)
After a sharp drop to around 63600 in the morning, the price rebounded slightly, but it is still struggling below the $64,000 round number. This position is a psychological support from earlier and a key technical pullback area. However, note that the fear index of 27 is nearing the extreme fear zone; historical data often shows that extreme fear tends to trigger a short-term bottom. However, Qinglan repeatedly emphasizes: emotional indicators cannot be used solely as an entry basis; they must be combined with trends and structures.
Multi-cycle state overview (daily, 4h, 1h, 15m)
First, look at the daily chart: MA5=65195, MA10=64855, MA30=63164. The current price is 64070, breaking below MA5 and MA10, but still above MA30. MACD column is 64.75, bullish momentum is still present but diminishing. RSI=51.16, neutral and slightly weak. The daily level is a pullback after high-level fluctuations and has not broken the mid-term trend line.
On the 4-hour level: MA5=64322, MA10=64747, MA30=65444. The price is located below all moving averages, MACD column is -214.14, bearish momentum continues to expand, RSI=27.01, entering the oversold area. This indicates concentrated release of bearish energy, but overselling often implies that rebound demand is accumulating.
On the 1-hour level: EMA55=64904, current price 64070, about 1.29% below EMA55. MA5 and MA10 are entwined around 64053 and 64063, with MA30=64129 creating short-term pressure. MACD column is 10.21, DIF=-276, DEA=-286; although the column turns positive, the value is very small, representing a minor rebound after a decline, the strength is questionable. RSI=45, neutral, not oversold.
On the 15-minute level: MA5 and MA10 are entwined, MA30=64129 is slightly higher. MACD golden cross, column value is 0.62, RSI=41.7. A short-term rebound is occurring, but the volume is insufficient.
In summary: The daily chart has not broken the mid-term moving averages, but the 4-hour and 1-hour charts are in bearish control. The overall pattern is "large cycle oscillation, small cycle bearish." It is important to closely observe whether effective pressure can form near the 1-hour EMA55.
TPV signal verification (EMA55 conditions, shape, momentum)
According to Qinglan TPV system rules: current price 64070 < 1-hour EMA55=64904, meeting bearish trend conditions. Further verification of short selling conditions:
1) Price under pressure below 1H EMA55: In the past 8 1-hour candlesticks, the number of closing prices greater than EMA55 is 0, crossing occurrences are also 0, fully meeting the condition of "two consecutive 1-hour candlesticks closing price < EMA55."
2) Pressure meets resistance: Although it has not yet touched EMA55, the rebound high point after the morning's sharp decline is around 64150, while EMA55 is 64904, significantly higher than the current level, so the pressure level is clear. In terms of shape, the 1-hour chart has formed a small-level horizontal consolidation in the 64000-64200 area, and there are no long lower shadows or bottom reversal signals, which indicates a weak rebound.
3) Rebound weakness: Although the 1-hour MACD column has turned positive, the absolute value is extremely small (10.21), and DIF and DEA are still in the deep negative value range, whether the column value can continue to expand is questionable. RSI=45, far from reaching the overbought zone above 70, also is not a signal of bearish exhaustion. More importantly, the 4-hour RSI=27.01 indicates that bigger cycle bearish momentum is still being released.
Oscillation supporting data: In the past 8 1-hour candlesticks, the number of closing prices greater than EMA55 is 0, crossing occurrences are also 0, and the price magnitude vs. EMA55 is 1.29% (greater than 0.3%), not belonging to oscillation conditions, should be treated according to unilateral trends. Therefore, it currently meets short selling conditions, but note: this is not to chase shorts, rather to wait for a rebound to meet pressure followed by a secondary short signal.
On-chain / Fund aspect
Fear and Greed Index 27, has entered the "Fear" zone. Historical statistics show that the probability of a short-term rebound is quite high when this index falls below 30, but the mid-term direction needs to be combined with the structure. BTC market share is 56.51%, indicating funds are flowing from altcoins to bitcoin for hedging, but bitcoin itself is also declining, implying tight overall liquidity.
On-chain data aspect, there are no direct long-short ratios, open positions, etc., but the real selling pressure from a listed company selling bitcoins directly impacts. Additionally, the probability of the CLARITY Act passing has dropped to 30%, and regulatory uncertainty is suppressing institutional entry willingness. Geopolitical conflicts (the Hormuz Strait escort alliance) are also raising risk-averse sentiment, negatively impacting risk assets.
In summary: Fund aspects are bearish, sentiment is extremely pessimistic, with short-term oversold rebound demand, but mid-term pressure remains unresolved.
Key attack and defense position
First upper pressure: 1-hour EMA55=64904, which is also the bull-bear boundary line of TPV, only above it can we turn bullish. Secondly, 4-hour MA30=65444 and MA10=64747 form multiple resistances.
Lower support: the previous low near 63600 (the low point of the morning's sharp drop), and the daily MA30=63164. If it breaks below 63600, it will likely test the 63000-63200 area.
Key observation range: 64000-64200, which is the short-term oscillation center of the current price and also the resistance area for rebounds. If the rebound cannot stabilize above 64000, it will continue to probe for lower bottoms.
Trading thoughts (direction, entry conditions, stop loss, target position)
The current Qinglan TPV system indicates a bearish trend, but the price has dropped sharply, so it is not advisable to directly chase shorts. Wait for a rebound to the resistance level to appear a secondary short signal before entering.
Direction: Short
Entry conditions: Wait for the price to rebound near the 1-hour EMA55 (64900-65000), then observe whether the 1-hour candlestick shows a long upper shadow, top reversal pattern, or an engulfing pattern, while the MACD column falls from a high position (at least two consecutive cycles shorten), or RSI falls from above 70. Once the conditions are met, enter in batches.
If the price does not rebound that high but breaks below 63600 first, observe whether effective support can form at that position. If it breaks down with volume and cannot recover, you can lightly chase shorts, targeting around 63164.
Stop loss: If entering a short, set the stop loss above the previous high of 65500 (the latest 1-hour rebound high is around 65000, plus a buffer). Or reference 1% above EMA55, which is 65500.
Target position: First target is the previous low of 63600, second target is 63164 (daily MA30), third target is 62000 (if macro negatives continue to ferment). Pay attention to taking profits in batches.
Additionally, if the price rebounds directly and stabilizes above the 1-hour EMA55 (two consecutive candlesticks closing price greater than 64904), the short conditions become invalid, and you should close shorts and observe, or even consider light long attempts targeting around 65400. But this scenario has relatively low probability.
Risk reminder
This strategy is based on current data and TPV system rules. The market has risks of sudden news or extreme volatility, so please strictly control positions and manage risks.
Follow Qinglan Crypto Classroom to seize more trading opportunities! Welcome to visit the official website www.qinglan.org
📊 Qinglan TPV trading strategy backtest reference
🕒 Last backtest time 07-25 07:00:01
Total analysis: 3190 Backtest: 2407 Accuracy rate: 77.1% (1857/2407)
免责声明:本文章仅代表作者个人观点,不代表本平台的立场和观点。本文章仅供信息分享,不构成对任何人的任何投资建议。用户与作者之间的任何争议,与本平台无关。如网页中刊载的文章或图片涉及侵权,请提供相关的权利证明和身份证明发送邮件到support@aicoin.com,本平台相关工作人员将会进行核查。


