Dear teammates, I am Sister Qinglan. This morning, I opened the market and saw the news that Tesla plummeted 14%, which made my heart sink. Last night, U.S. tech stocks were dragged down by Tesla's performance, with AI investments becoming a profit black hole, causing the stock price to directly crash by 14%. This isn't over yet; the probability of the Federal Reserve raising interest rates next week has risen to nearly 40%, with the triple pressure of oil prices, U.S. Treasury yields, and the dollar coming down hard. Over in the crypto market, BitMEX announced its closure in September, the platform token plummeted by 95%, marking the end of a once-great player and worsening market sentiment. However, on the other hand, Zhizhi Technology plans to swap $220 million for 3,500 bitcoins, and institutions are still making large purchases. With bullish and bearish factors intertwined, BTC is currently struggling around 65,000. How should we view this?
Current Price and Time
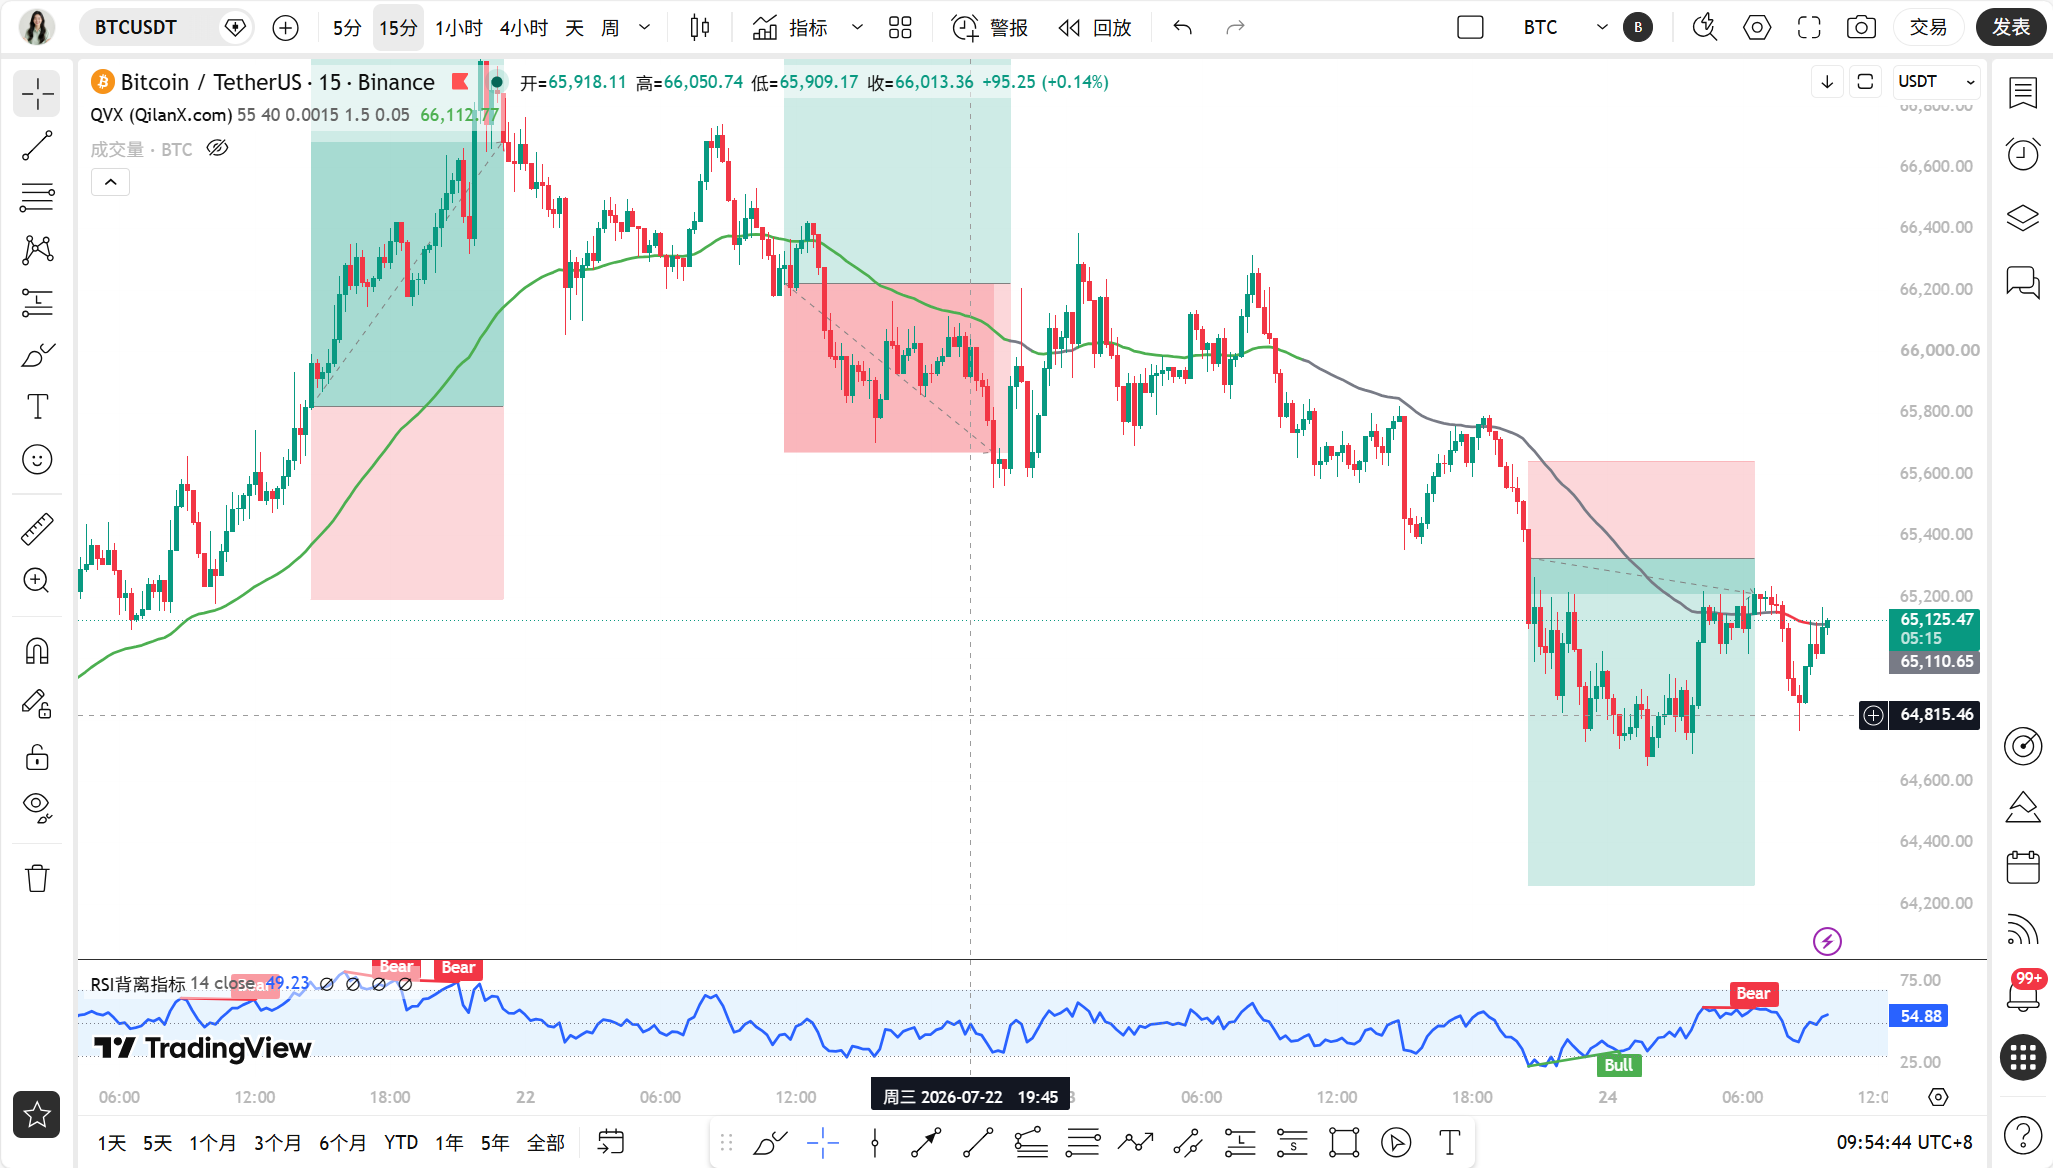
The current time is July 24th at 09:55 Beijing time, with BTC quoted at 65,089 USDT. The 24-hour drop is 1.06%, and the fear and greed index is only 28, indicating that the market is in a state of fear. This position is crucial; 65,000 is a psychological barrier and also an important technical support level.
Multi-Period Status Overview
First, looking at the daily chart, MA5 is at 65,622, MA10 is at 65,018, MA30 is at 63,053, and the moving average system is still in a bullish arrangement. MACD bar is at 228.66, with DIF above DEA, indicating a bullish trend on the daily chart. RSI is at 54.56, neutral to strong, indicating no overheating. The daily chart structure is not broken, but there is considerable short-term pressure.
On the 4-hour level, MA5 is at 65,109, MA10 is at 65,473, MA30 is at 65,455, and the short-term moving averages have started to turn downwards. MACD bar is at -181.49, with bearish momentum still being released. RSI is at 28.12, entering the oversold zone, suggesting a rapid decline with a demand for a rebound, but the trend is bearish.
On the 1-hour level, MA5 is at 65,105, MA10 is at 64,982, MA30 is at 65,411, and the price is operating below the moving averages. EMA55 is at 65,512, which is our dividing line between bulls and bears. The MACD bar is at 33.81, although still negative, it has started to shorten, with DIF and DEA below the zero axis, indicating a bearish trend. RSI is at 37.88, weak.
On the 15-minute level, MA5 is at 65,045, MA10 is at 65,017, MA30 is at 65,037, and the moving averages are converging. The MACD bar is at -3.13, and RSI is at 46.29, indicating a short-term fluctuation around 65,000 with no clear direction.
TPV Signal Verification
According to the Qinglan TPV system, the 1-hour EMA55 is at 65,512, and the current price is 65,089, which is below EMA55, indicating a bearish trend area.
Conditions for Shorting Verification: First, the price is under pressure below the 1H EMA55, with the closing prices of the past 8 one-hour candlesticks all below EMA55, meeting the conditions. Second, there is an obstructed pattern, with long upper shadows on the 4-hour level, pulling back after reaching around 65,400. Third, the rebound is weak; although the 4-hour MACD bar is shortening, the 1-hour MACD bar is still in the negative zone, with RSI rising from 37 but with weak strength. All three conditions are basically met, indicating a valid bearish signal.
An auxiliary data analysis for the oscillation judgment shows that in the past 8 one-hour candlestick closing prices, the instances greater than EMA55 are 0, and the crossing instances are 0. The current price is 0.65% away from EMA55, not meeting the oscillation threshold, and is in a one-sided bearish trend.
On-Chain Capital Flow
The fear and greed index is 28, indicating extreme fear in the market, which often corresponds to a stage bottom area. BTC's market share is 56.74%, still at a high level, indicating that funds are taking refuge in BTC, while altcoins are under pressure. Zhizhi Technology plans to buy 3,500 BTC, and institutional funds are accumulating at low levels, which is a positive signal. However, the UK's tax authority is pursuing crypto tax evasion, and South Korea is tightening leverage ETF regulations, maintaining regulatory pressure. Overall, on-chain data is biased to bearishness, but the fear index suggests a possible approach to a short-term bottom.
Key Attack and Defense Positions
The first resistance level above is at EMA55 of 65,512, which is the dividing line between bulls and bears. It can only turn bullish after breaking above this level. The second resistance level is at MA30 of 65,455 on the 4-hour chart, forming a resonating pressure zone with 65,512. The first support level below is at the round number of 65,000, the second support at MA10 of 65,018, and the third support around the recent low of 64,500. If 65,000 is broken, it may accelerate the decline to the 64,000-64,500 area.
Trading Strategy
The current 1-hour bearish trend is clear, but the 4-hour RSI is oversold and the daily bullish structure is still in place, which is a conflicting state of a favoring a bullish big cycle and a bearish small cycle. Sister Qinglan suggests primarily adopting a short-term bearish strategy, but with light positions due to strong support below.
Direction: Bearish in the short term, but do not chase the short; wait for a rebound to resistance levels before shorting.
Entry Conditions: Wait for the price to rebound to the 65,400-65,500 area, showing a long upper shadow or top pattern on the 1-hour level, while the MACD bar begins to shorten and RSI falls back from around 40, entering after meeting the short conditions.
Stop Loss: Set above 65,800; if it breaks and stabilizes above EMA55, the bearish logic becomes invalid.
Target Levels: First target 65,000, second target 64,500, third target 64,000. If 65,000 is quickly broken, you can hold and look towards 64,500.
If the price directly breaks below 65,000, it is not recommended to chase shorts; wait for a rebound to confirm resistance before entering. If a long lower shadow or bottom pattern is formed around 65,000, while the 1-hour MACD bar begins to shorten and RSI rebounds from the oversold zone, you can consider lightly entering long, with a stop loss at 64,800 and a target of 65,500.
Risk Warning
Current macro risks are escalating, expectations of Federal Reserve interest rate hikes are rising, and the sharp drop in tech stocks could trigger a chain reaction; short-term volatility may increase, so be cautious in controlling your position.
Follow Qinglan's Crypto Classroom to seize more trading opportunities! You are welcome to visit the official website www.qinglan.org
📊 Qinglan TPV Trading Strategy Backtest Reference
🕒 Last Backtest Time 07-24 07:00:02
Total Analysis: 3167 Backtests: 2387 Accuracy: 77% (1837/2387)
免责声明:本文章仅代表作者个人观点,不代表本平台的立场和观点。本文章仅供信息分享,不构成对任何人的任何投资建议。用户与作者之间的任何争议,与本平台无关。如网页中刊载的文章或图片涉及侵权,请提供相关的权利证明和身份证明发送邮件到support@aicoin.com,本平台相关工作人员将会进行核查。


