Macro buffers + on-chain support convergence, Bitcoin's bear market rebound enters a decisive moment.
Written by: Glassnode
Translated by: AididiaoJP, Foresight News
Abstract
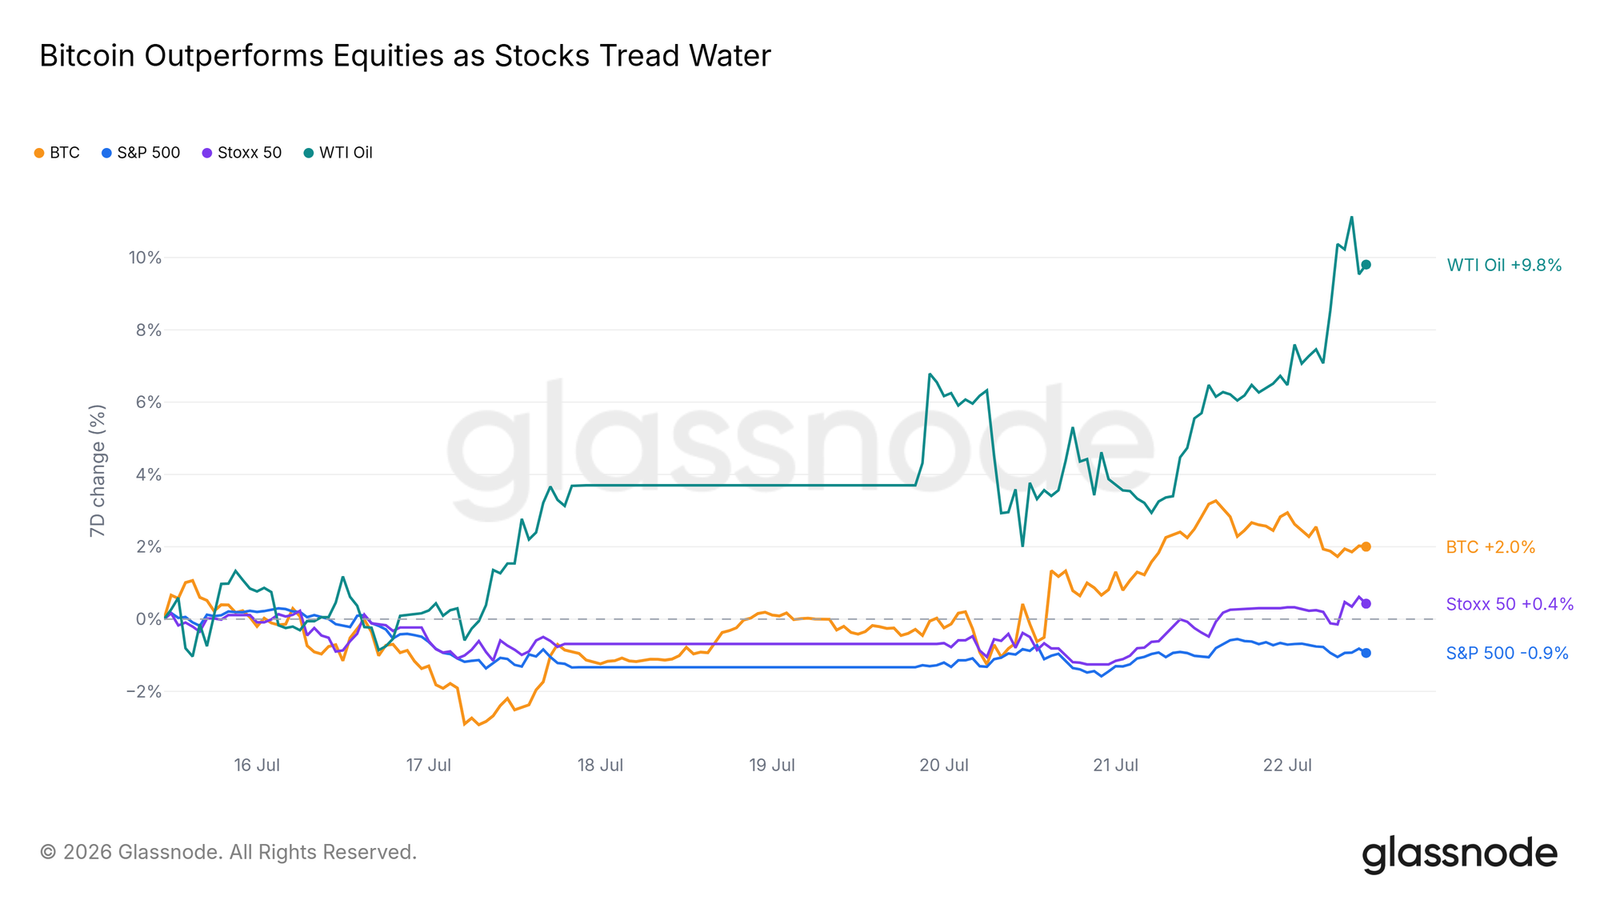
- The escalation of the situation in Iran has triggered a surge in oil prices, with stock market performance being lackluster or declining; Bitcoin, however, absorbed this shock and outperformed the two major stock indices for the second consecutive week.
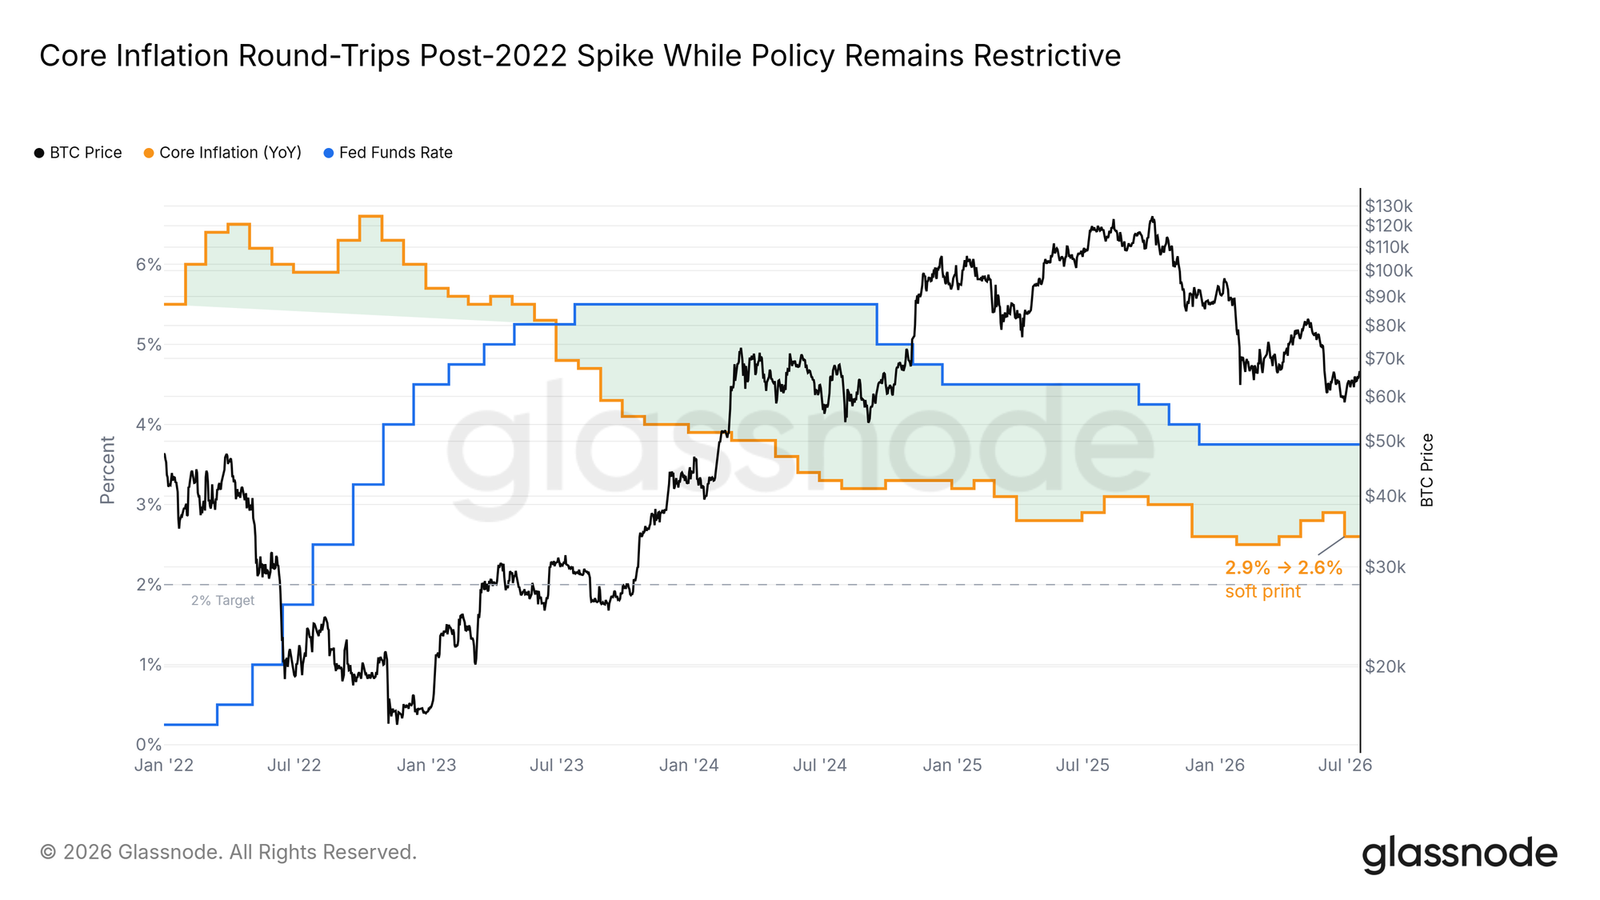
- For the first time in five months, core inflation data has shown a decline, just one week before the FOMC meeting, while the policy interest rate remains above inflation, maintaining its restrictive stance.
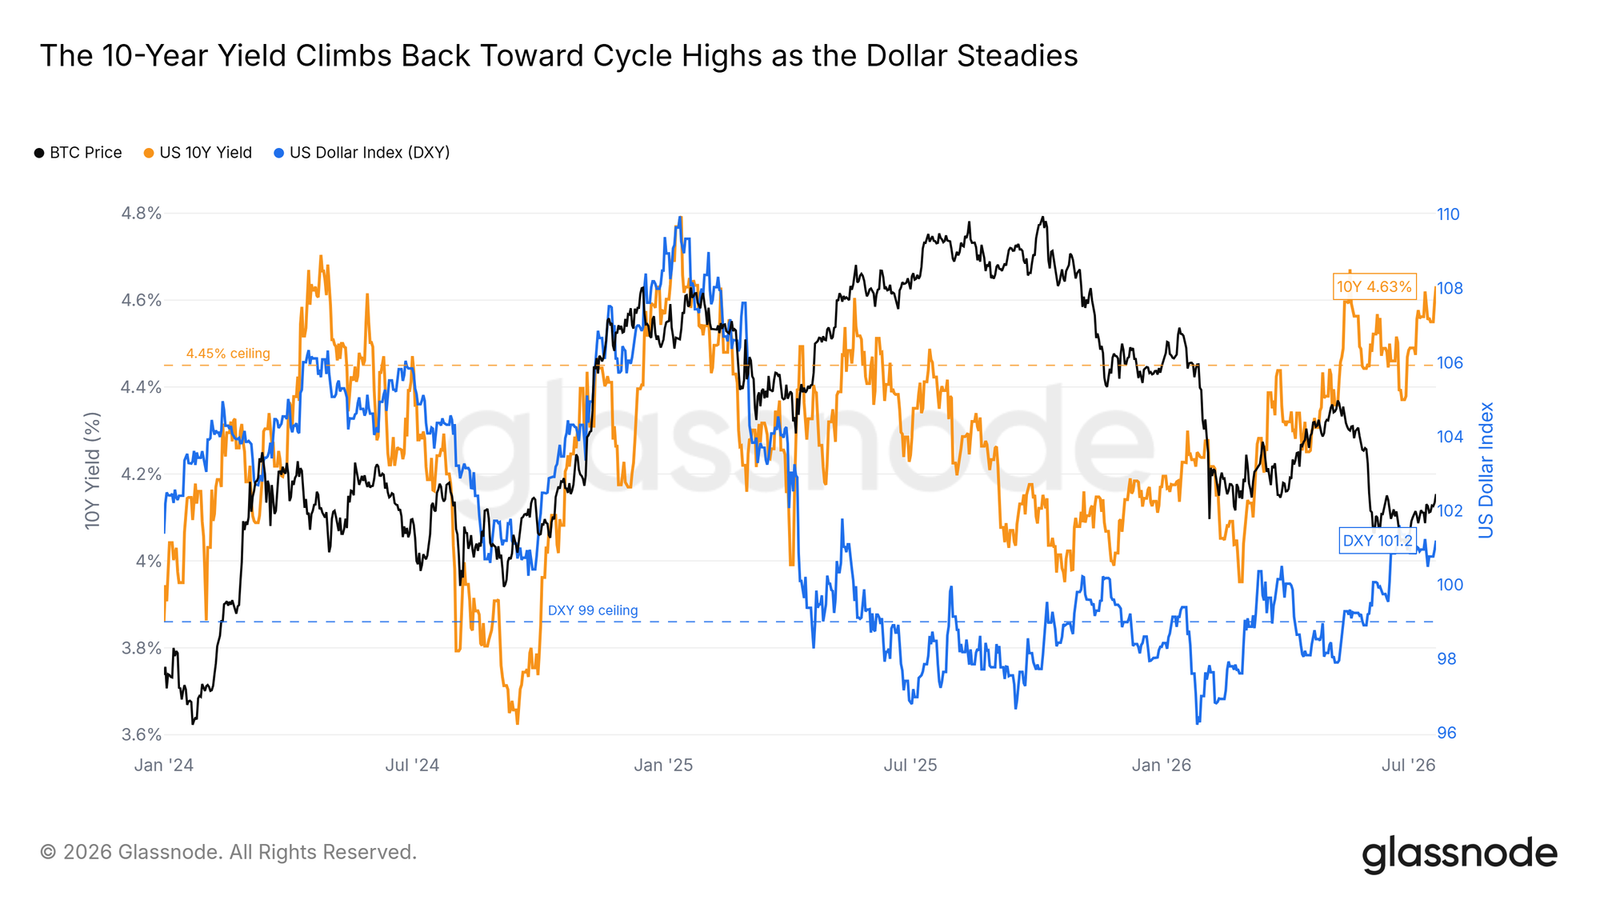
- The yield on 10-year U.S. Treasury bonds has returned to high territory, while the dollar remains relatively stable; the 'ceiling' formed by yields and the dollar has not yet been lifted.
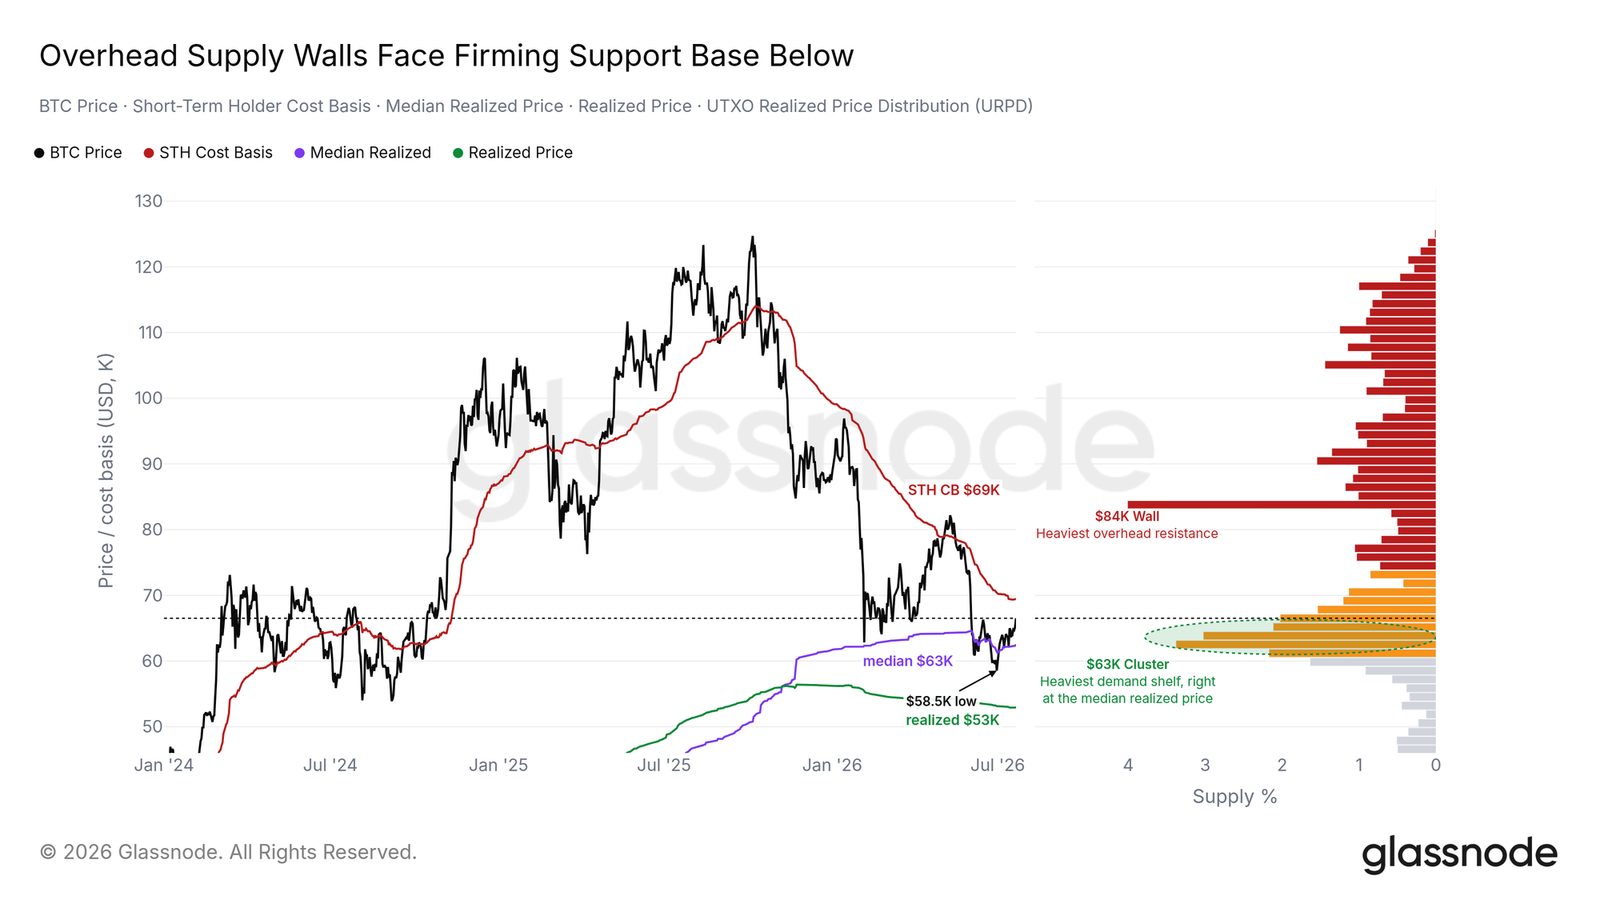
- Prices have entered a decision-making range: the upper level is around $69,000, which is the cost basis for short-term holders, while the lower end is the heaviest demand support zone in the market.
- Near-price supply is tilting towards support, with net inflows to exchanges continuing to weaken, and the profit-taking pressure needed to hinder the rebound has not yet accumulated.
- Accumulation behavior has narrowed to high-confidence groups holding 1,000-10,000 BTC, while breadth remains a missing link on-chain.
- On the OTC side, the signals tracked by this report have finally manifested: ETF fund flows have turned positive, and prices have surged above the maximum pain point, with hedge positions dropping to several-month lows.
- Altcoins are weakening again compared to Bitcoin, with funds concentrating on the leading assets; market compass readings also show: in recovery, still within a low-risk preference range.
Macro Insights
Withstanding Oil Price Shocks
This week's macro test comes from the oil market. WTI crude oil has surged significantly due to the escalation of the situation in Iran, and such external shocks typically drag down all risk assets. However, the stock market's reaction has been tepid: the S&P 500 index closed lower for the week, while European stocks remained flat. Bitcoin continued to rise under the same shock, outperforming the two major stock indices for the second consecutive week. A market that can rise amid bad news indicates that marginal selling pressure is mostly exhausted—this resilience itself is a signal.
Inflation Finally Bends
Core inflation recorded its first decline in five months, achieving the closest reading to target levels since the peak in 2022. Although a single data point does not indicate a trend, the timing is quite fortuitous: by the time of the upcoming FOMC meeting next week, the federal funds rate will still be over 100 basis points above core inflation.
This gap reflects the restrictive policy and leaves room for action by the Federal Reserve. If a signal for rate cuts is issued, it will remove one of the macro brakes tracked throughout the year; if silence is maintained, the market will have to continue relying on crypto-native momentum to move forward.
Rising Yields, Dollar Consolidating
The bond market has not cooperated. The yield on 10-year U.S. Treasury bonds has returned to recent high points, continuing to pressure all risk assets; meanwhile, the dollar remains relatively mild, far below winter highs.
The current upward cycle ceiling is clearly visible: the yield is above 4.45% and the dollar index is above 99. The dollar side is close to breaking through, while the yield side is not yet. A simultaneous breakdown of both remains a key valve for macro release.
On-Chain Insights
Arriving at the Decision-Making Range
Since rebounding from the low at the end of June, the distribution of supply around Bitcoin's price has become the core narrative. The upper boundary is around $69,000, which is the cost basis for short-term holders—the breakeven point for buyers over the past five months; the lower boundary is the heaviest demand support zone on the chart, approximately 10% of total supply, concentrated around $63,000 (the last price at which the median coin changed hands). A further downward realization price floor is far below.
The asymmetry of the first wall is well known in the market: when approaching from below in a downtrend, the breakeven line of recent buyers often becomes a sell pressure area, as the holders most eager to sell are about to break even. Once breached, an 'air pocket' will form in the upper range until the $84,000 threshold. Successfully reclaiming that margin will mean thin resistance above, allowing for a quick revaluation; if it fails, the lower support zone will become the next testing ground.
Support Forces Converging to Test Zones
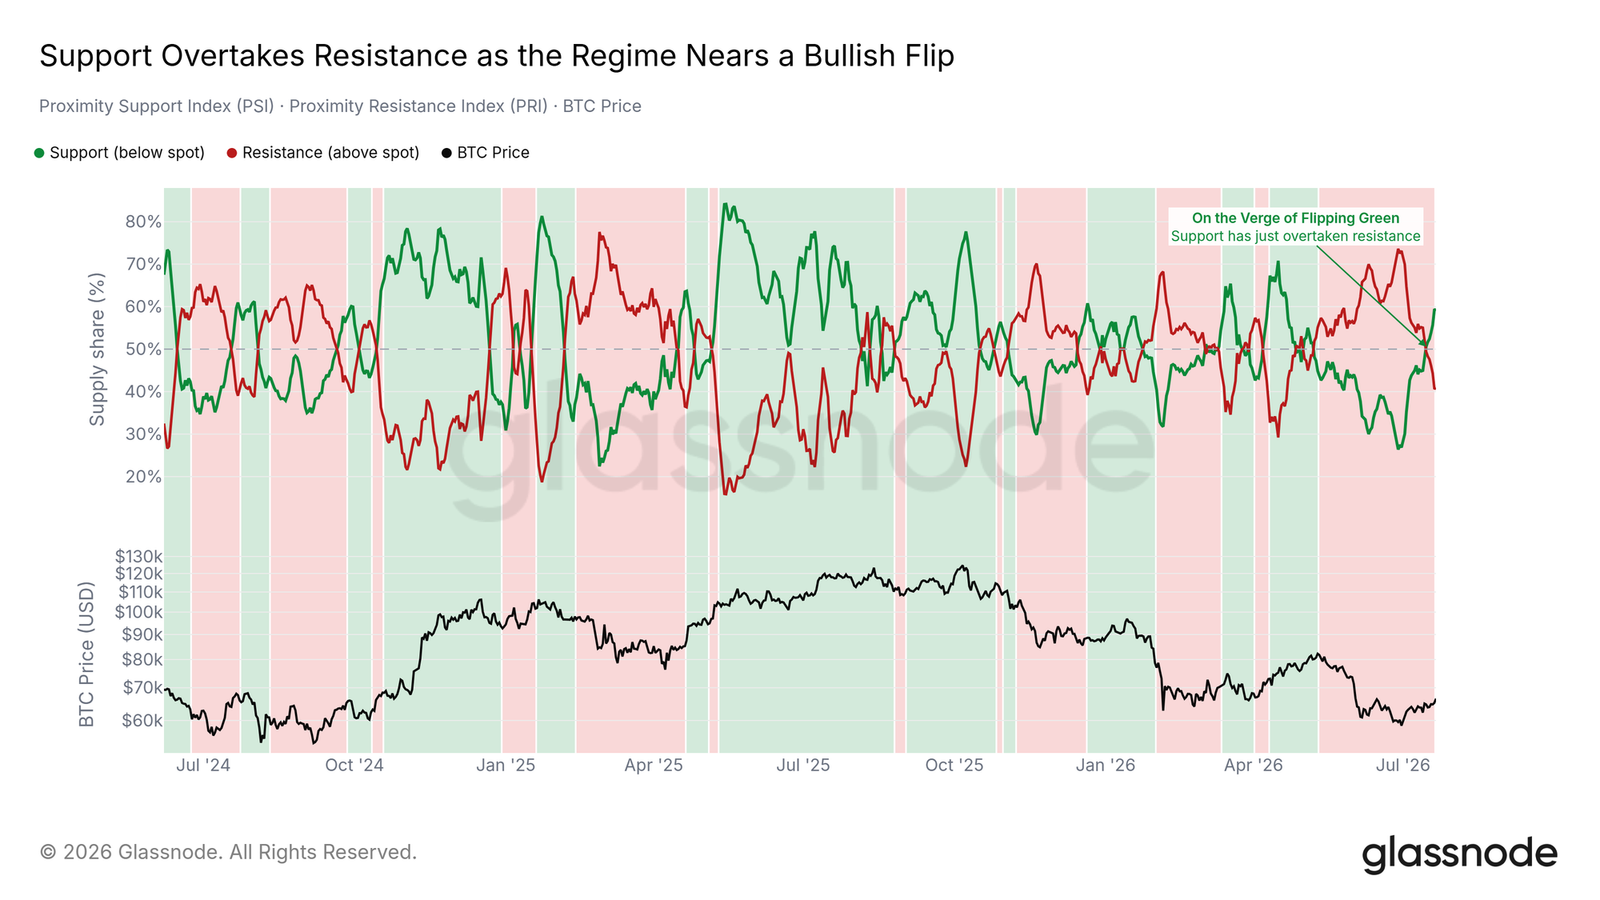
Supply near the price level is lining up. According to distance-weighted cost basis data, chips at near price levels are divided between support below the current price and resistance above it, with the share of support just exceeding that of resistance, suggesting a shift as the resistance-dominated pattern since spring is on the verge of flipping.
A rebound meeting resistance still requires selling pressure, and the fuel has not yet been filled. A classic trigger signal is when the profitability supply ratio of short-term holders breaks through 54%—enough recent buyers to break even can lead to significant sell-off. Currently, this indicator is far from reaching that mark, and the short-term holder SOPR remains near the breakeven line rather than flipping downwards. Recent buyers are neither enthusiastic nor exiting the market.
Selling Pressure Gradually Retreating
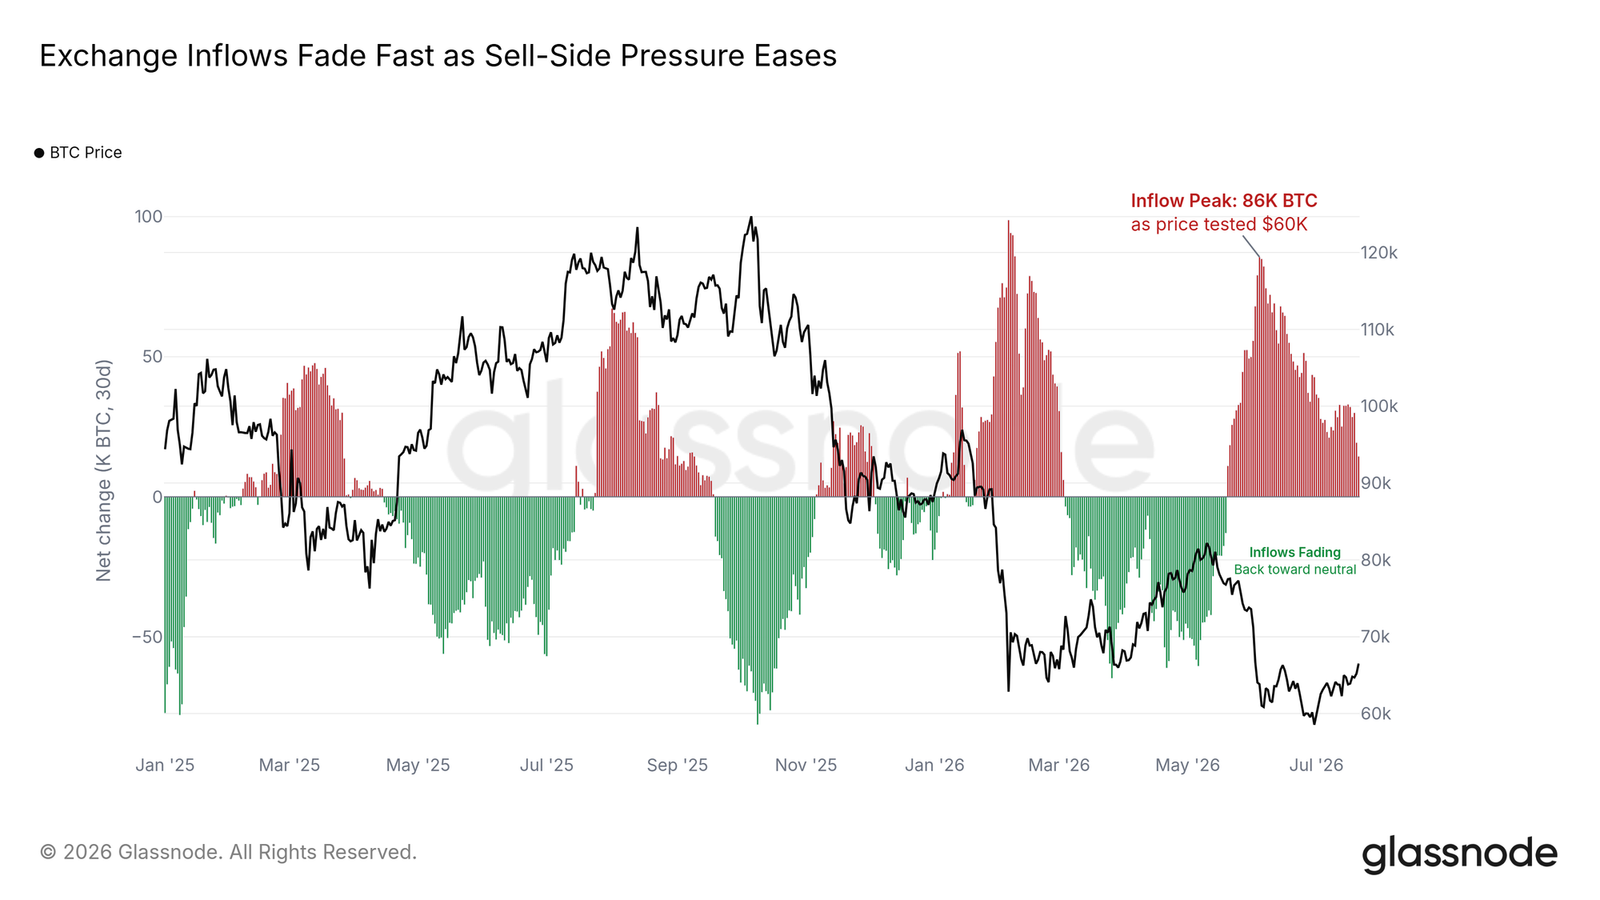
The exchange 'revolving door' has slowed down. When the market broke down at the beginning of June, there was a significant net inflow into exchanges—potential selling pressure reaching trading venues. This wave of inflow has continuously weakened over the past few weeks and is now only a fraction of its peak.
While inflows are decreasing, there has been no dominant outflow, indicating a neutral posture: demand is absorbing the volumes, but the structural divestment trend that should be present in a healthy market has not yet returned. A key confirmation signal to watch for is sustained net outflows—this is what the ETF channel has just begun to provide in terms of on-chain follow-up.
Belief Concentrated but Lacking Breadth
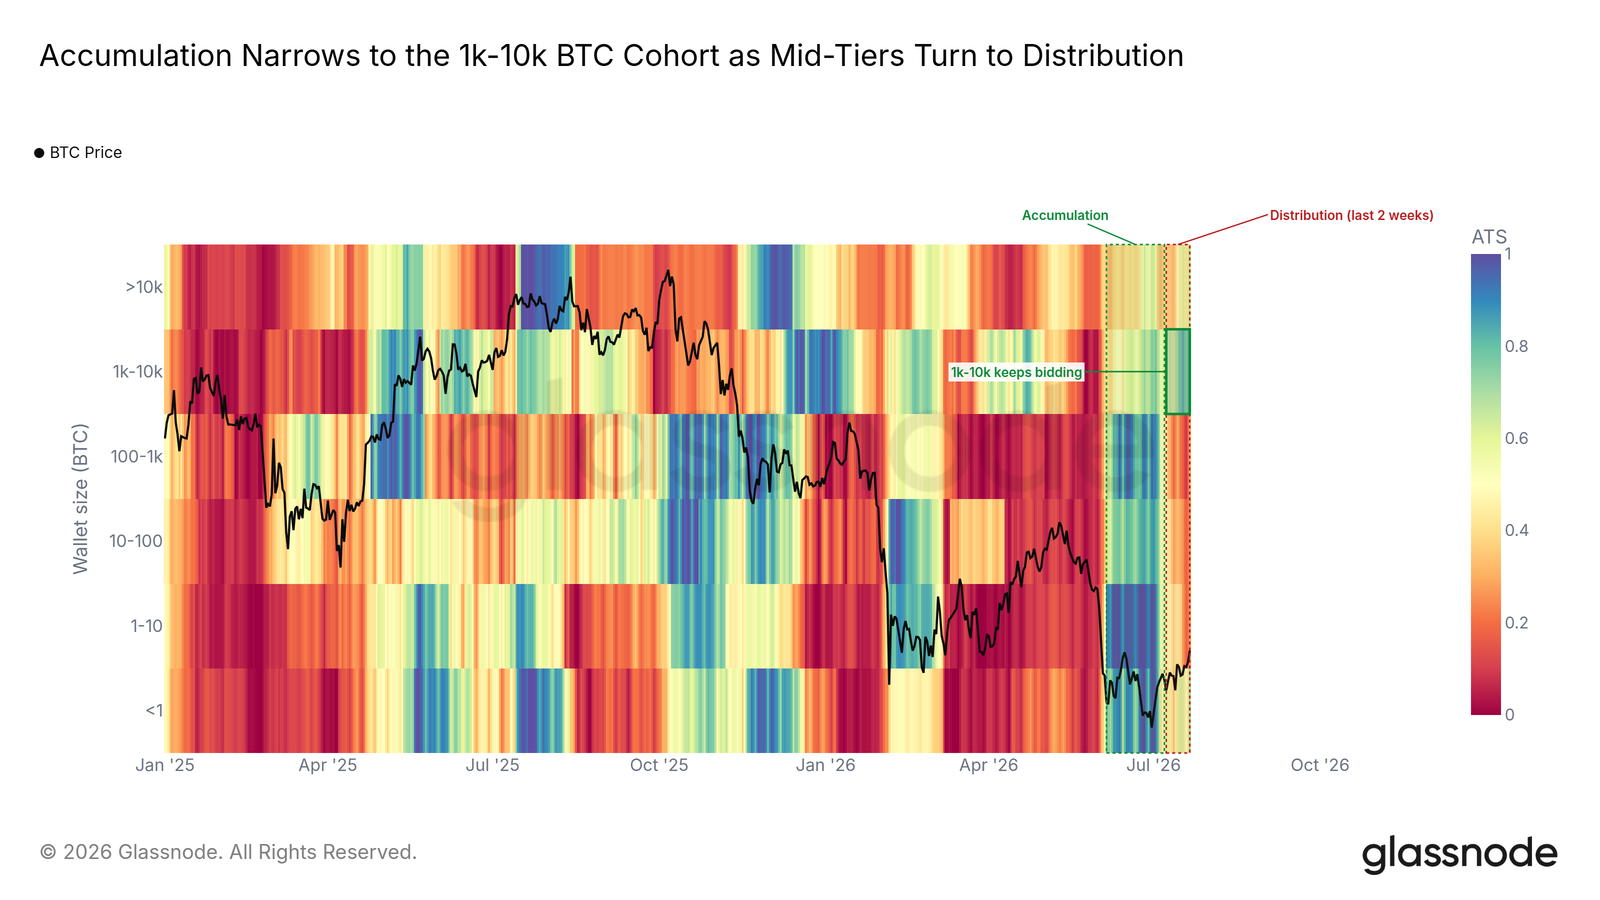
The rebound in June was driven by widespread accumulation: accumulation trend scores covered all wallet groups at the low point. The past two weeks have been different, with buying narrowing down to the 1,000-10,000 BTC range—historically, these wallets have often led to durable turning points, while mid-tier groups have reverted to distribution.
Concentrated accumulation has both advantages and disadvantages. The conviction of large, patient wallets has often led recoveries; however, a market structure supported by a single group is thinner than when all groups participate. The return of breadth in the next upward movement is key to distinguishing between short squeezes and trends.
Off-Chain Insights
Redemption Winning Streak Ends
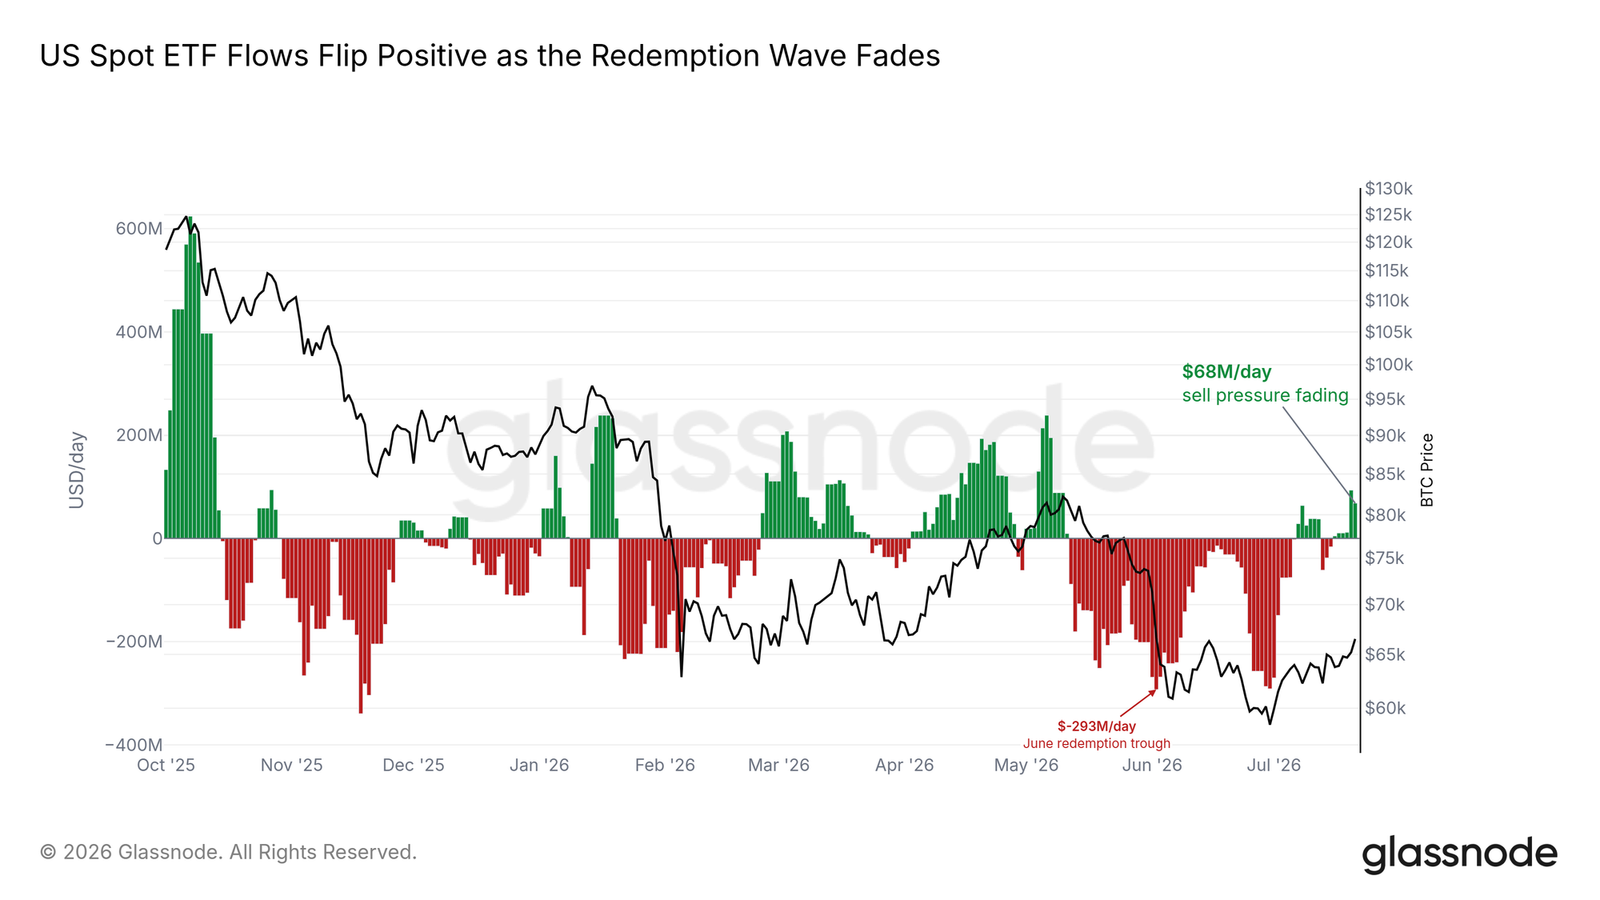
For several weeks, every improvement came with the same condition: optimistic derivatives, but the ETF channel continued to bleed. U.S. spot Bitcoin ETF fund flows have turned positive, marking the first sustained net buying following the redemption wave in June.
Last week's report noted that institutions had stopped fleeing but had not yet started buying. The reversal is still in its early stages and of moderate scale, yet it has transformed the purely derivatives-driven rebound into a rally supported by spot buying. Durability, not scale, is the focus to observe.
Standing Above the Maximum Pain Point
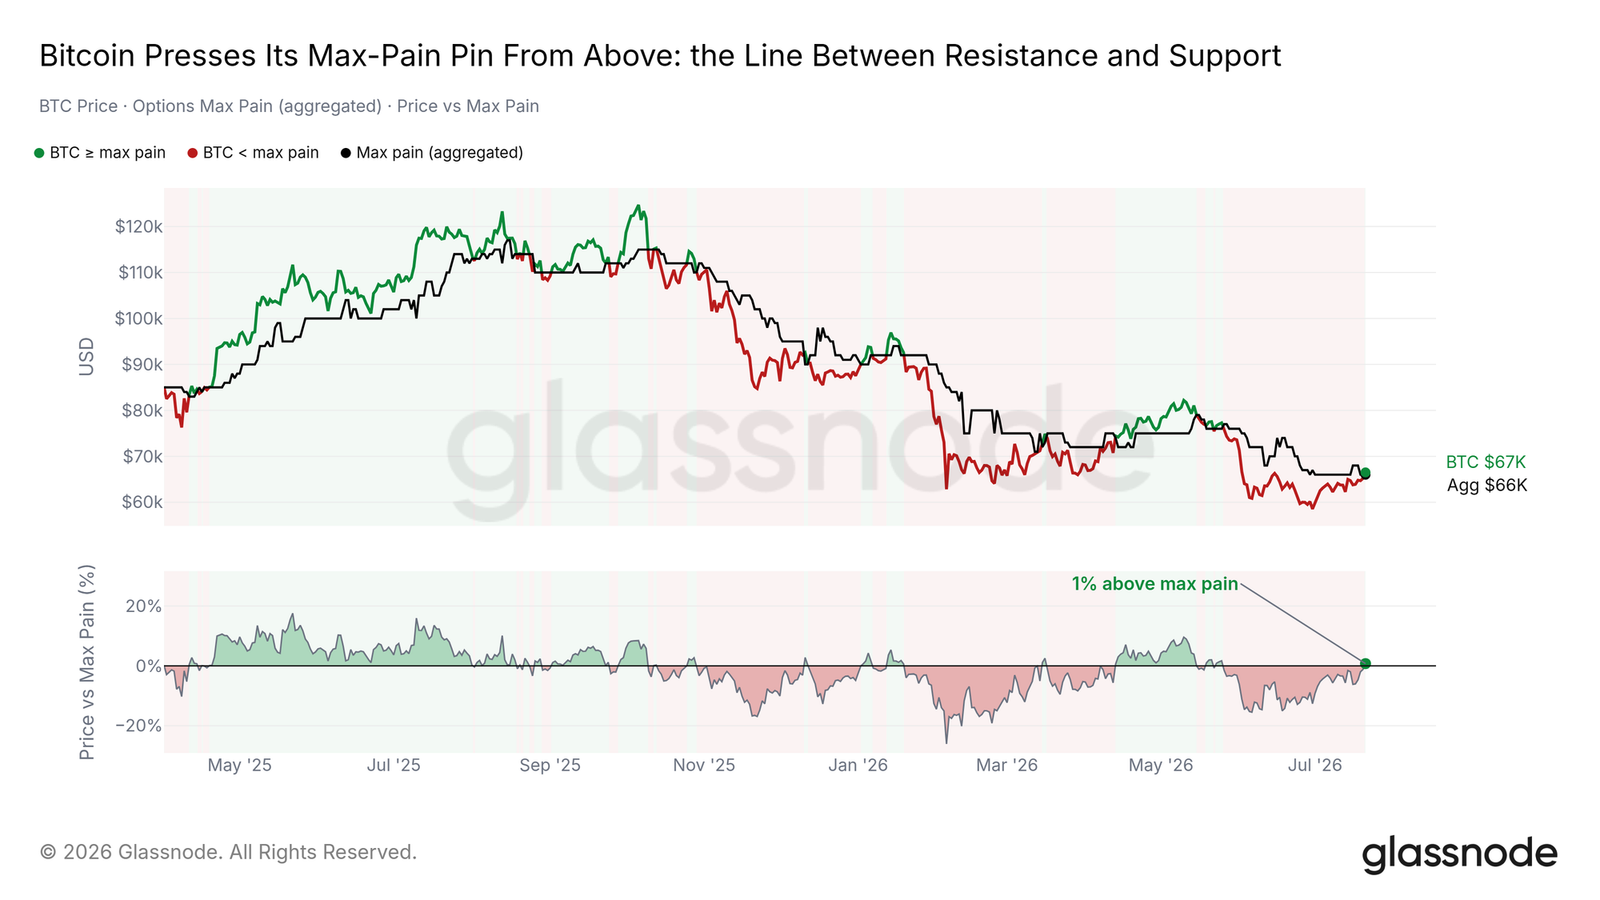
The maximum pain point—which is the price at which the most options positions expire worthless—has been acting as an upper resistance throughout spring. Last week, Bitcoin approached from below and has now risen above that aggregation level, far higher than its position when it hit the February low.
Historically, reclaiming the maximum pain point often accompanies a shift in the options market to a friendlier posture, although such transitions are usually gradual. If it holds above during the upcoming option expiration cycle, the hedging flows will act to dampen volatility rather than chase it, transforming the 'pain point' from a ceiling into an anchor point.
Hedging Unwound, Shorts Expire
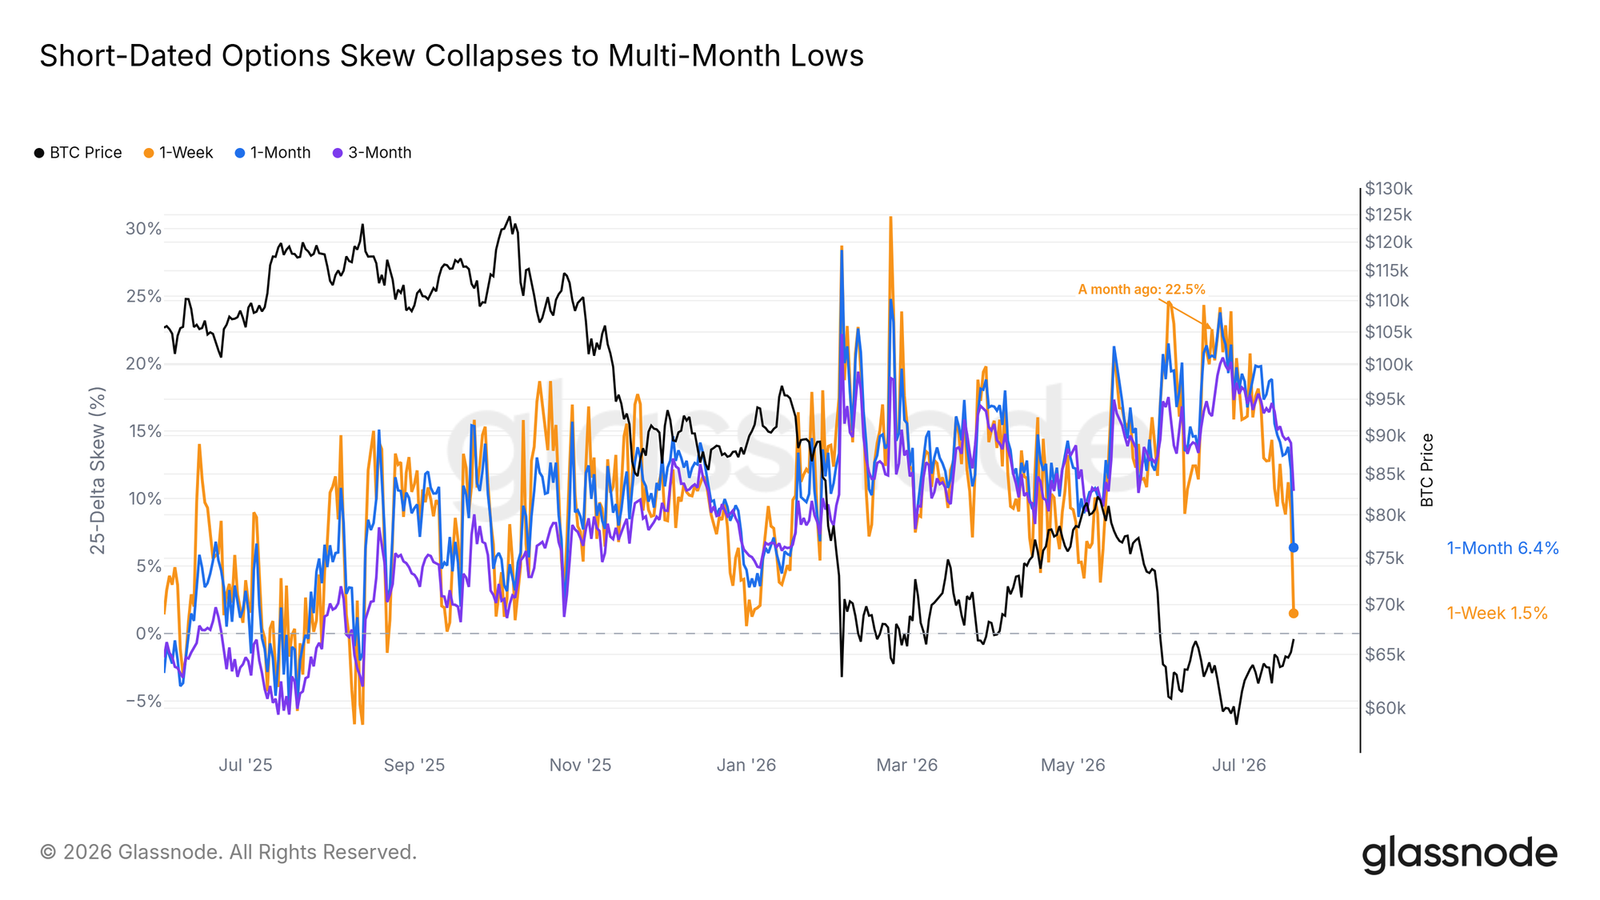
Since the June low, every report has tracked the same quiet process: traders are covering shorts and letting downside protection expire. The market has now loudly confirmed this. The one-week 25-Delta skew has plummeted to the lowest in months, with the fastest abandonment of downside protection on the front end of the curve, also consistent on the one-month horizon.
The bearish/bullish composite indicator confirms this trend: the put/call open interest ratio has dropped to its lowest for the year, and the volume ratio has halved from June's hedging peak; perpetual contract funding rates have been below the neutral line daily for the past month.
This optimism comes from the unwinding of hedging positions, not from an accumulation of new leverage. Short squeezes built on this combination are typically milder during pullbacks than those driven by funding rates.
Altcoins Bleeding, Bitcoin Leading
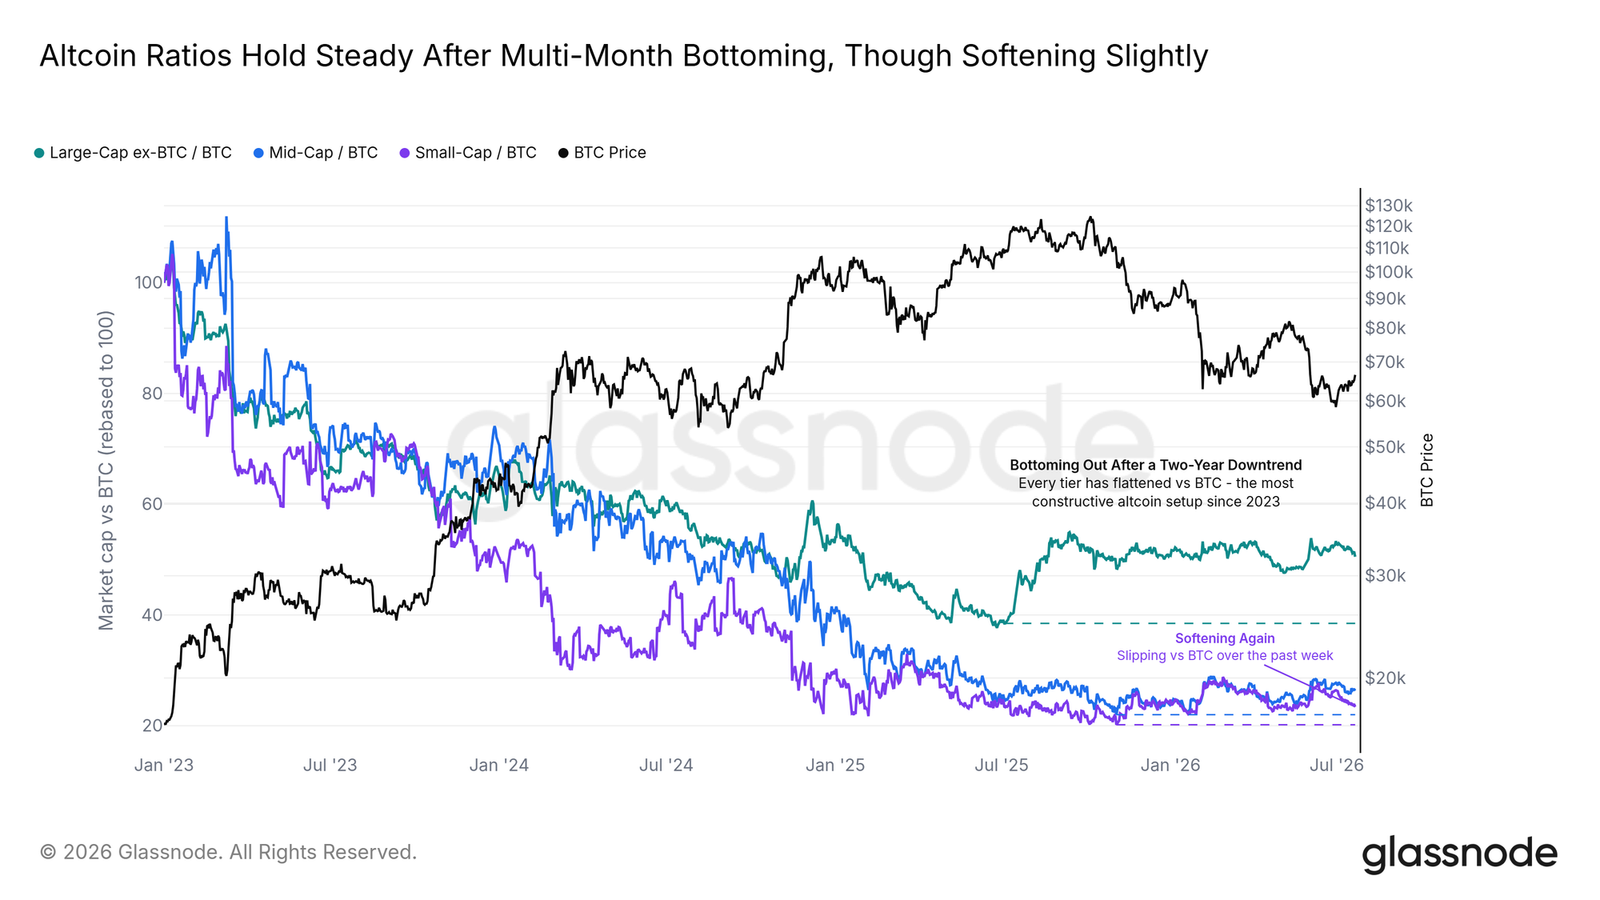
Beneath the surface, funds continue to choose leaders. Altcoins at all levels have weakened against BTC for consecutive years; this spring, this long-term downward trend has leveled out, forming the most constructive altcoin bottom in a bear market. Last week, this slow decline quietly restarted: as Bitcoin rose, small-cap coins further ceded ground to BTC.
This is a healthy rotation version. Bitcoin leads by concentrating funds into the most liquid assets before spilling outwards; an early altcoin lead often signals a bubble. Holding the bottom and letting Bitcoin lead is the sequence that should characterize a durable recovery.
Conclusion
Before proving itself, this remains a bear market rebound, and the proving ground has been clearly defined. The squeeze has done all it can do: unwound hedges, liquidated shorts, calmed funding rates, and shifted ETFs from a drag to support. However, it has not yet cleared the upper resistance. This week, Bitcoin remains below the $69,000 short-term cost basis, above which is an air pocket and the $84,000 threshold; below is the $63,000 demand support area and an evolving support structure.
If it decisively reclaims $69K under sustained spot inflows, the pocket above will open; if it encounters resistance and exchange inflows reappear, the market will retreat to test the support zone.
免责声明:本文章仅代表作者个人观点,不代表本平台的立场和观点。本文章仅供信息分享,不构成对任何人的任何投资建议。用户与作者之间的任何争议,与本平台无关。如网页中刊载的文章或图片涉及侵权,请提供相关的权利证明和身份证明发送邮件到support@aicoin.com,本平台相关工作人员将会进行核查。


