ETH 4-hour Market Depth Analysis
1. Market Indicator Breakdown
1. Bollinger Bands BOLL
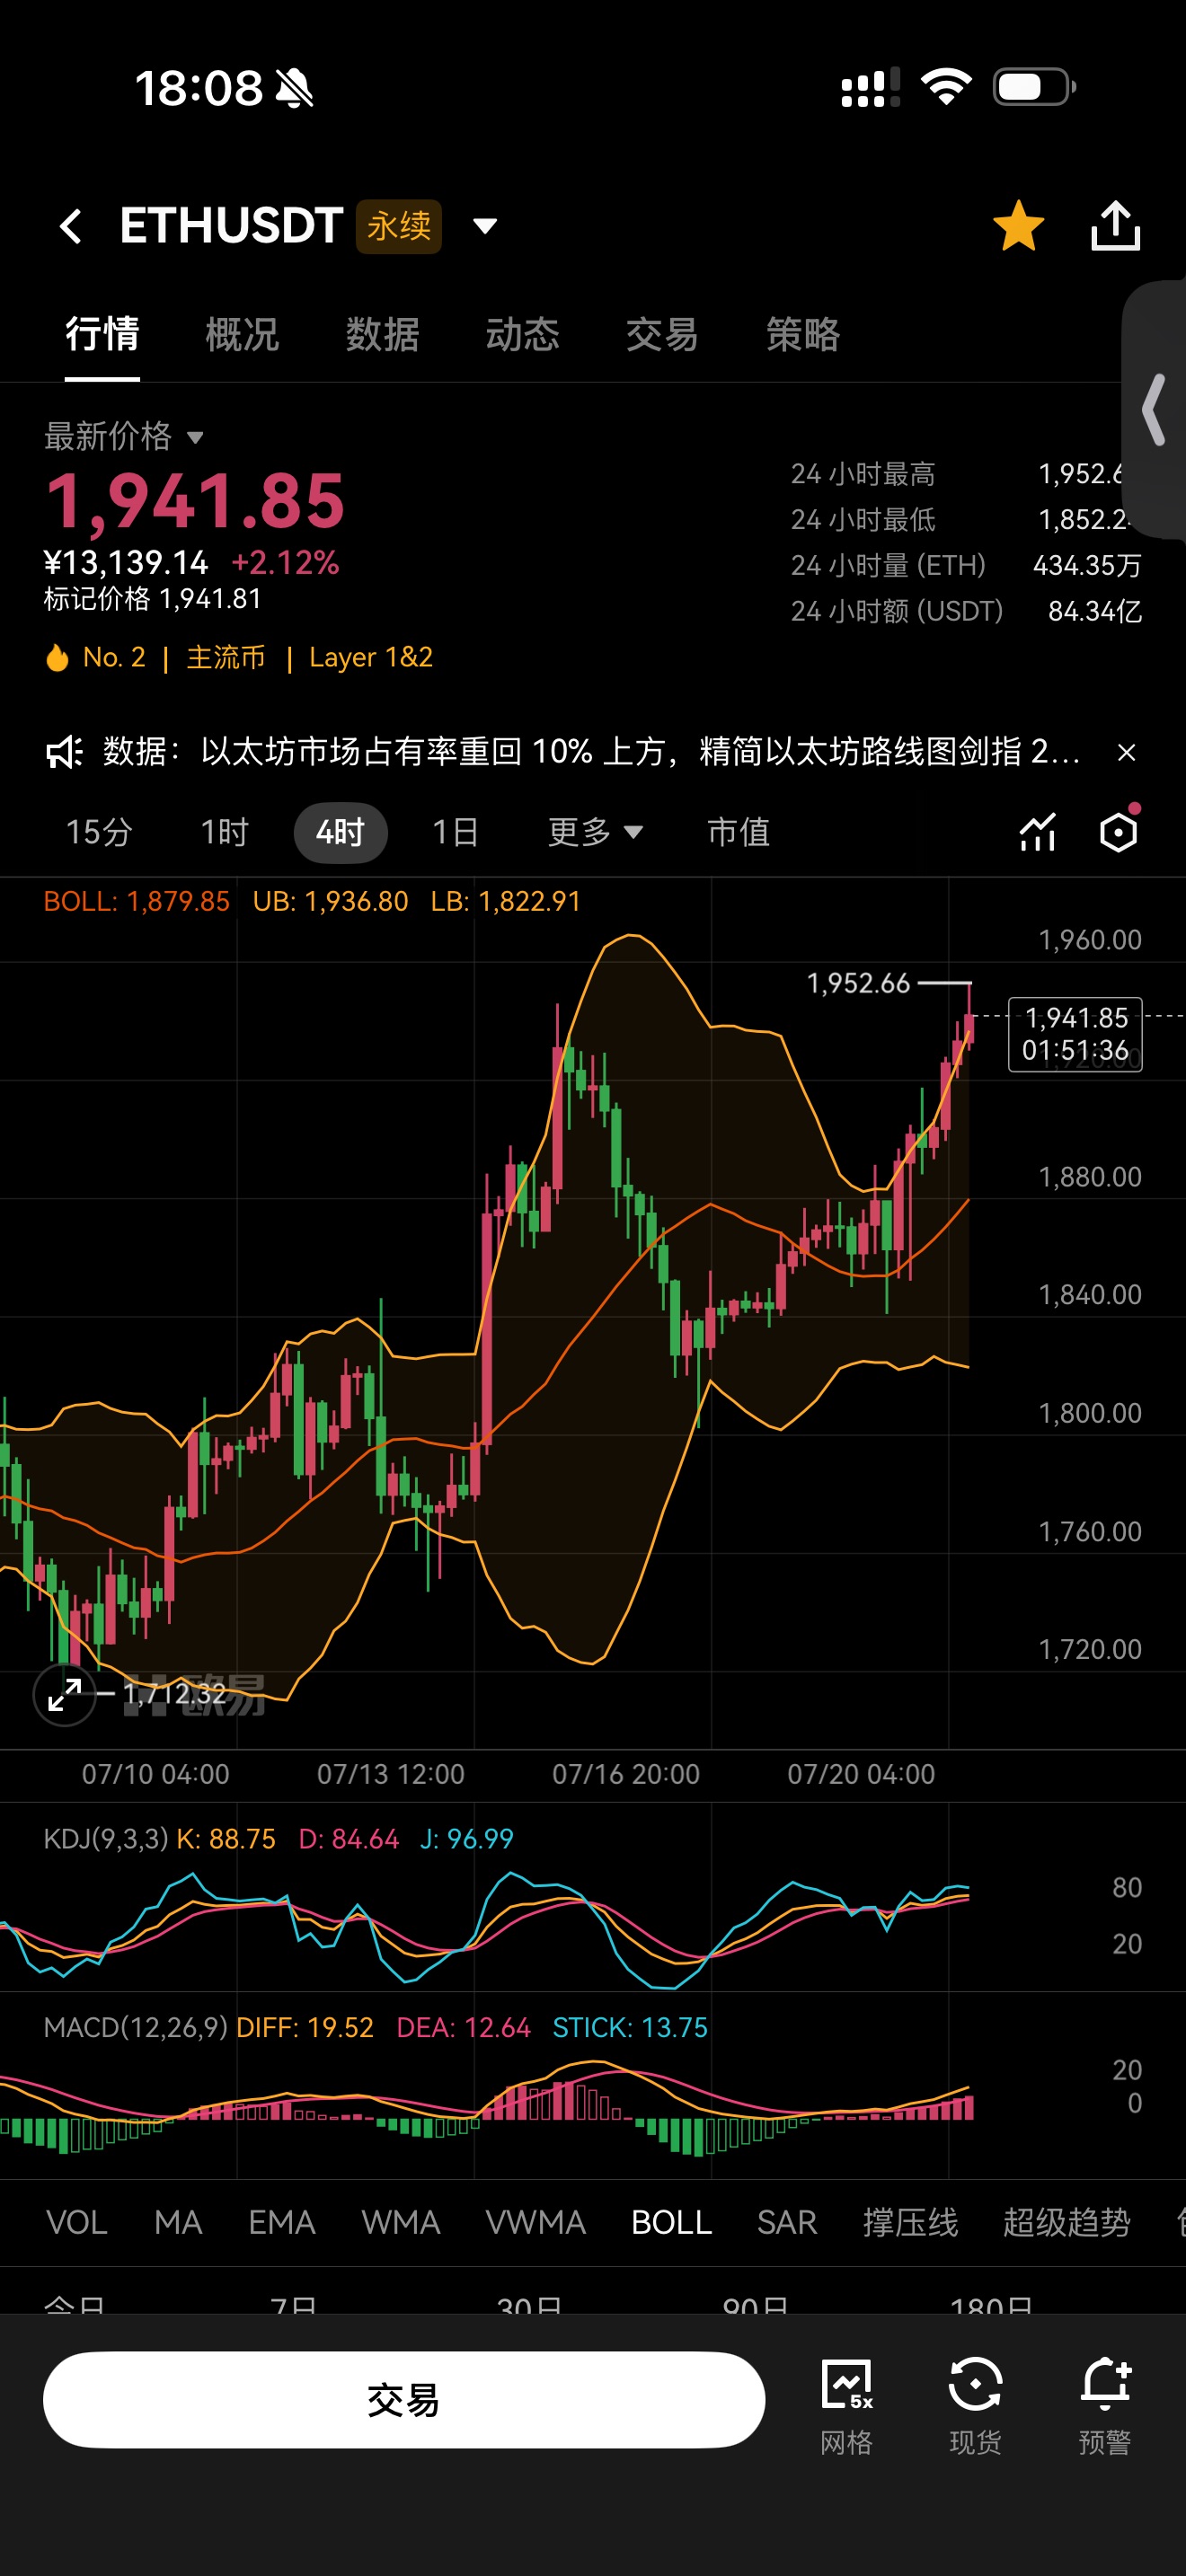
• Upper Band 1940, the current price has broken through the upper Bollinger band, typical of an overbought rally;
• Price above the upper Bollinger band indicates that short-term bullish momentum is overstretched, often resulting in two scenarios: either a resistance-led pullback after an inertial rise, or a sideways consolidation to digest gains before rising again;
• The middle band at 1880 is the core support below and the dividing line for the strength of this rebound.
2. KDJ Indicator
K=88.75, D=84.64, J=96.99, all three lines are in the severely overbought range (J>80).
Signal interpretation: The 4-hour bullish sentiment is overheated, making a top divergence and technical pullback very likely, but overbought does not mean an immediate drop; it is highly probable that there will first be high-level volatility.
3. MACD Indicator
DIFF=19.52, DEA=12.64, red bars continue to widen, with the fast and slow lines diverging upwards.
Explanation: The mid-term upward momentum remains intact, the bullish trend has not reversed, but the indicators are overheated and need adjusting; currently, there is no clear bearish reversal signal, only "waiting for a retracement after a rapid rise."
4. K-Line Patterns
Price is hovering under pressure near previous high point 1952, with a 24-hour gain of 2.12%. After a strong rise, it encounters resistance at previous highs, with significant upper resistance locked at the 1950-1960 range; short-term support is at 1930 (upper Bollinger band) and strong support is at 1880 (middle Bollinger band).
Short-term speculation for a pullback
Relying on KDJ overbought + previous high pressure to hold the base position, profit target looks towards the three levels of 1936 (upper Bollinger band), 1920, 1880; stop loss set above the breakout of previous highs at 1980, decisively exit if broken to avoid one-sided continuous rise risk.
2. Market Forecast
1. Short-term: High-level consolidation in the 1930-1950 range to digest overbought indicators, with a low probability of inertia touching 1960 resistance;
2. Once breaking below the 1940 upper Bollinger band: it will trigger a pullback recovery phase, with the first drop target being 1880 middle band support;
The current stage is characterized by an overbought stagnation phase after bullish highs, suitable for light positions to speculate on technical retracement, and do not heavily bet on a large drop; tight stop loss at the previous high position, hold the position and wait for indicators to drop for recovery.
BTC 4-hour Market Analysis
1. Core Indicator Breakdown
1. Bollinger Bands BOLL
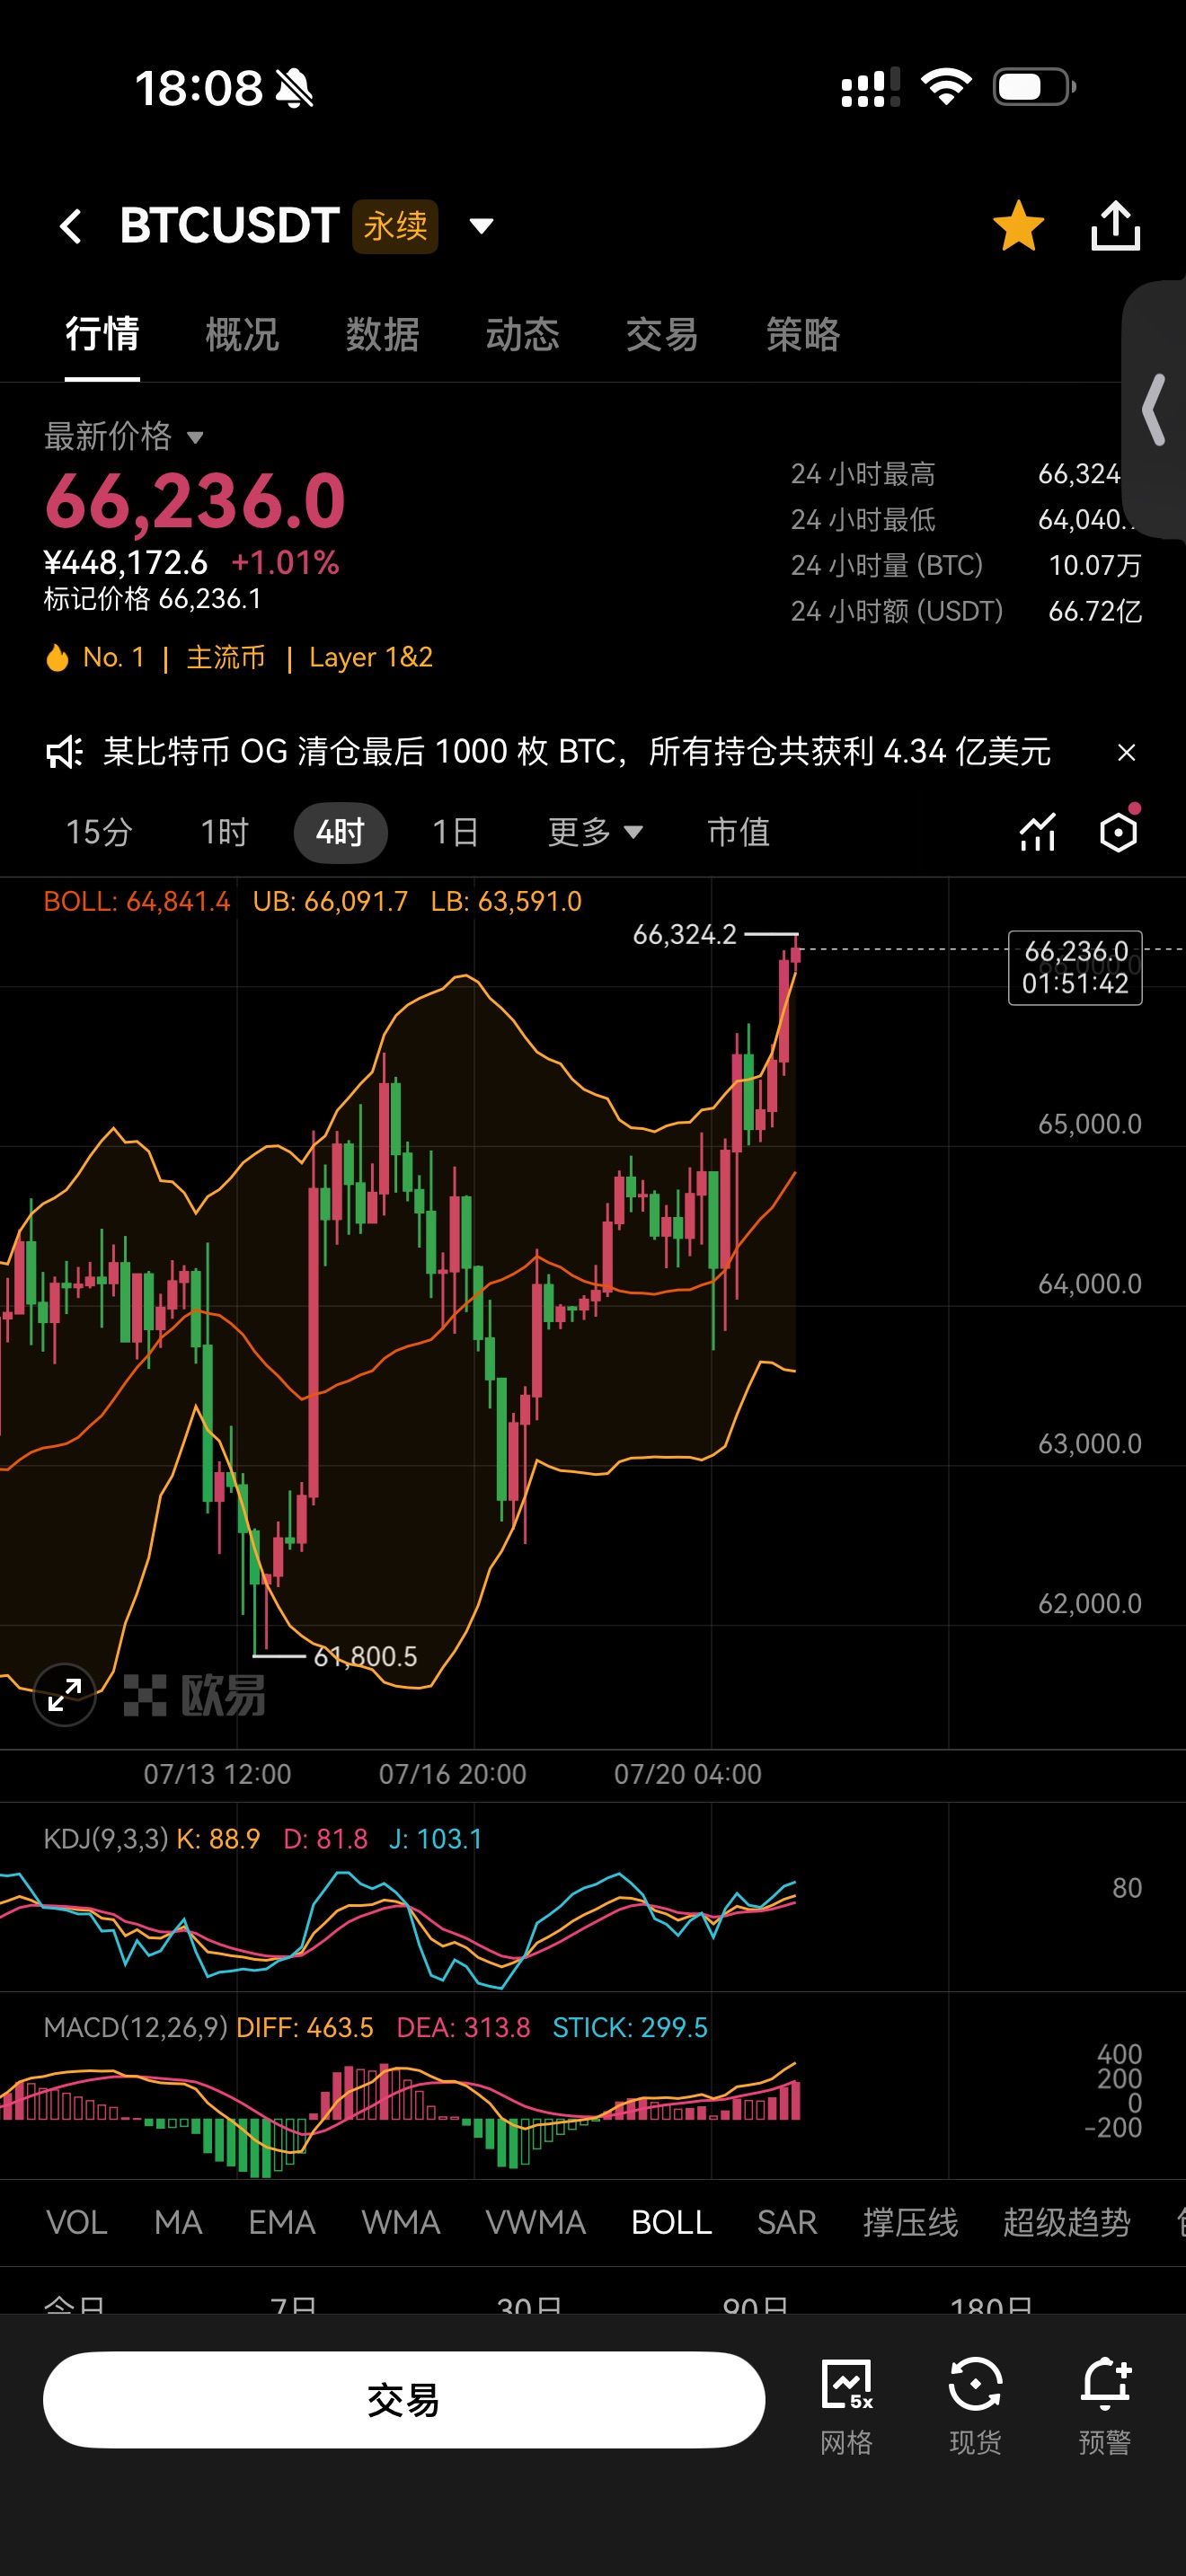
Middle Band: 64800, Upper Band: 66000, Lower Band: 63500
The current price of 66200 has strongly broken through the upper Bollinger band, forming a sharp rise outside the band, characteristic of a short-term extreme overbought market.
Price above the upper band indicates full short-term bullish force but signifies a strong need for "Bollinger band pullback restoration" after leaving the band; 66000 (upper band) is the first support, and 64800 (middle band) is the dividing line for the strength of this rebound.
2. KDJ Overbought Signal
K=88.9, D=81.8, J value of 103.1 severely breaches the overbought threshold (>80).
The 4-hour cycle has entered a seriously overheated area, with bullish energy exhausted, and the subsequent likely two trends:
① High-level sideways consolidation to digest overbought indicators, waiting for the KDJ to turn and dead cross;
② Slightly inertial rise followed by a rapid pullback to the Bollinger band.
⚠ Overbought ≠ immediate drop, it only indicates insufficient upward momentum after a rise, not suitable for chasing long.
3. MACD Trend Structure
DIFF=463.5, DEA=313.8, red bars continue to expand, with fast and slow lines maintaining upward divergence.
The mid-term upward trend remains sound, the bullish framework has not reversed, just short-term gains are overstretched and require adjustment; currently, there are no peak signals such as top divergence or dead cross, only expectations for a technical pullback.
4. K-Line and Pressure Support
• Daily high: 66324.2, current price closely hovers under previous highs, with significant upper limits at 66300-66500;
• Short-term support: 66000 (upper Bollinger band); strong support: 64800 middle Bollinger band;
• 24-hour slight increase of 1.01%, volume surged towards earlier resistance, with upward pace slowing, showing characteristics of rise stagnation.
2. Future Market Trend Prediction
1. Short-term: High-level consolidation in the 66000-66400 range for indicator adjustments, with a low probability of slightly touching 66600;
2. If breaking below the 66000 upper Bollinger band: it will trigger a technical pullback phase, heading straight for 64800 middle band support;
3. If volume stabilizes above 66300 previous high: the current rebound continues.
The major coin's short-term bullish momentum has reached the overbought end, with upward strength weakening and pullback expectations rising, suitable for bottom positions to speculate on recovery; core positions should be controlled with stop losses, hold for a drop unless previous highs break, decisively exit upon breakage.
Public account—Big Bear X
(Note: 📣 Due to the timeliness and depth limitations of public platform information, the market is ever-changing. Key inflection points, precise operational strategies, unexpected risk alerts, and other content need to be synchronized on the public account in a timely manner. Here you can get: real-time strategy push, in-depth analysis support, interactive Q&A, risk warnings and optimization suggestions tailored to personal positions. 🚨 Remember: the market always rewards those who act faster and have more accurate information! Be a winner of the minority.)

免责声明:本文章仅代表作者个人观点,不代表本平台的立场和观点。本文章仅供信息分享,不构成对任何人的任何投资建议。用户与作者之间的任何争议,与本平台无关。如网页中刊载的文章或图片涉及侵权,请提供相关的权利证明和身份证明发送邮件到support@aicoin.com,本平台相关工作人员将会进行核查。