Written by: Rita
Guide to trends
Bank of America's bull-bear indicator has risen again, from 9.4 to 9.6, further deepening into the extreme bullish range. Historically, this indicator exceeding 8.0 is a sell signal.
As the signals turn bright red, funds are still flooding in. The semiconductor ETF has already seen an inflow of $46 billion this year, accounting for 31% of AUM; the inflow into technology funds in the past three weeks has reached a record $48 billion. The problem is that the Philadelphia Semiconductor Index has fallen about 20% from its June peak, with funds buying into a declining sector.
Bank of America's conclusion is straightforward: retreat or rotate, adding positions is not an option.
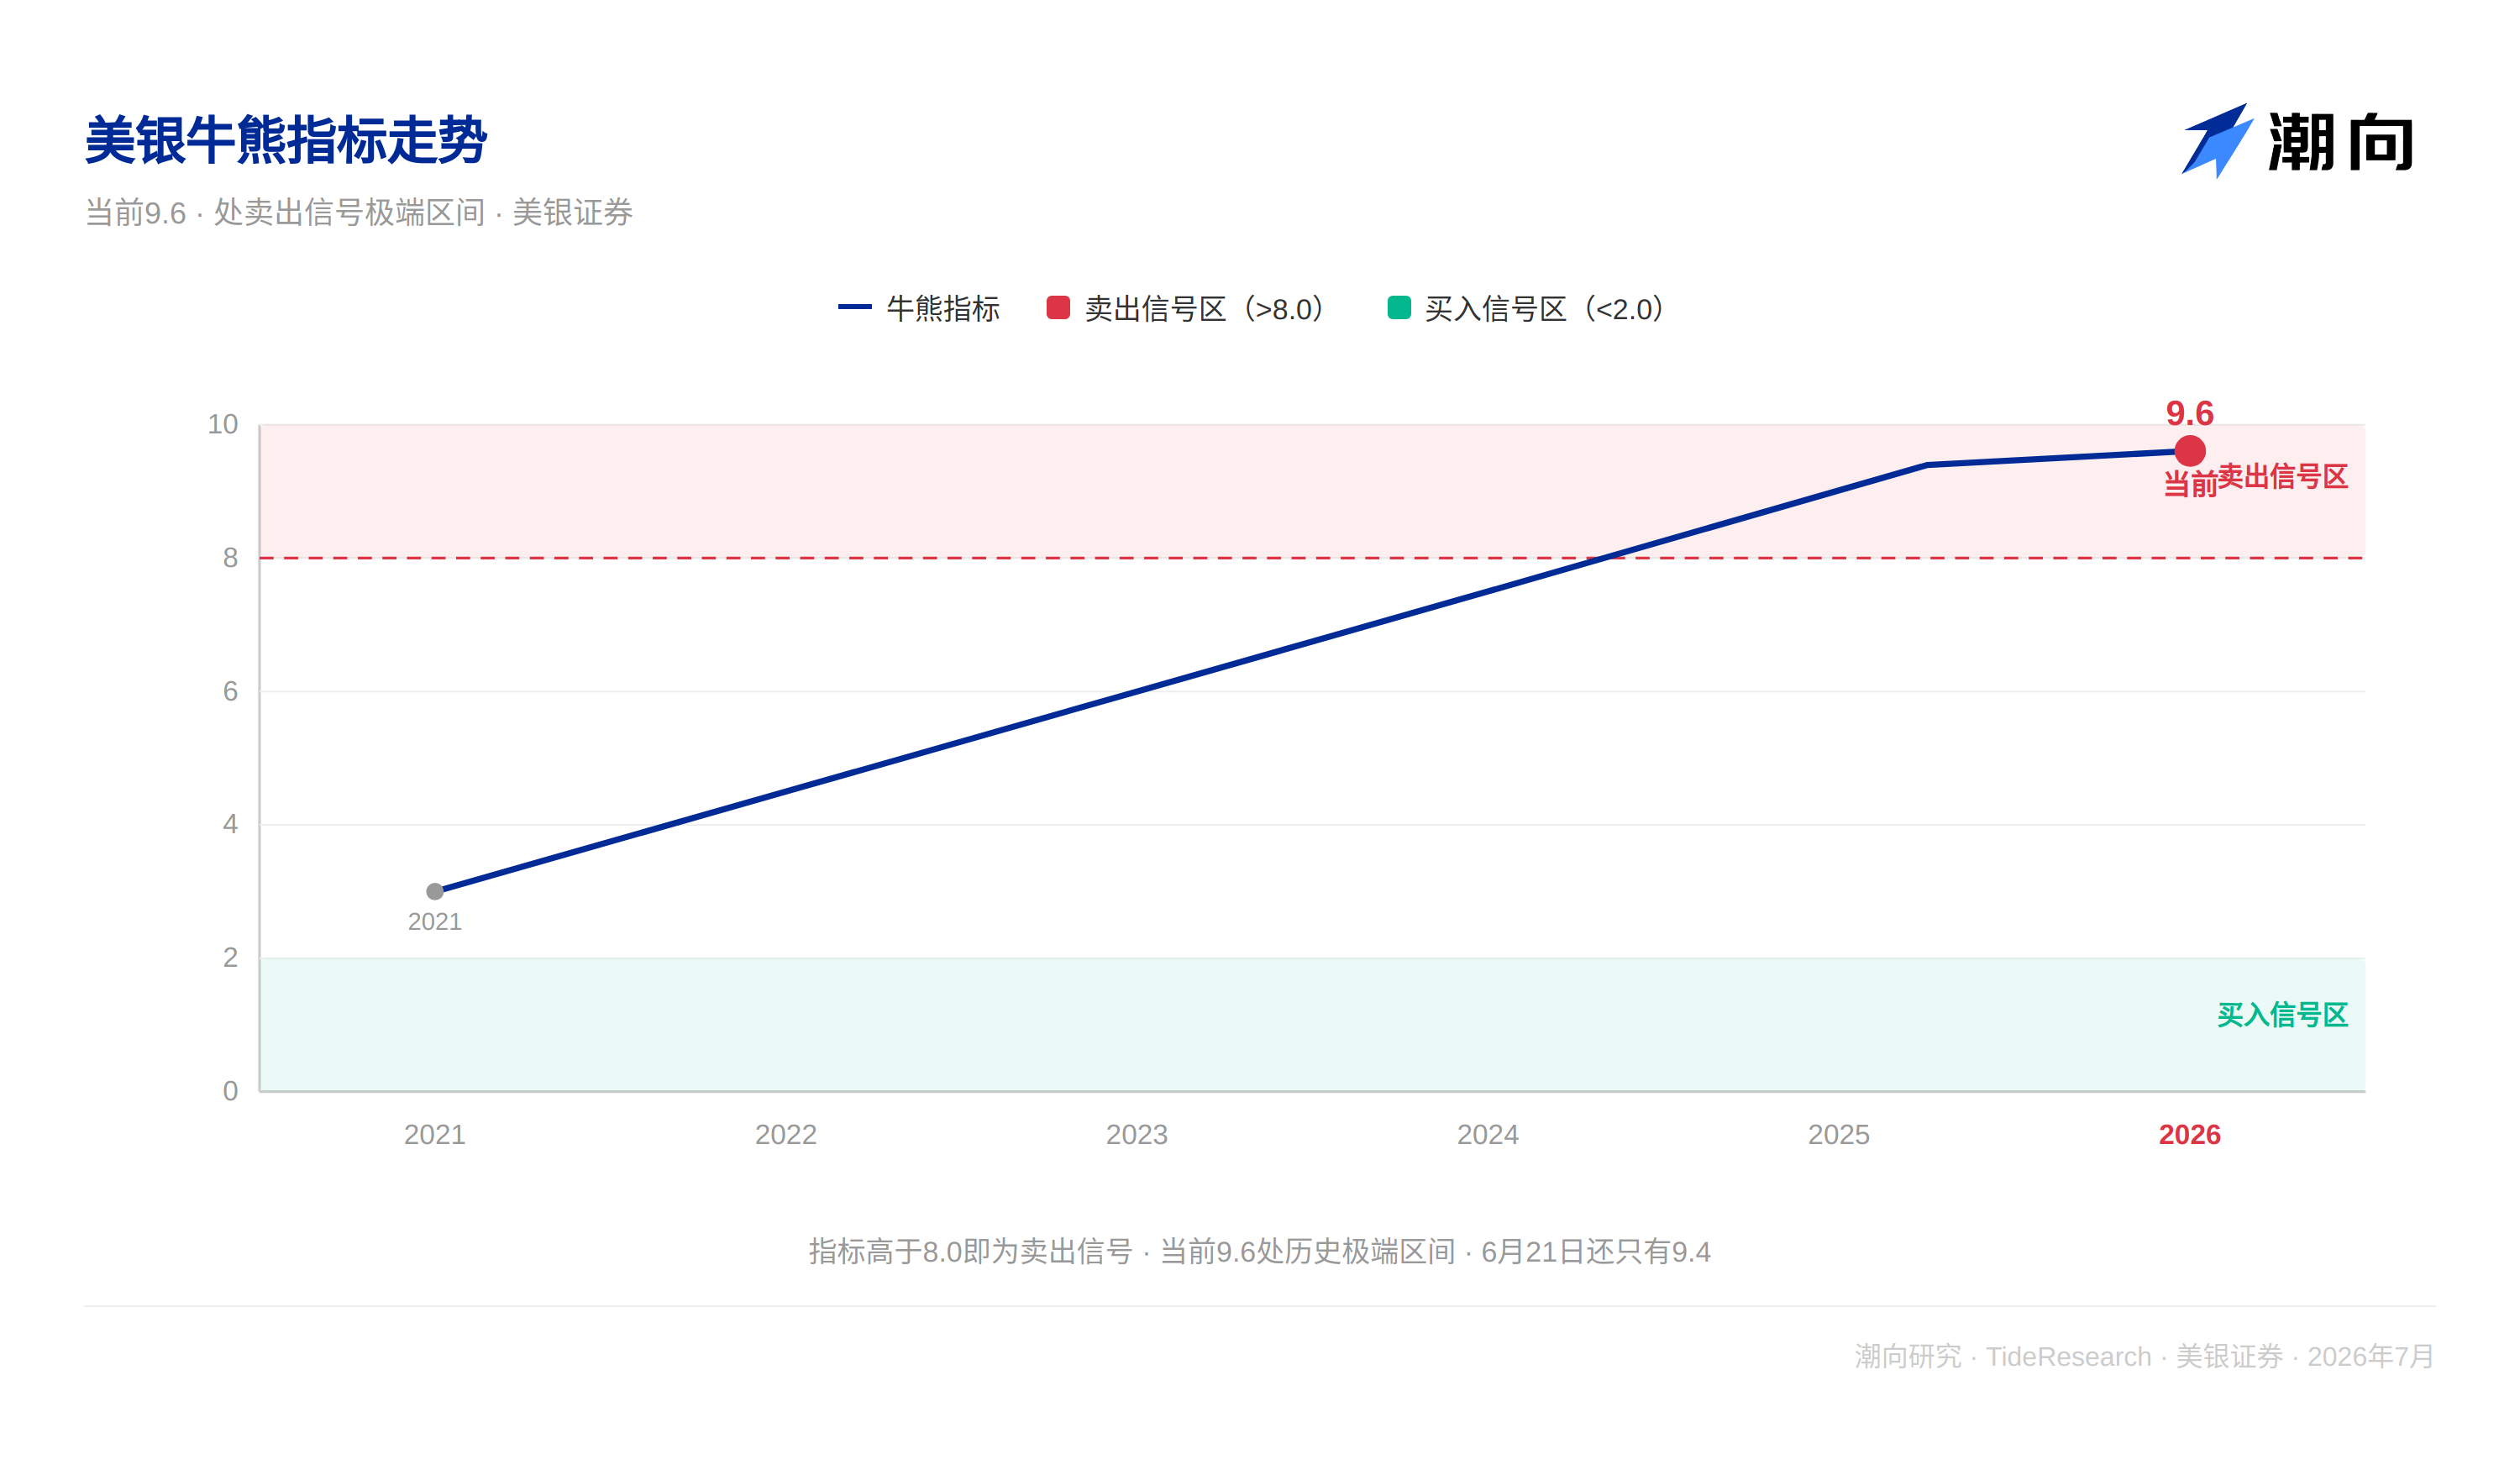
All indicators of extreme bullishness are lighting up
The bull-bear indicator has risen to 9.6, driven by three factors: institutional cash levels decreased to 3.6% (July global fund manager survey), strong stock inflows, and improved global stock index breadth. Some of this is offset by rising AT1 credit spreads, but overall it remains in the extreme range.
Bank of America clearly states in the report that the current signals indicate the market is "topping," and recommends reducing equity exposure; retreating or rotating is a wiser strategy than adding positions.
This is not just an isolated signal. The cash allocation of Bank of America’s private clients has dropped to a historic low of 9.6%, while equity allocation has risen to 65.8%. In the past four weeks, private clients have consistently bought municipal bonds and defensive sector ETFs (consumer staples, healthcare, utilities), while selling materials, low volatility, and energy ETFs. Funds are shifting toward defensive positions, but overall still remain in an extreme bullish state.
Funds are buying into declining semiconductors
The most peculiar scene is occurring in the semiconductor sector. The SOX index has fallen about 20% from its June high, but funds continue to pour into semiconductor ETFs. In the past week, the eight largest semiconductor ETFs saw inflows of $2.3 billion, totaling $46 billion so far this year, which is equivalent to 31% of these ETFs' total AUM. Historically, such large fund inflows are typically accompanied by rising sectors; it is uncommon for this to happen during a decline.
Bank of America describes this phenomenon as "significant price drops, but positions have not decreased." This is a typical "bottom-fishing" mentality, but against the backdrop of the bull-bear indicator flashing red, the risk of bottom-fishing is rising.
Technology funds have seen a cumulative inflow of $48 billion in the past three weeks, setting a historical record. Bank of America calls this "chasing," believing that this inflow reflects more of a belief that "AI is not over" rather than fundamental judgments.
The consensus that "will not happen" is weakening
The July global fund manager survey shows that investors' extreme optimism is based on three assumptions: the economy will not enter recession (54% believe in a "soft landing"), the Federal Reserve will not raise interest rates (83% believe there will be no rate hike before the mid-November elections), and mega-cap companies will not cut AI capital expenditures (61% believe there will be no cuts before the end of the year).
Bank of America believes that all three of these consensuses may be broken.
Inflation has not been truly controlled. At the current trend, the U.S. CPI is expected to remain around 3.9% by the end of 2026, with core inflation still running at a month-on-month level of 0.3%. The Strait of Hormuz may close again, and U.S. crude oil inventories have dropped to the lowest level in 45 years (43 days of supply), with the risk of rising oil prices potentially reemerging. If the Federal Reserve unexpectedly raises interest rates before November, the biggest beneficiary will be the dollar.
AI capital expenditures of mega-cap companies are squeezing free cash flow. A negative turn is expected by 2027, and the credit market is already reflecting pressure. The spreads of Oracle CDS and IG tech bonds are reverting to the highs of September 2025, increasing from 59 basis points to 87 basis points. Bank of America thinks that if a mega-cap company announces a cut in AI capital expenditures, it would be a significant turning point for the market.
What is the only "buy signal"
Bank of America provides a specific observation anchor in the report: MAGS (Technology Seven Giants Index).
If MAGS falls below 65, it means a broader market correction is underway, which will weigh on long positions in cyclical sectors (banks, brokers, industrial stocks). If MAGS breaks above 70, it is a reliable signal to re-enter.
Before that, Bank of America's advice is clear: the best strategy for summer is to retreat or rotate, adding positions is not in consideration. Directions include duration, defensive sectors, high dividends, and the dollar.
Trends perspective
The most valuable part of Bank of America's report is turning the vague judgment of "extreme sentiment" into a quantifiable system: a bull-bear indicator of 9.6 equals a sell signal.
Extreme conditions themselves do not predict, they describe the current state. A signal of 9.6 indicates the "level of crowding," and it does not answer the question of "how much will it fall." However, historically, when institutional cash drops below 4%, private client cash hits a historical low, and funds continue to flow in while prices decline, these combinations usually indicate that the market's risk-reward ratio is deteriorating.
For investors, what truly needs attention is the MAGS anchor point; its fluctuations between 62 and 70 will determine whether to retreat or re-enter. Bank of America does not provide directional conclusions but offers a clear observation framework: below 65, retreat; above 70, enter.

Disclaimer
This article is a compilation and interpretation of a third-party brokerage research report (Bank of America Securities, July 17, 2026) by Trend Research. The ratings, target prices, earnings forecasts, and related judgments quoted in this article represent the views of the brokerage's analysts, reflecting their institution's stance, and do not represent the views of Trend Research, nor do they constitute any investment advice.
The market is risky, and decisions must be independent. This article should not be used as a basis for buying or selling any securities.
免责声明:本文章仅代表作者个人观点,不代表本平台的立场和观点。本文章仅供信息分享,不构成对任何人的任何投资建议。用户与作者之间的任何争议,与本平台无关。如网页中刊载的文章或图片涉及侵权,请提供相关的权利证明和身份证明发送邮件到support@aicoin.com,本平台相关工作人员将会进行核查。


