Crypto Circle Academician: July 18 Ethereum (ETH) Life and Death Volatility! Key Interval Decision Will Ignite a New Wave of Market? Latest Market Analysis Reference
The current price of Ethereum is 1840. Most of the time, the market is in a volatile washout phase, with very few real trend movements. Currently, the price level of 1835 is a typical tug-of-war trap, where the main players sweep stop losses back and forth, clearing out retail investors' positions. Whether blindly chasing long or short positions, the likelihood of being harvested is high. Many people are always eager to verify right or wrong in trading, wanting to make a profit on every single trade, but they do not understand the trade-offs and the unclear markets. Trading is, after all, a probability game, with no 100% winning trades. What we can do is seize high risk-reward opportunities, strictly manage losses, and lightly position ourselves, holding on to our upward chips.
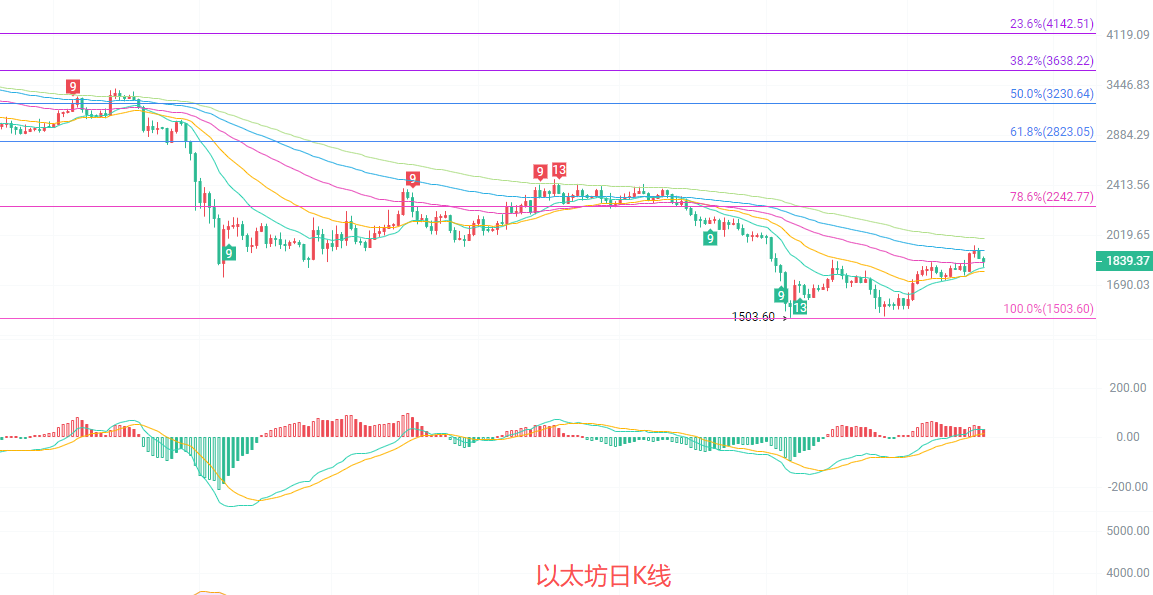
The daily K-line is in the low rebound phase of a downward trend, with prices running above EMA15 and near EMA30. Signs of short-term moving averages turning from south to north are beginning to show. In the MACD indicator, the DIF is above the DEA, and the red bars continue to expand, indicating that upward momentum is recovering. The middle band of the Bollinger Bands is at 1755, with the upper band at 1948 and the lower band at 1563. The price is currently above the middle band, with clear support below. The 78.6% Fibonacci retracement level of 2242 remains a strong resistance, and the current price of 1835 is in the mid-stage of the correction of the 1503-4957 downward wave, with the overall downward trend not fully reversed.
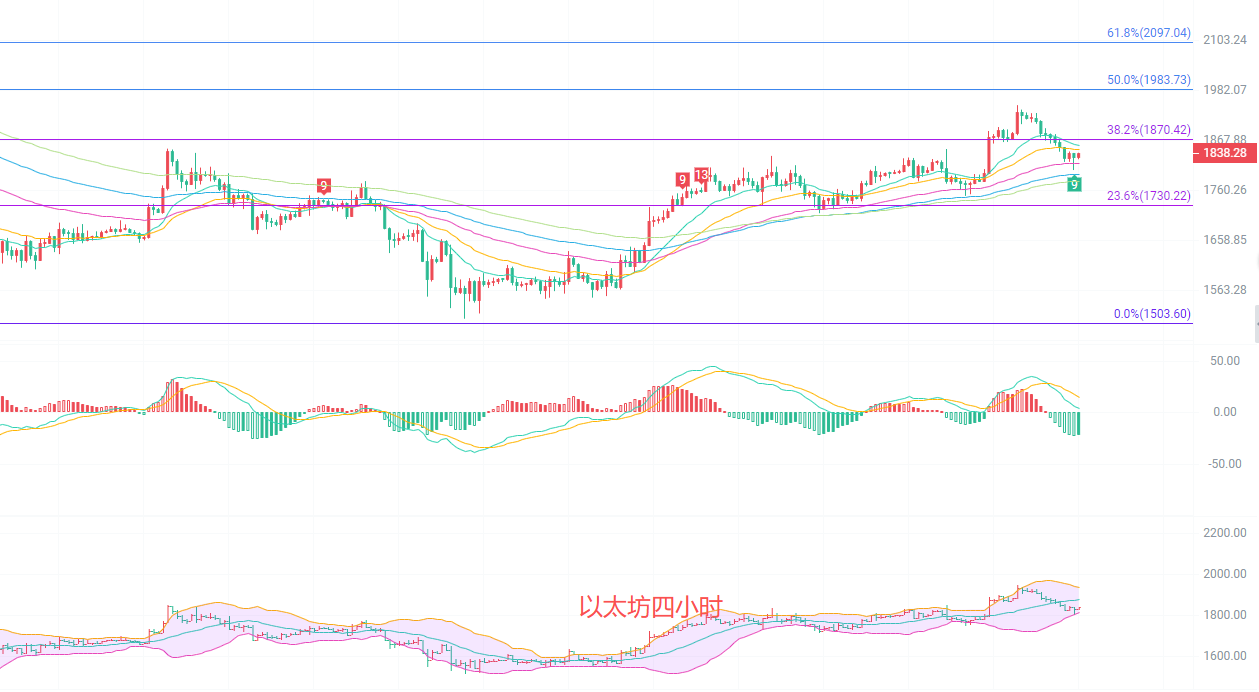
The four-hour K-line has recently formed a small-level rebound channel, with prices above EMA15 and near EMA30. The moving averages have transitioned from merging to turning upward, showing an early indication of an upward arrangement. In the MACD indicator, the DIF and DEA are about to form a death cross, and the red bars are shortening, indicating a decrease in short-term upward momentum. The Bollinger Bands are currently in a contracting state, with the middle band at 1877, the upper band at 1938, and the lower band at 1817, with prices clearly suppressed by the middle band. The 23.6% Fibonacci support is effective, while the 38.2% is currently strong pressure. The price of 1835 is in the central position of the range, with a directional choice imminent.
Short-term Reference:
If it does not break below 1820 to 1790, expect upward movement, stop loss at 1760, target looking at 1880 to 1920.
If it does not break above 1920 to 1960, expect downward movement, stop loss at 1990, target looking at 1880 to 1830.
Specific operations are based mainly on real-time market data. For more information, please consult the author. The article is published with a delay; suggestions are for reference only, and risks are taken at one's own responsibility.

Warm reminder: The above content is solely created by the author's public account. The advertisements at the end of the article and in the comment section are unrelated to the author. Please discern carefully; thank you for reading.
免责声明:本文章仅代表作者个人观点,不代表本平台的立场和观点。本文章仅供信息分享,不构成对任何人的任何投资建议。用户与作者之间的任何争议,与本平台无关。如网页中刊载的文章或图片涉及侵权,请提供相关的权利证明和身份证明发送邮件到support@aicoin.com,本平台相关工作人员将会进行核查。