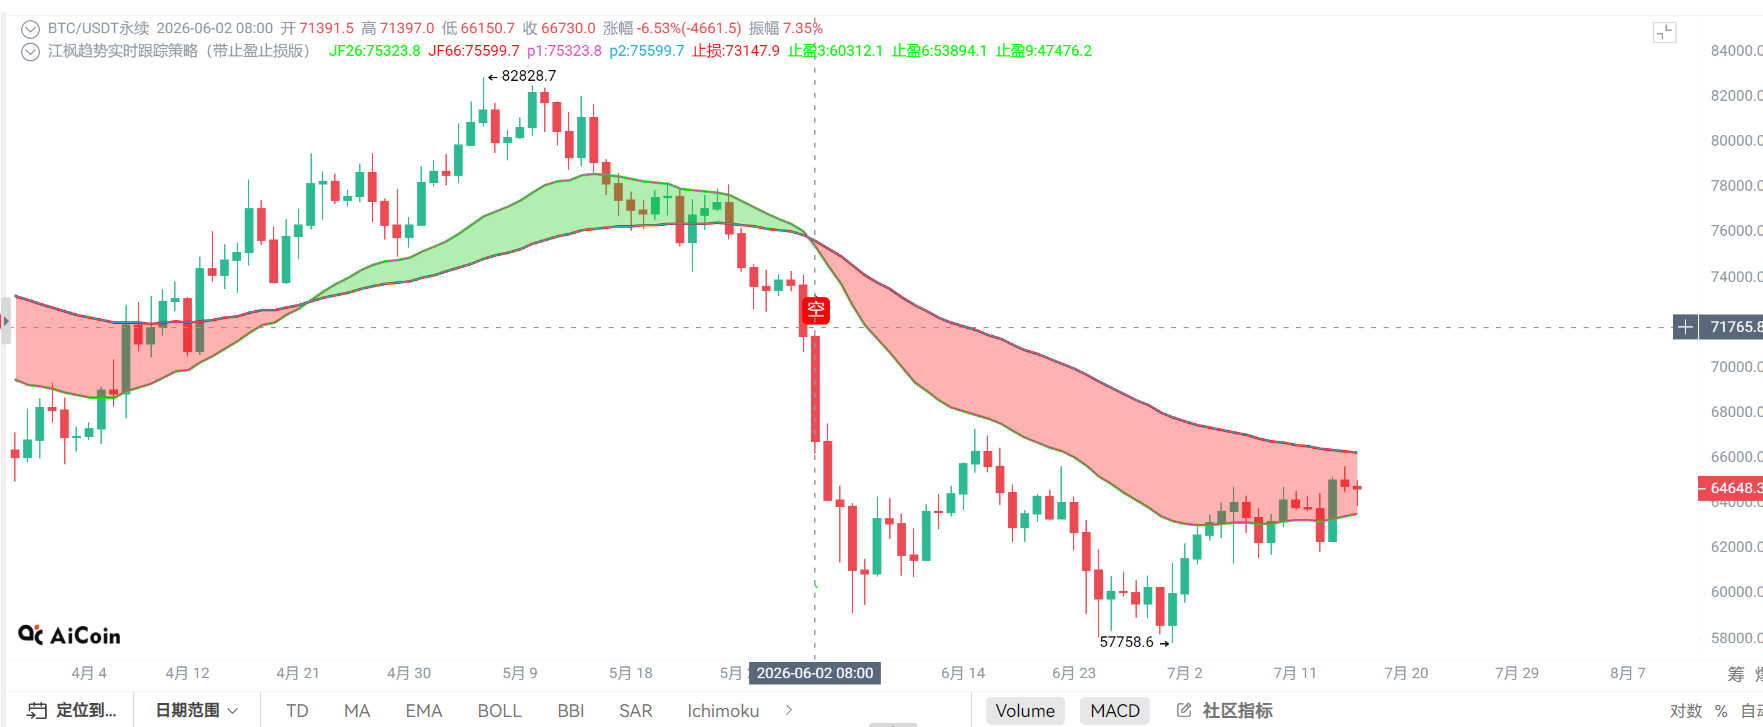
Crypto Circle Academician: On July 17, the Bitcoin (BTC) long-short game enters a decisive period, does the technical aspect reveal the truth about market changes? Latest market analysis and operational suggestions.
Currently, Bitcoin is at 64200, constantly fluctuating, and people's hearts are always swaying. At this position of 64200, some are anxious, some are watching, and some are secretly increasing their positions. In trading, it's not really about who has better skills, but rather about who can control their own hands. Don’t be impatient when you should wait, don’t hold positions when you should cut losses, and don’t be greedy when it's time to take profits. Many people lose not because they don't understand, but because their execution is too poor; they have a good plan written down, but when the market fluctuates, it all goes awry, especially since we have risen above 60000 up to now, some fellow traders have poor execution, can’t hold on, and run away after making a little profit, now they regret it deeply; those still in the market should stay stable and hold firm.
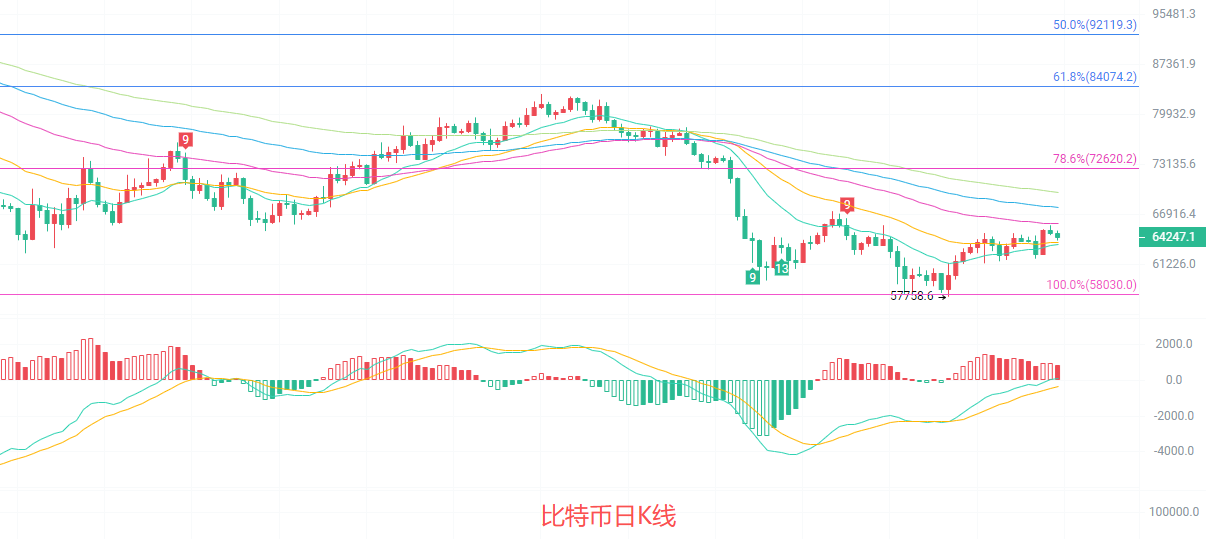
The daily candlestick is in the rebound repair phase from the low point of 57738. The current price is above the EMA15 and EMA30 short-term moving averages, indicating signs of stabilization in the short term, but it is still suppressed by the EMA60 and EMA90 above, and the mid-term downtrend has not been completely reversed. The MACD indicator shows that the DIF is still below the DEA, but the green bars have clearly shortened, and the downward momentum continues to weaken. The middle track of the Bollinger Bands is close to EMA30, with prices running near the middle track, overall in a rebound consolidation phase after building a base, and has not yet established a clear unidirectional trend.
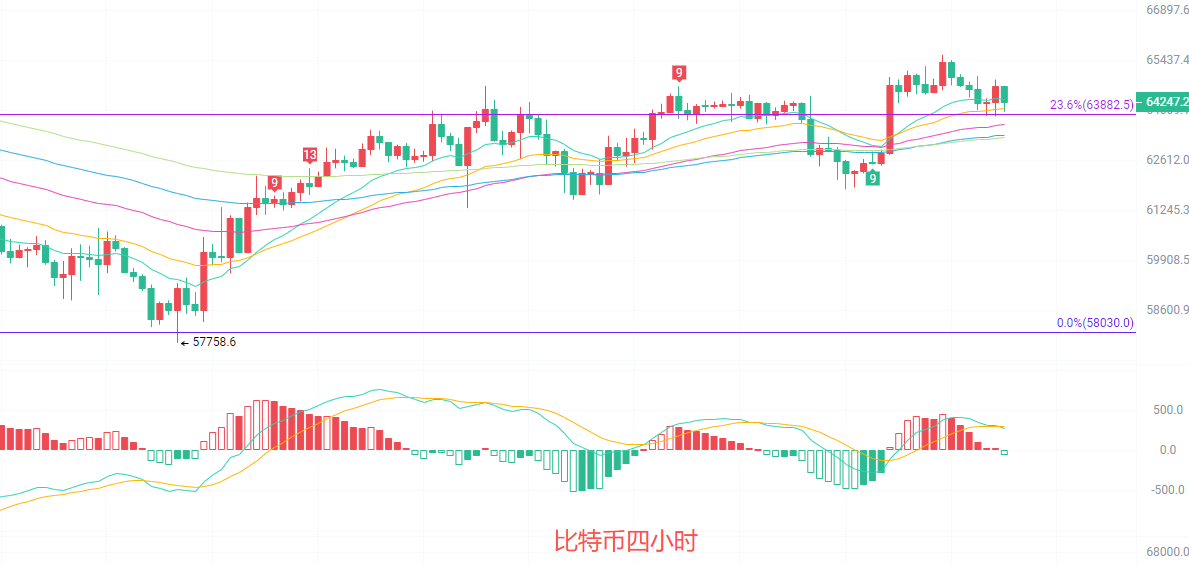
The four-hour candlestick is oscillating narrowly near EMA15 and EMA30, with the short-term moving averages flattening and merging, indicating fierce competition between northern and southern parties at the current price level. The MACD’s DIF and DEA are close to merging, with the red bars continuously decreasing, indicating a signal of weakening upward momentum. The middle track of the Bollinger Bands is at 64012, the lower track is at 61959, and the upper track is at 66065; the price is near the middle track of the Bollinger Bands, and the fluctuation range continues to narrow, likely maintaining a consolidation trend in the short term. The Fibonacci 23.6% retracement level at 63882 has been broken, with the next resistance level looking towards around 67503, and support below is around 63600.
Short-term reference:
If it doesn't break below 63800 to 63400, go long with stop loss at 63000, aiming for 66000 to 66500.
If it doesn't break above 66000 to 66500, go short with stop loss at 67000, aiming for 65000 to 64500.
Specific operations should be based on real-time data from the market; more information details can be consulted with the author. There may be a delay in publishing the article; recommendations are for reference only and risks are borne by the reader.

Friendly Reminder: The above content is created by the author only for the official account. Advertisements at the end of the article and in the comment section are unrelated to the author; please be cautious in identifying them. Thank you for reading.
免责声明:本文章仅代表作者个人观点,不代表本平台的立场和观点。本文章仅供信息分享,不构成对任何人的任何投资建议。用户与作者之间的任何争议,与本平台无关。如网页中刊载的文章或图片涉及侵权,请提供相关的权利证明和身份证明发送邮件到support@aicoin.com,本平台相关工作人员将会进行核查。