Academician of the Coin Circle: On July 17, Ethereum (ETH) dual-line cycle divergence, is a major breakthrough on the horizon? Latest market analysis reference
The current price of Ethereum is 1875. Often, the most frustrating time in the market is when an opportunity is about to arise. From our rebound at 1600 to now, doubts have never ceased, and fear has not stopped. But looking back, every bottom has risen amidst hesitation. Now at 1873, the south-north conflict is intense, and the sentiment of some coins has also reached a critical point. Don’t be swayed by panic, and don’t let greed cloud your judgment. Remain calm with your positions and patiently wait; our market will eventually arrive.
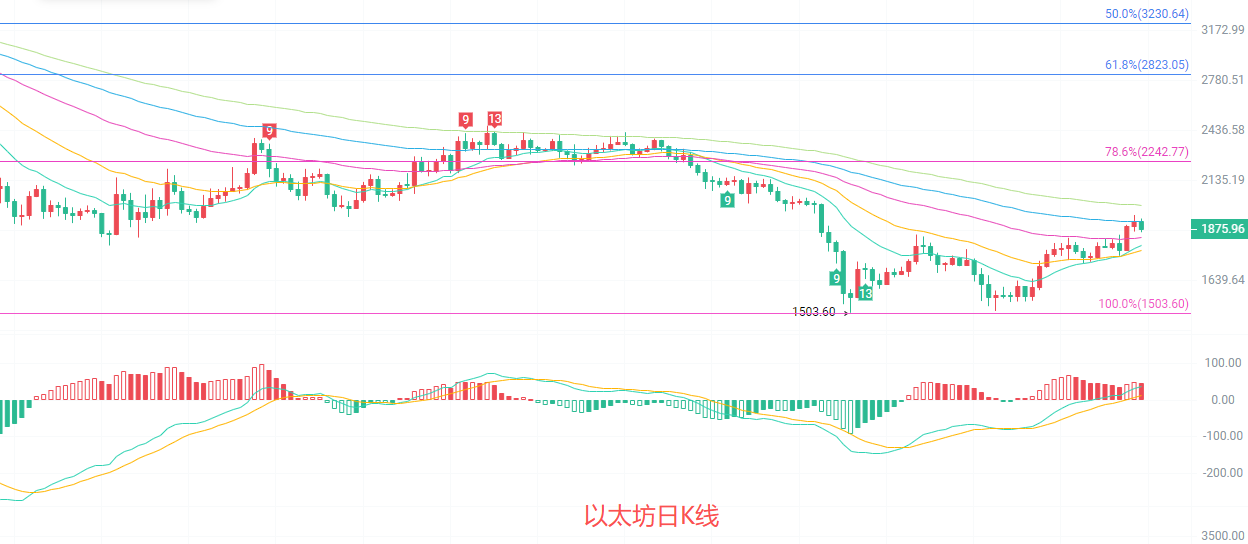
The daily K-line is currently in the rebound range from the previous decline's Fibonacci 78.6% to 100%. The current price has risen above the EMA15 and EMA30 moving averages, with a short-term trend leaning towards recovery, but is under pressure from the EMA60 and EMA90 moving averages, showing clear divergence between the north and south. The MACD indicator shows a continuous increase in red bars, with the DIF and DEA crossing upwards after being below the zero axis, indicating gradual accumulation of upward momentum; the Bollinger Band middle track at 1743 has been stabilized, and the upper track at 1948 constitutes short-term pressure, remaining in a weak rebound phase post-decline without forming a clear reversal signal.
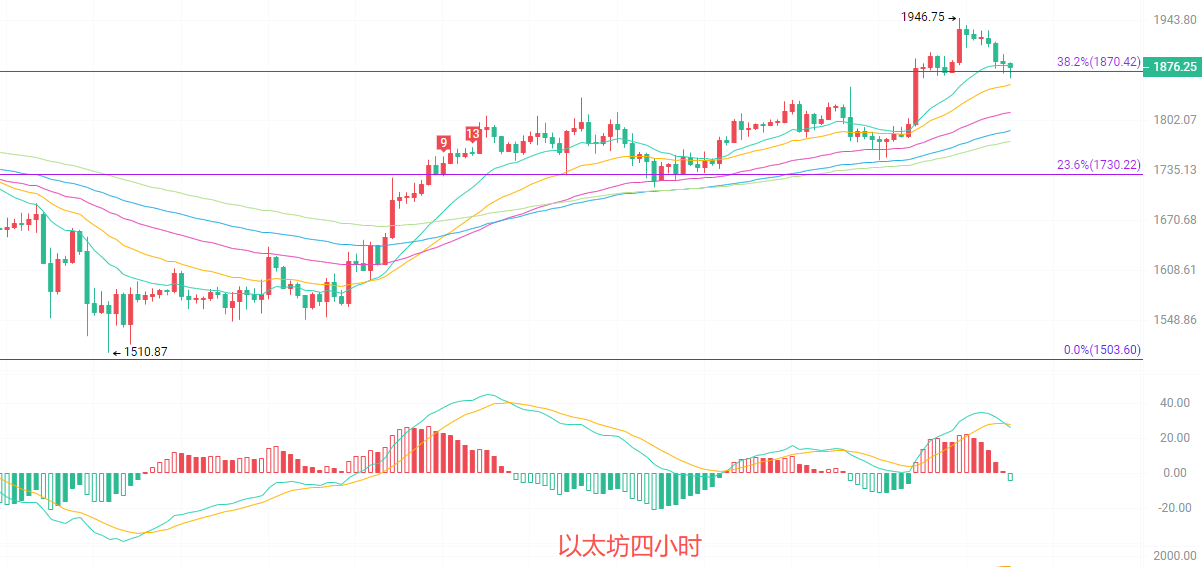
The four-hour K-line rebound trend is still continuing, with prices supported by the EMA15 and EMA30 moving averages, currently slightly retracing to test the validity of the moving average support. The MACD red bars show signs of shortening, with the DIF crossing under the DEA forming a dead cross, indicating a reduction in short-term upward momentum; the Bollinger Band middle track at 1859 provides support, while the upper track at 1968 shows clear pressure, and there is significant selling pressure near the previous high of 1946. The Fibonacci 38.2% position overlaps with the current price; if support can be maintained here, there may be a continuation of the rebound; otherwise, it is highly likely to retrace to the 23.6% support level.
Short-term reference:
If the lower price of 1880 to 1850 does not break, upward movements are expected, stop loss at 1800, target looking at 1950 to 2000.
If the upper price of 2000 to 2050 does not break, downward movements are expected, stop loss at 2100, target looking at 1950 to 1900.
Specific operations are mainly based on real-time data from the market. For more detailed information, you can consult the author. The article publication has a delay; suggestions are for reference only at your own risk.

Kind reminder: The above content is solely created by the author of the public account. Ads at the end of the article and in the comments section are unrelated to the author. Please be cautious in discerning, thank you for reading.
免责声明:本文章仅代表作者个人观点,不代表本平台的立场和观点。本文章仅供信息分享,不构成对任何人的任何投资建议。用户与作者之间的任何争议,与本平台无关。如网页中刊载的文章或图片涉及侵权,请提供相关的权利证明和身份证明发送邮件到support@aicoin.com,本平台相关工作人员将会进行核查。