The macro drivers of Bitcoin are shifting, and a test of short-term resistance is approaching.
Written by: Glassnode
Translated by: AididiaoJP, Foresight News
The bottom for Bitcoin is still being built, but its characteristics are subtly changing. The capitulation selling from long-term holders is starting to cool down, and buying has successfully absorbed the June lows. Prices are gradually recovering, challenging the areas that previously suppressed them.
Executive Summary
- The market has begun testing the resistance level above.
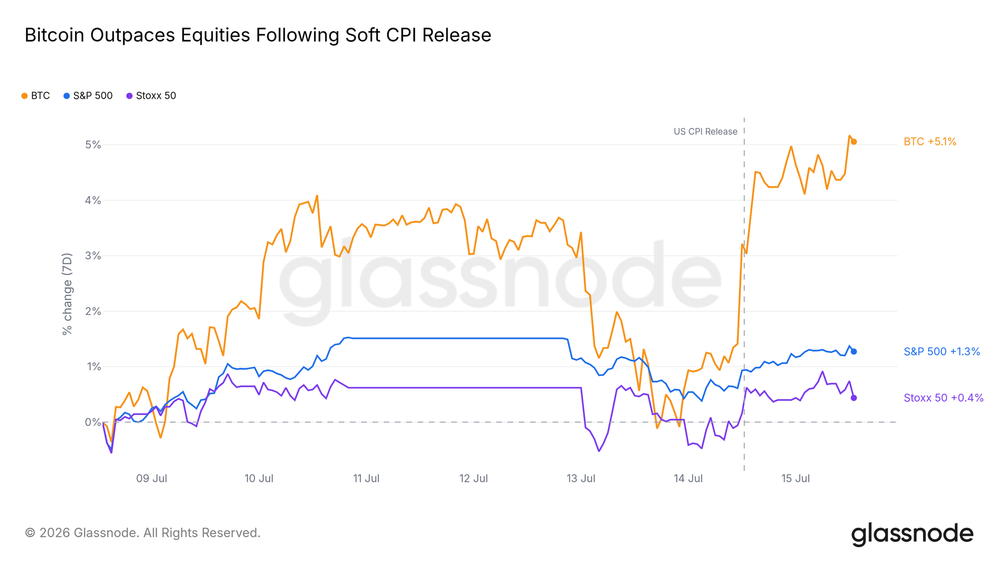
- Bitcoin's reaction to weak inflation data has been much stronger than any major stock index, marking the most positive response to favorable news in weeks.
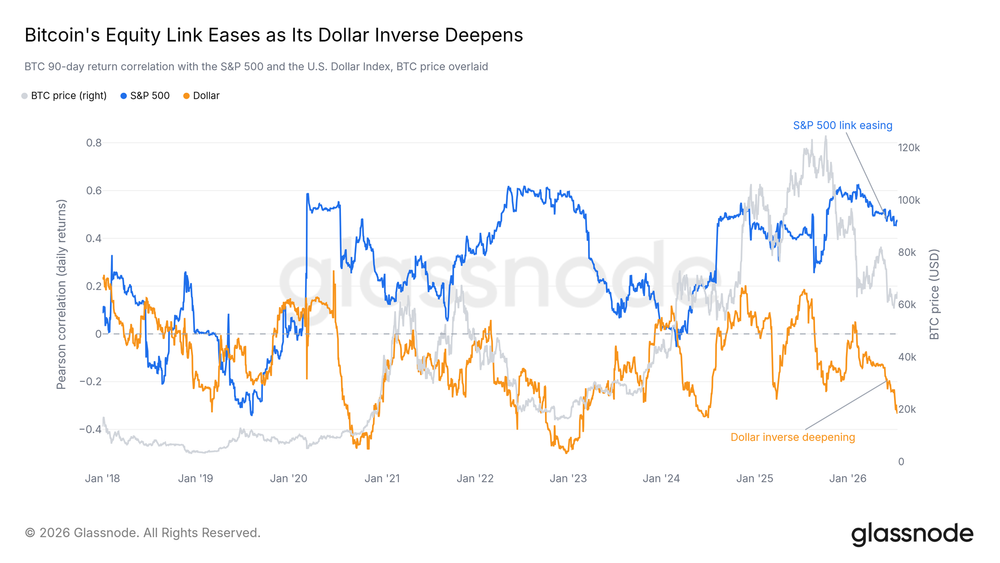
- The correlation with the stock market is loosening, while the reverse correlation with the dollar is deepening—current drivers are liquidity, not risk appetite.
- Capitulative selling from long-term holders, the main source of selling pressure this year, has fallen from its peak.
- Profit-taking behavior has significantly decreased, with buying having completely absorbed the selling pressure from the June lows, reducing supply pressure on each rebound.
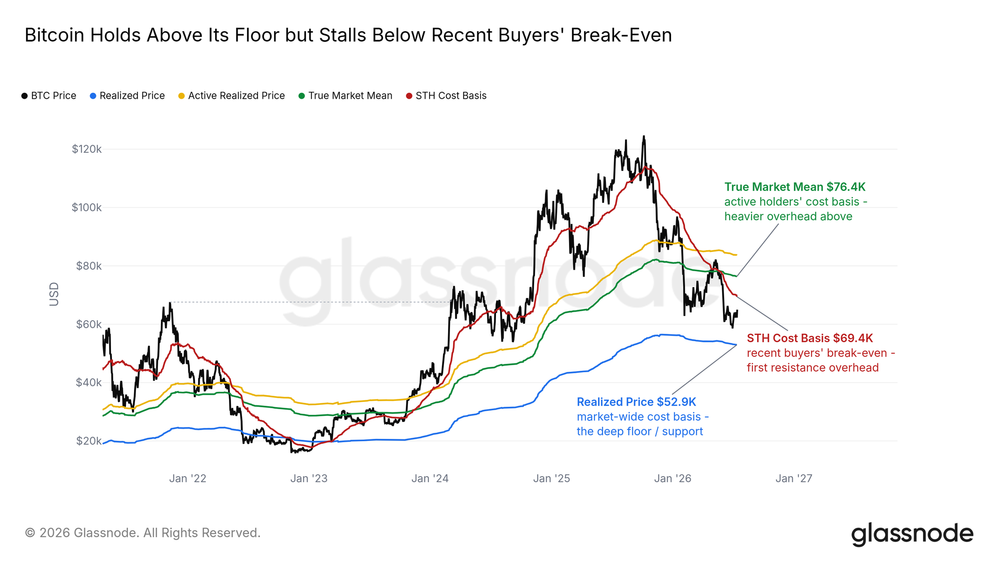
- The cost basis for short-term holders is near $69,000, which is the breakeven line for recent buyers and will become the next important resistance; strong reactions are expected there.
- Derivatives traders are unwinding short positions, but spot buying has not yet followed, a missing link in the current recovery.
Macroeconomic Insights
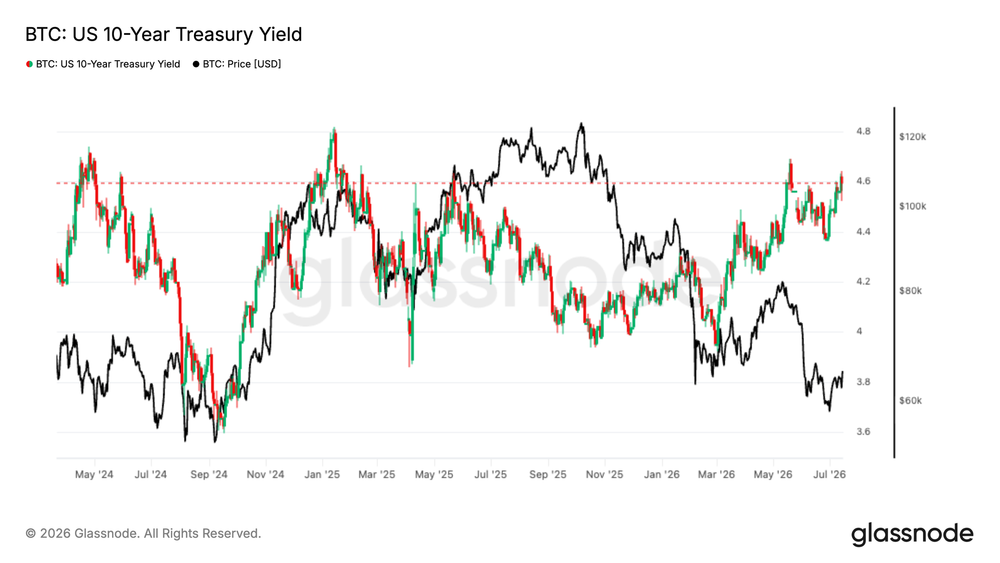
This quarter's pressure on Bitcoin fundamentally revolves around the real interest rate story, not risk aversion. The 10-year real yield has risen to approximately 2.4%, near its highest level since 2026, while the dollar has remained above the 200-day moving average since May. However, broader risk assets have not shown pressure: the stock market is near highs, credit spreads are low, and volatility remains moderate.
Bitcoin Leads the Rebound
After the moderate inflation data was released on Tuesday, Bitcoin's gains exceeded those of any other major asset. It quickly surged in response to the data and has outperformed US and European stocks significantly throughout the week. After a month of trading sideways at lows, the market has begun to respond positively to favorable news again.
This sensitivity is a signal in itself: a market eager to rise based solely on inflation data often indicates that sellers are exhausted and buyers are just waiting for a reason.
Shift in Macroeconomic Driving Logic
Underneath the rebound, Bitcoin's driving factors are changing. Since winter, its correlation with the US stock market has continued to weaken, while its reverse relationship with the dollar has deepened. Bitcoin is increasingly resembling an asset that strengthens as the dollar weakens, rather than a proxy for stocks.
It has not detached from the realm of risk assets, but the current influence of the dollar and liquidity channels has surpassed that of stock market sentiment. If the macro environment eases from here, this channel is most likely to transmit first.
On-chain Insights
Between the Floor and the Ceiling
The cost basis chart accurately depicts the current position. Bitcoin's price is above the average realized price across the network—an inherent support level for bear markets; yet it is below the short-term holder cost basis (around $69,000)—the average entry price for buyers over the past five months. The current recovery is climbing toward this breakeven resistance level, with many trapped buyers above waiting to break even.
First touching this position is likely to trigger a strong reaction, as those most inclined to sell are the ones who are just about to break even. A successful recapture will open up space for recovery; if rejected, the range-bound pattern will continue.
Sellers Stop Taking Profits
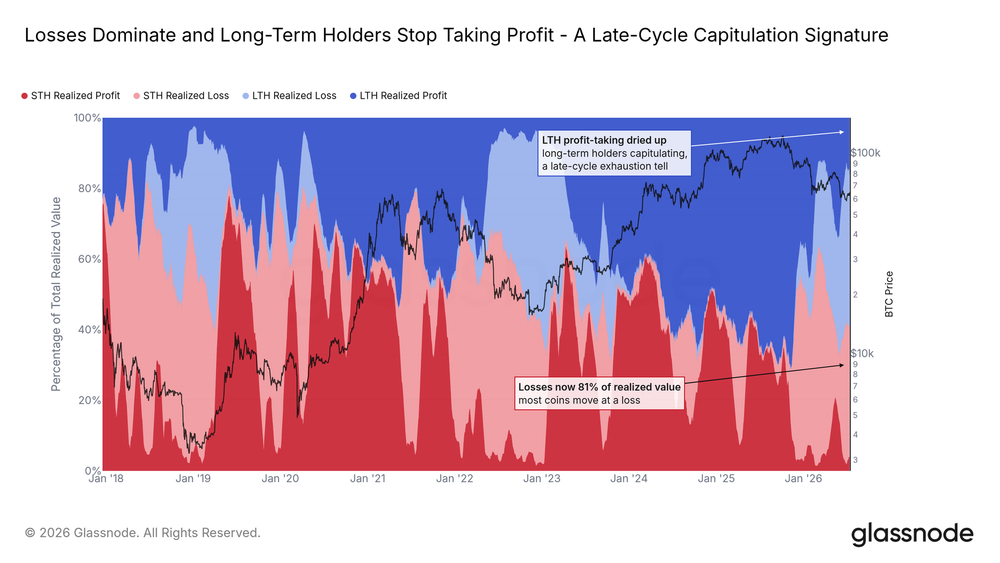
The long/short holder realized profit and loss relative indicators have categorized all on-chain selling behavior into four groups: veterans and newcomers, each selling under profit or loss conditions. For most of this cycle, long-term holders dominating profit-taking were driving the selling pressure. This flow has now nearly dried up; long-term holders currently selling are predominantly in losing positions.
The loss selling from both groups constitutes the main transaction characteristics on-chain, which is a typical signal in the later stages of a bear market. A key change is that the percentage of selling by long-term holders has stopped increasing. The waves of selling pressure that have faced each rebound this year are no longer expanding.
Capitulative Selling Begins to Cool
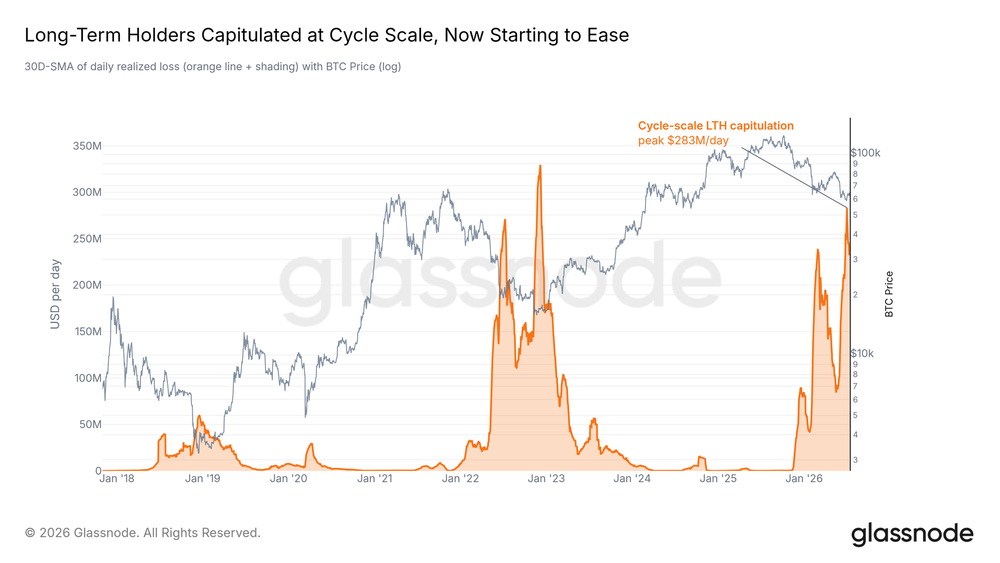
This capitulation rhythm is the current most important indicator. The adjusted long-term holder realized loss indicator has excluded internal transfers, accurately reflecting the actual volume veterans are giving up daily. This indicator hit a cycle peak two weeks ago, and in last week's report, we clearly pointed out that the cooling of this indicator is a prerequisite for any sustainable recovery.
It has now begun to decline. A single decline cannot prove it has fully exhausted; further shocks could still reignite selling. However, this is the first time in this cycle that a core indicator defining the bottom process has shifted from rising to falling. The main sellers driving this bear market are marginally exhausting.
Demand Absorbs Selling at Lows
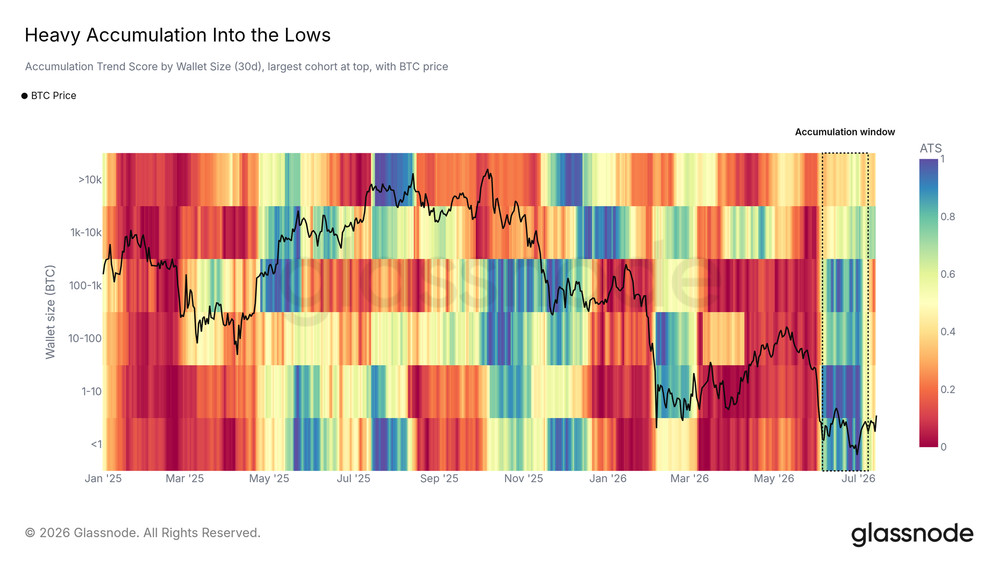
As veterans capitulate, buyers have entered the market in a timely manner. The cumulative trend scores categorized by wallet size show a broad and strong wave of buying during the June lows, covering everything from small to large wallets. After prices stabilized, this intensity weakened, and the market entered a wait-and-see mode.
The coins sold at the lows found new buyers. In the next fluctuation, whether these buyers can return with equal strength will determine whether this bottom can hold.
OTC/Derivatives Insights
ETF Outflows Slow Down
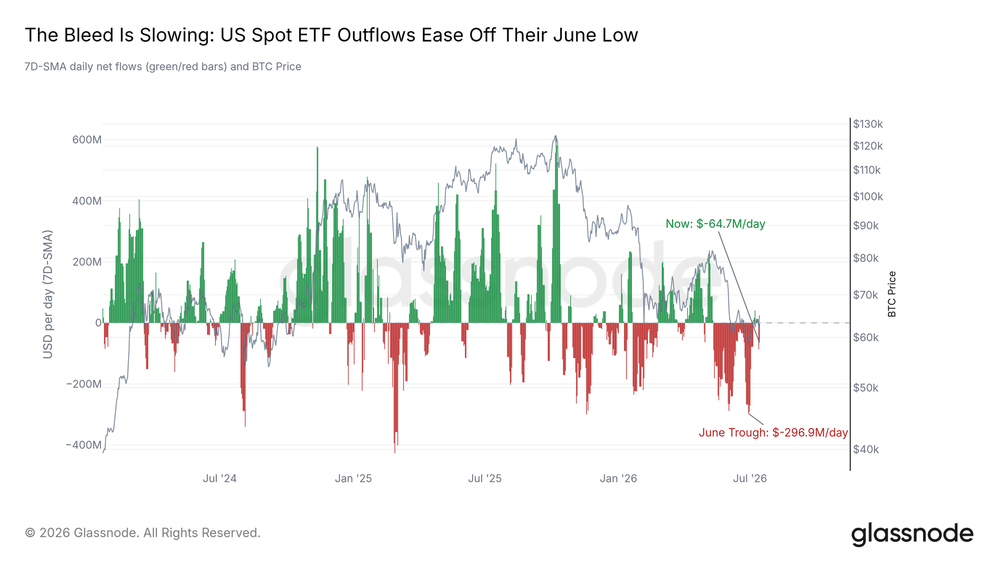
The US spot ETFs tell a consistent story of pressure relief that has yet to be resolved. Redemption pressure has significantly decreased from the extreme levels in June, and the trend points toward stabilization. However, the channels have not fully repaired: on one day this week, there was still the largest single-day outflow in weeks, followed by some replenishment the next day.
This remains a market where institutions have stopped fleeing but have not yet started buying, before real inflows return and stabilize.
Bears Abandon Resistance
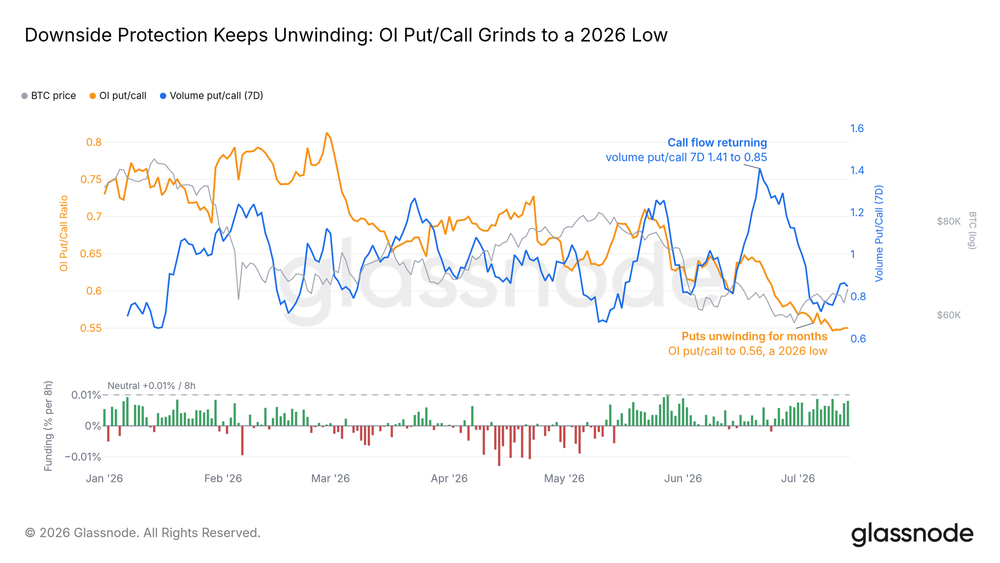
The derivatives market has moved in the opposite direction for weeks. The put/call ratio for options has dropped to a year-low, with traders allowing bearish protection to expire; perpetual contract funding rates are only slightly above neutral, far from crowded bullish levels. Short positions are quietly and steadily exiting.
However, this closing has not led to actual buying. Adjustments by futures and options traders do not equate to liquidity entering the spot market, which is the clearest warning in the current recovery.
Fear Premium Eases
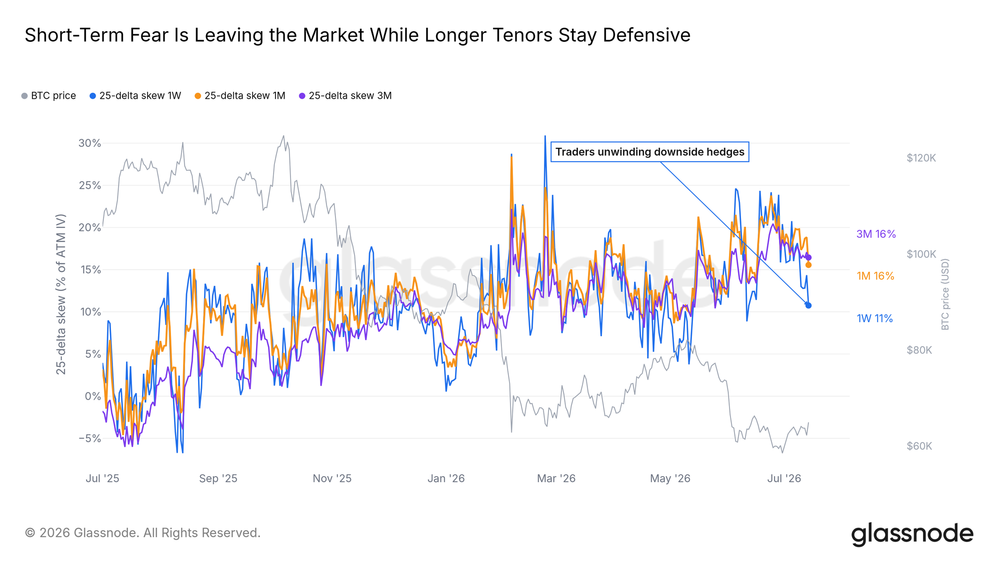
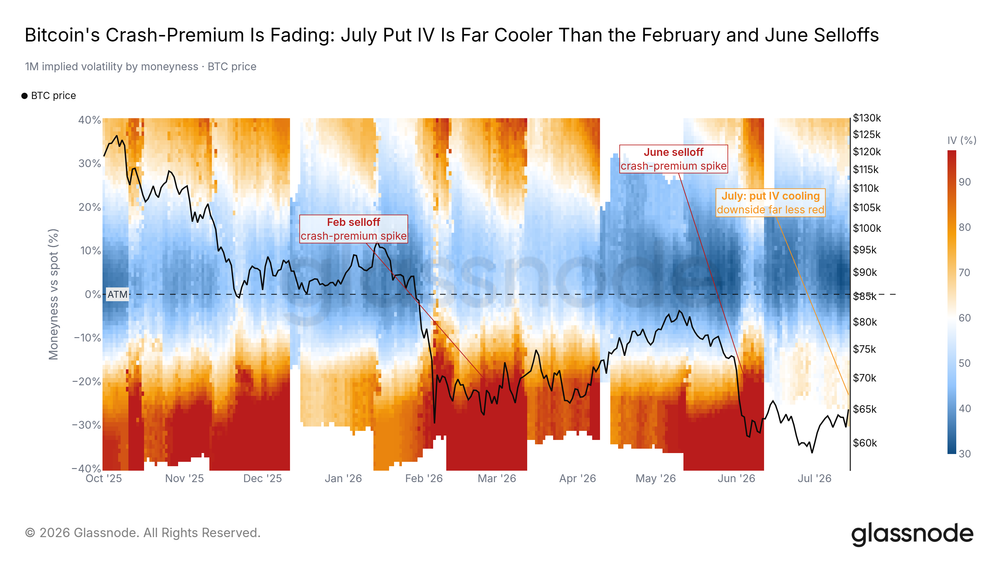
The premium for crash protection in the options market (measured by the 25-Delta Skew) soared during the June sell-off and has since continued to decline, currently far below the extreme levels seen in February. The hedging costs for each pullback have noticeably decreased compared to a month ago.
Protection demand still exists—as it should before lows are confirmed—but the overall direction is tending toward normalization.
Approaching Max Pain
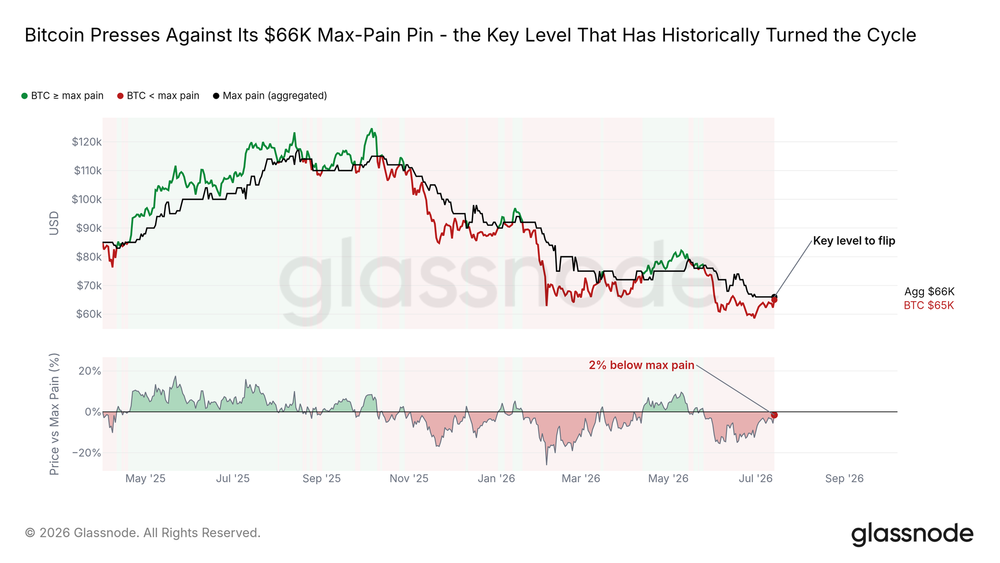
Max Pain represents the price at which the largest share of open options expires worthless, and the spot price has fluctuated around it this year. Bitcoin is currently just below this level and has begun to challenge it for the first time in weeks.
Historically, recapturing Max Pain often aligns with a market turning toward a more favorable environment, although the transition takes time. Cleanly standing above this position would be the first structural signal of an upward breakout from the range; if rejected, it would confirm the cautious sentiment still priced in the options market.
Cost of Crash Protection Decreases
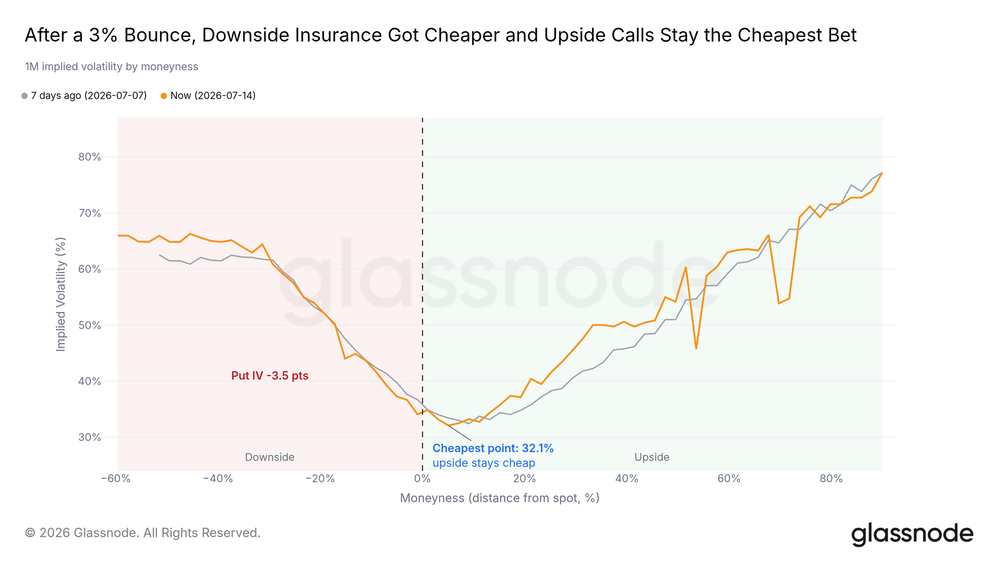
Absolute protection costs have also confirmed the easing trend. During the recovery, the price of one-month crash protection has steadily declined, indicating a weakening of hedging demand. The market is still paying premiums for downside protection, but far below the levels seen at the lows.
Volatility Enters a Calm Phase
A longer-term perspective shows how calm the market has become. The Bitcoin Volatility Index (DVOL) is near a year-low, and the deep bearish pressures that erupted in February and June have dissipated from the volatility surface. Such compression rarely lasts, typically serving as a backdrop before the next decisive price action begins.
Conclusion
The bottom is still being built, and it has started to respond this week. Long-term holder capitulation has receded from its peak, profit-taking has exhausted, and the June lows have been widely absorbed by buyers. Bitcoin's response to favorable macro factors has outperformed other assets, nearing Max Pain from below and approaching the short-term holder cost basis above—there will be the first real test faced in the recovery.
A confirmation signal has yet to appear: ETF outflows have slowed but not reversed, derivatives winding down lacks spot follow-through, and volatility compression awaits a catalyst. The key signal to change judgment would be spot-driven buying pushing prices to break and hold the short-term holder cost basis effectively. If long-term holders’ losses accelerate again or prices are driven back near the realized price, the market will return to a range-bound state.
The foundation has been laid, but follow-through has yet to come.
免责声明:本文章仅代表作者个人观点,不代表本平台的立场和观点。本文章仅供信息分享,不构成对任何人的任何投资建议。用户与作者之间的任何争议,与本平台无关。如网页中刊载的文章或图片涉及侵权,请提供相关的权利证明和身份证明发送邮件到support@aicoin.com,本平台相关工作人员将会进行核查。


