Author: Claude, Deep Tide TechFlow
Deep Tide Preface: The latest data from CryptoQuant analyst Crazzyblockk shows that BTC exchange leverage deployment has entered an extreme range in the top 5% historically, with borrowed margin far exceeding spot liquidity. Coupled with the record outflow of $4.5 billion from ETFs in June and BTC dropping from $126,000 to around $64,000 throughout the year, a violent deleveraging may just be a matter of time.
BTC has dropped from last year’s historical high of $126,000 to around $60,000, with a nearly 50% decline over six months. However, on-chain data shows that the market's leverage level has not shrunk in sync with prices.
CryptoQuant analyst Crazzyblockk released a bearish analysis on July 15, with a core conclusion distilled into one sentence: Current BTC exchange leverage deployment is in the extreme range of the top 5% historically, and deleveraging is not a matter of probability, it's a mathematical inevitability.
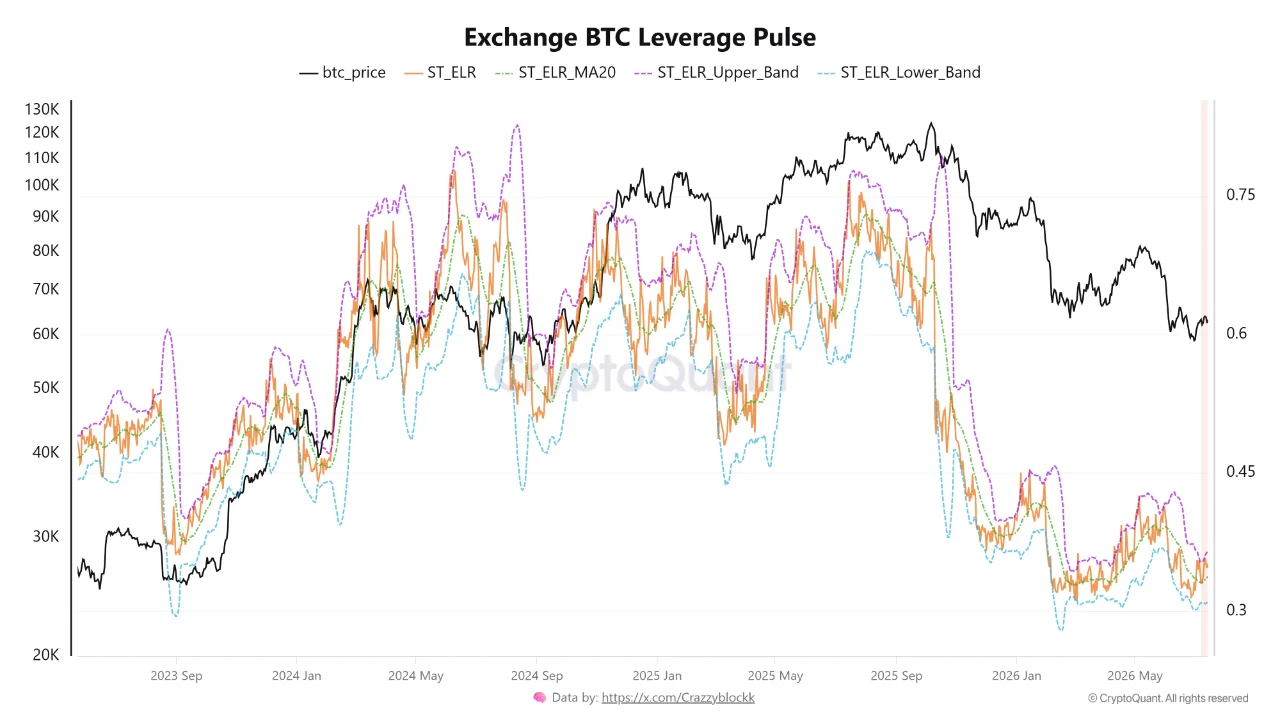
Leverage Pulse Indicator Breakdown: Borrowed Money Far Exceeds the Capacity to Absorb Selling Pressure
The core indicator used by Crazzyblockk is called "Exchange BTC Leverage Pulse," which is essentially a ratio: the size of open contracts on exchanges divided by the reserves of stablecoins on those exchanges.
Open contracts represent the total amount of leveraged positions deployed in the market, while stablecoin reserves serve as the "dry powder" that can be used to buy or absorb selling pressure at any time. When this ratio is too high, it means that the money borrowed in the market far exceeds the spot funds available to absorb the selling.
Crazzyblockk's data shows that this indicator has recently surpassed the historical upper risk threshold, and is still significantly above the historical average at the time of writing. His judgment is that the current price rebound is built on borrowed margin lacking support from spot liquidity, indicating that traders are "running on fumes."
From the charts he released, after multiple breaches of the upper limit of this indicator in 2024 and 2025, BTC prices have seen severe corrections. During the downturn period from October 2025 to early 2026, this indicator plummeted from high levels to near the lower limit, aligning with BTC's drop from $126,000 to $60,000.
Appearantly Bullish, Fundamentally Extremely Weak
Crazzyblockk points out that this leverage structure creates a dangerous psychological trap.
On the surface, rising prices create a risk appetite sentiment that attracts retail investors to leverage long. However, the underlying insufficient stablecoin reserves constitute a massive risk closure trigger. Market makers and institutional funds can see this top-heavy order book structure. When leverage far exceeds the average and there isn't enough capital to support it, prices tend to violently correct downwards to liquidate those overly extended positions.
His operational advice is straightforward: cut your leveraged positions, protect spot holdings, and consider new entry points only after the leverage indicators have cooled down. "Don't become someone else's exit liquidity."
ETF Continues to Bleed: Monthly Outflows Set Historical Records
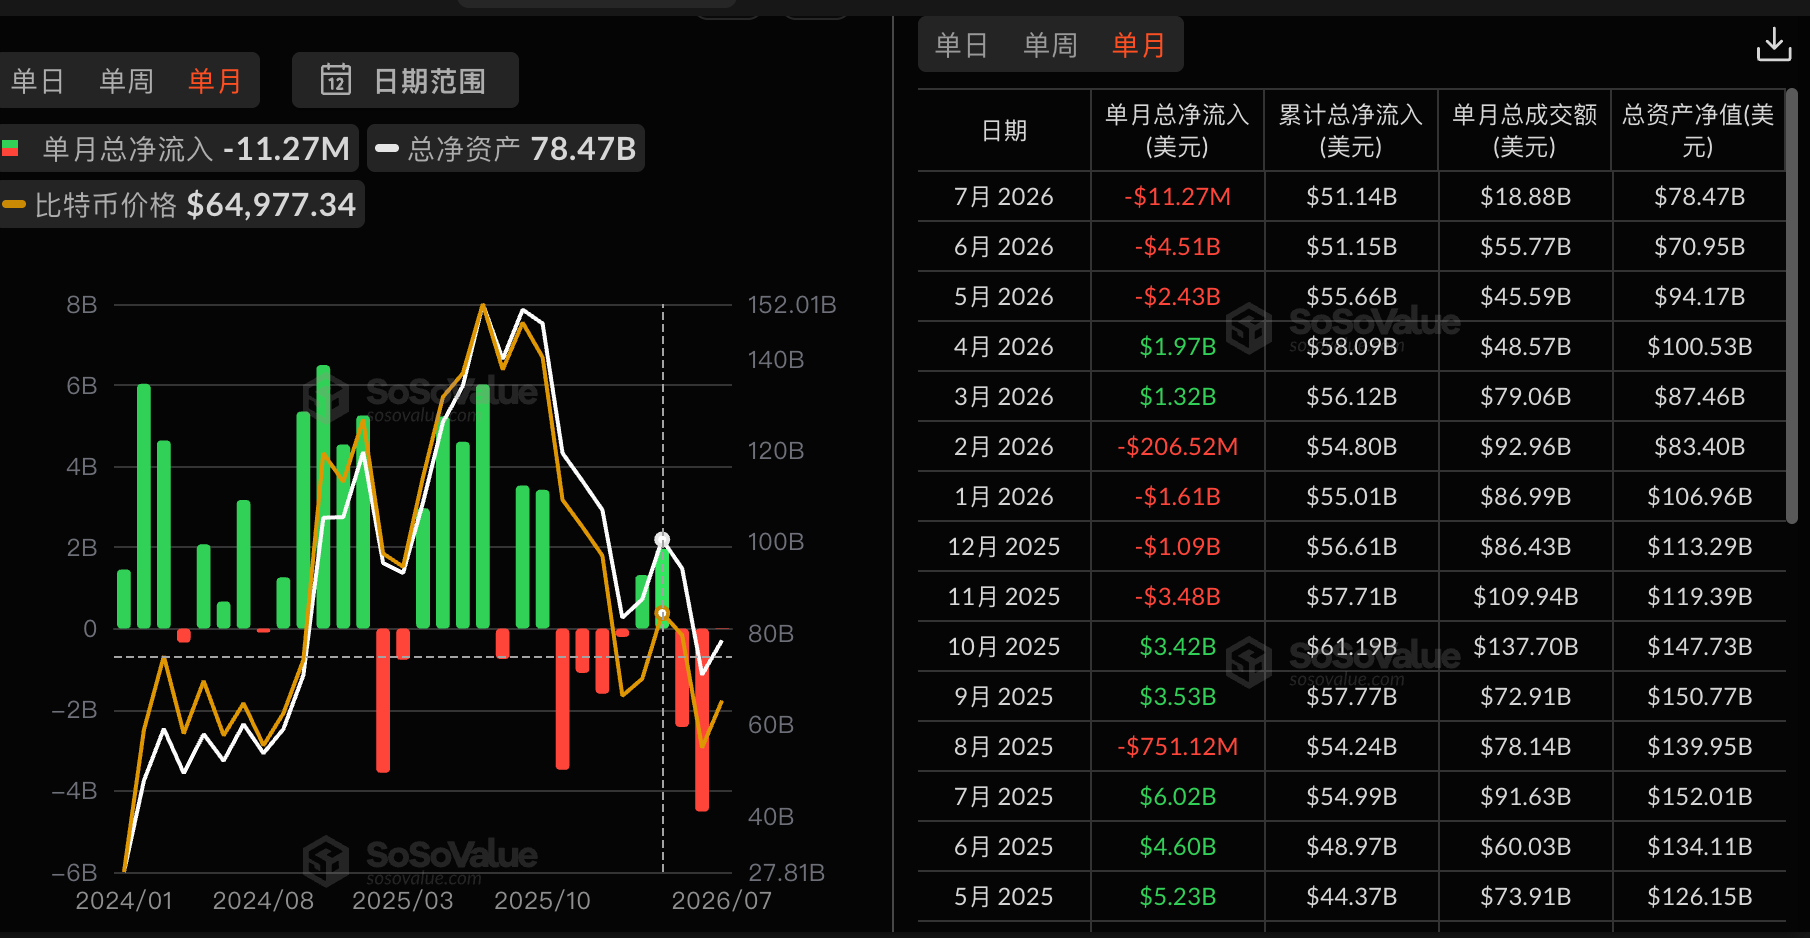
Crazzyblockk's leverage analysis is not an isolated signal. The U.S. spot BTC ETF recorded the largest monthly fund outflow since its launch in January 2024, totaling $4.51 billion in June 2026.
This wave of outflow persisted for eight consecutive weeks, accumulating over $8.2 billion, before briefly interrupting in early July. Between July 2 and July 6, there was a net inflow of $510 million over three trading days, with BlackRock's IBIT contributing $209 million in a single day, but relative to the net outflow of about $5.4 billion year-to-date, this is merely a drop in the bucket.
The impact of ETF outflows lies in its transmission mechanism. When institutional investors redeem ETF shares, authorized participants must sell the underlying BTC on the spot market to redeem cash. Research estimates that ETF fund flows can explain about 45% of weekly BTC price fluctuations. This means that ongoing redemptions are not just emotional noise but real, rule-driven selling pressure.
According to Glassnode data, the average entry cost for buyers of spot BTC ETFs is approximately $83,800. BTC is currently trading around $64,000, meaning a typical ETF holder is at a loss of over 23%. Holders in a loss position tend to sell during rebounds rather than increase their positions, further suppressing the incentive for capital inflow.
Recovery in Derivatives and Disconnection from Spot: A Classic "House of Cards"
Analysis from Crypto Times on July 9 pointed out that the BTC leverage ratio rebounded quickly from a low of 0.156 on June 30 to 0.25, the highest level during the observation period. The derivatives market showed signs of stabilization, with open contracts ceasing to decline and funding rates turning positive, indicating a slight bullish bias.
However, the spot market did not keep pace. Inflows of stablecoins and ETF funds failed to match the levels seen during previous bull market phases, making the market susceptible to volatility shocks.
This is exactly the structural issue that Crazzyblockk raised at the end of May. He analyzed Binance trading data at that time, indicating that BTC derivatives trading accounted for 88.65%, while spot trading shrank to less than 15%. In such a thin spot liquidity environment, even relatively small spot sell-offs can trigger chain liquidations that amplify price fluctuations.
The Federal Reserve Meeting on July 28-29 is the Biggest Short-term Variable
BTC is caught between a clearly defined bottom around $58,000 and a descending resistance level around $63,800 near the $60,000 mark, likely experiencing weak sideways fluctuations until the Federal Reserve meeting on July 28-29 forces the market to choose a direction.
The market currently gives approximately a 70% probability for the Federal Reserve to maintain interest rates on July 29, with tail risks pointing towards rate hikes rather than cuts. In this monetary environment, BTC, as a high-beta risk asset, finds no breathing space.
However, another set of data from CryptoQuant provides a relatively optimistic reference: the realized profit-and-loss ratio for BTC has dropped to -0.35, the lowest level since the FTX crash in December 2022. Historically, the same readings in 2022, 2019, and 2015 marked cyclical bottoms. Bitwise Chief Investment Officer Matt Hougan also noted that the plunge on June 25 has squeezed out excess leverage, and the market is approaching a bottom.
The problem is that there may still be a violent deleveraging separating "approaching a bottom" from "having reached the bottom." Crazzyblockk's leverage pulse indicator addresses this: mathematically, a reset is needed to bring the indicator back to a balanced position. For holders, this means that any rebound may be an illusion before the leverage cools.
免责声明:本文章仅代表作者个人观点,不代表本平台的立场和观点。本文章仅供信息分享,不构成对任何人的任何投资建议。用户与作者之间的任何争议,与本平台无关。如网页中刊载的文章或图片涉及侵权,请提供相关的权利证明和身份证明发送邮件到support@aicoin.com,本平台相关工作人员将会进行核查。


