Cryptocurrency Expert: 7.16 Ethereum (ETH) Technical Formation Points to New Highs, Upper Space Beyond Imagination? Latest Market Analysis Reference
The current price of Ethereum is 1922. To be honest, more people around me are missing out than making money during this wave of Ethereum rebound. It's not that there hasn't been an opportunity to get in, but rather that they are always thinking of waiting for it to drop more before entering. As a result, they wait longer and longer, only to either chase in at high positions and get stuck, or just give up outright. In fact, when trading, the biggest fears are perfectionism and emotionality. If you look at these past few days of K-lines, every time it pulls back to the moving average, it is an opportunity to get in, but many people are scared off by the previous downturn and dare not act. Now that the northward trend is just starting, we can say we've caught on around 1600, and the rest is left to time.
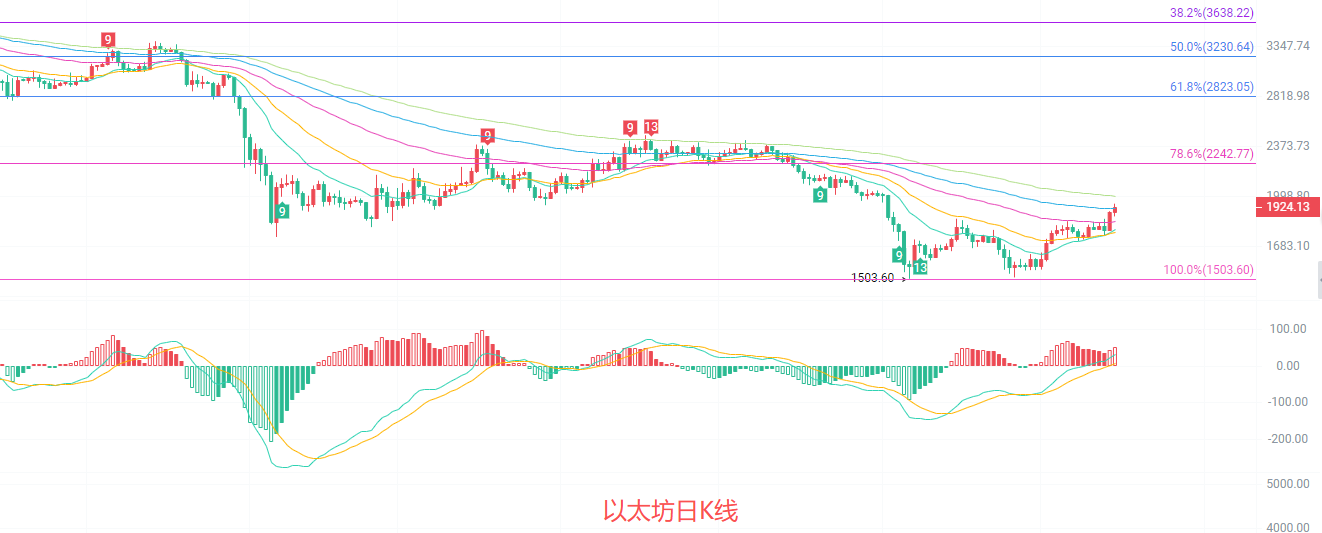
The daily K-line has closed with a positive candlestick, stabilizing above the 1900 mark. The price has broken through the key resistance zone below the previous Fibonacci 78.6% retracement level of 2242. The MACD red bars continue to expand, with the DIF and DEA crossing upwards above the zero axis, showing strong northward momentum. The Bollinger Bands are opening upwards, with the price moving along the upper band, and the EMA15 and EMA30 moving averages are arranged northwards, indicating a clear short-term bullish trend. However, there is certain resistance at the 2000 round number and near the EMA120 around 2002, so we need to be wary of the risk of pulling back after reaching highs.
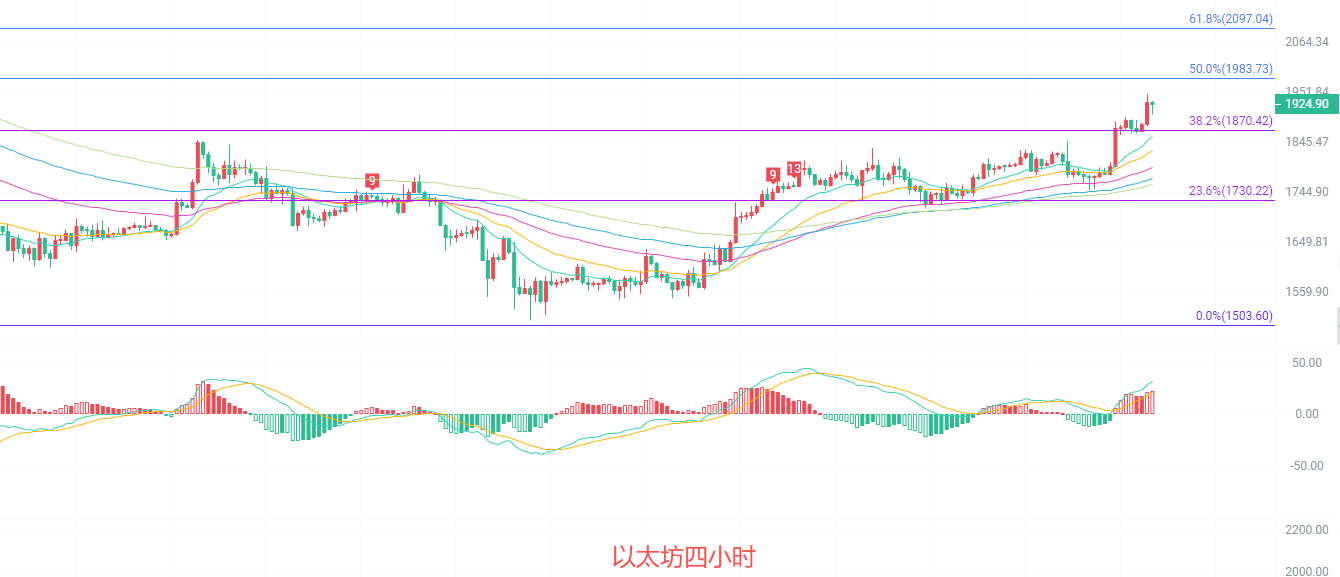
The four-hour K-line continues to rise along the upper band of the Bollinger Bands, with the current quote at 1923, having broken through the 38.2% Fibonacci retracement level of 1870. The EMA15, 30, and 60 moving averages are arranged northwards, with the price consistently standing above the short-term moving averages, and support continuing to rise. The MACD red bars are expanding moderately, with the DIF and DEA maintaining above the zero axis, showing a stable northward rhythm. However, the upper band of the Bollinger Bands is starting to narrow, and the price has entered a key pressure zone from the previous decline, so we need to pay attention to the effectiveness of support near 1870 in subsequent pullbacks, avoiding getting caught by chasing highs.
Short-term Reference:
If the lower level of 1880 to 1850 does not break down, it will go north, stop loss at 1800, target at 1950 to 2000.
If the upper level of 2000 to 2050 does not break up, it will go south, stop loss at 2100, target at 1950 to 1900.
Specific operations should rely on real-time market data, and for more detailed information, feel free to consult the author. The article may be delayed in publication and is suggested for reference; risks are borne by the reader.

Friendly reminder: The content above is solely created by the author on the official account. Advertisements at the end of the article and in the comment section are unrelated to the author. Please identify carefully. Thank you for reading.
免责声明:本文章仅代表作者个人观点,不代表本平台的立场和观点。本文章仅供信息分享,不构成对任何人的任何投资建议。用户与作者之间的任何争议,与本平台无关。如网页中刊载的文章或图片涉及侵权,请提供相关的权利证明和身份证明发送邮件到support@aicoin.com,本平台相关工作人员将会进行核查。