7.16 Cryptocurrency Mr. Coin: Ethereum (ETH) Market Analysis Reference
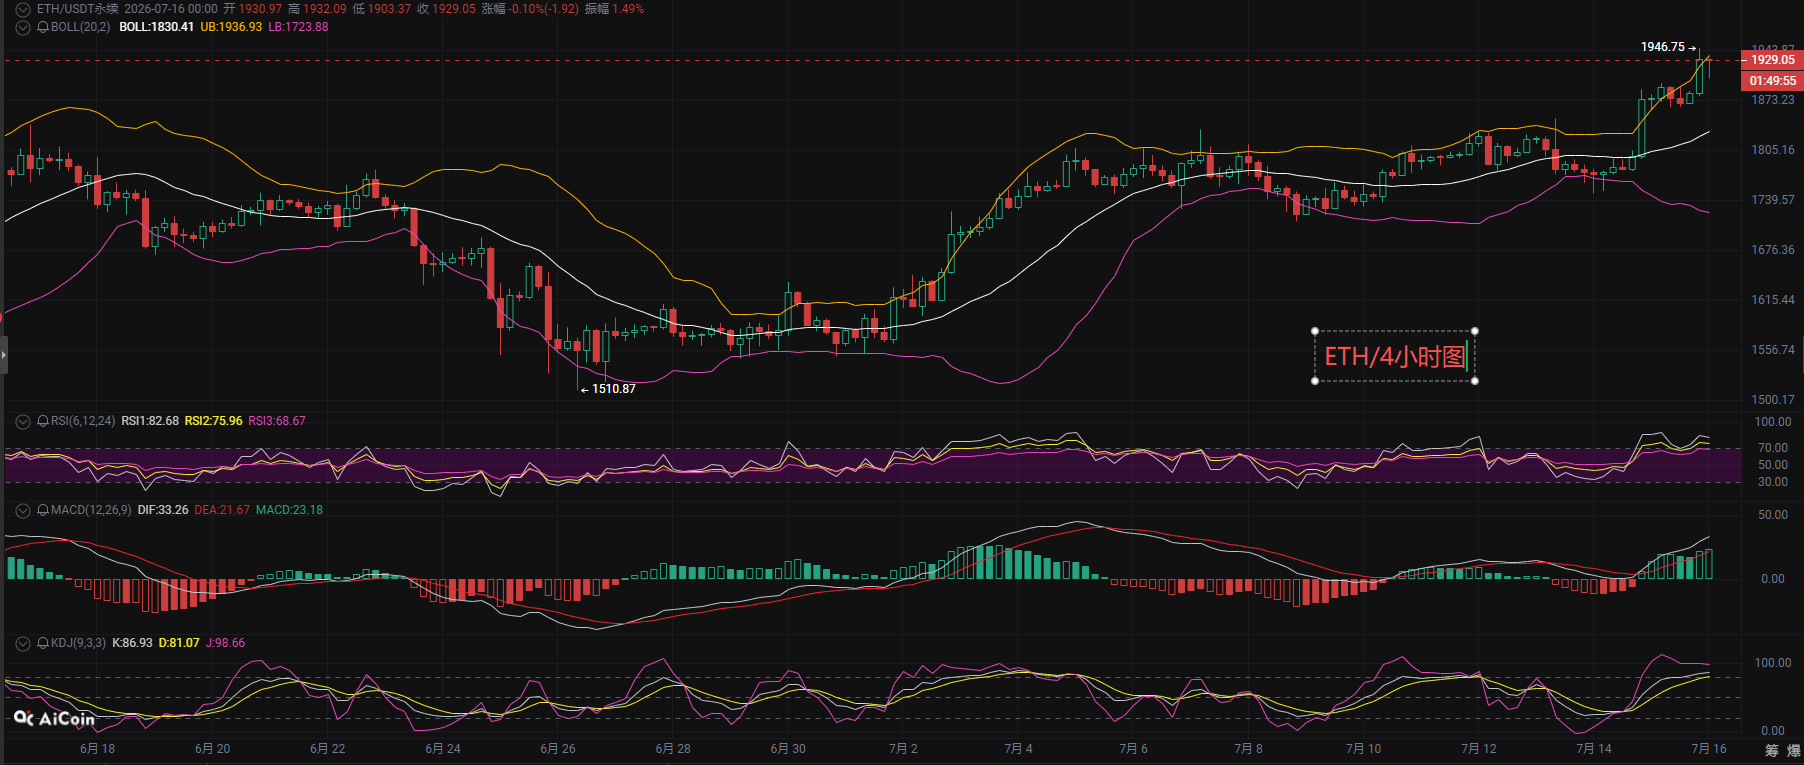
Let’s analyze the current Ethereum market based on the all-day trend. First, looking at the daily chart over a larger time frame, this round of persistent oscillation to the upside is ongoing, currently priced around 1925, with a daily increase of 2.8%. The daily Bollinger Bands are steadily opening upwards, the MACD red bars continue to expand, and the RSI has reached 79.93, nearing the overbought territory. The medium-term bullish trend has been established, with strong resistance at the daily high of around 1946; staying above this level is necessary to test the 2000 mark. The key daily support is at 1800; as long as this current upward trend does not break, it will not reverse. Now looking at the 4-hour time frame, the market started from a low of 1747, with consecutive large bullish candles rising. The upper Bollinger band has faced pressure and retraced, the RSI value at 78.66 is in the high overbought area, and the KDJ indicator has peaked, indicating a clear need for short-term pullback and correction. The 4-hour support range is between 1890-1850, which serves as a dividing line for bullish strength.
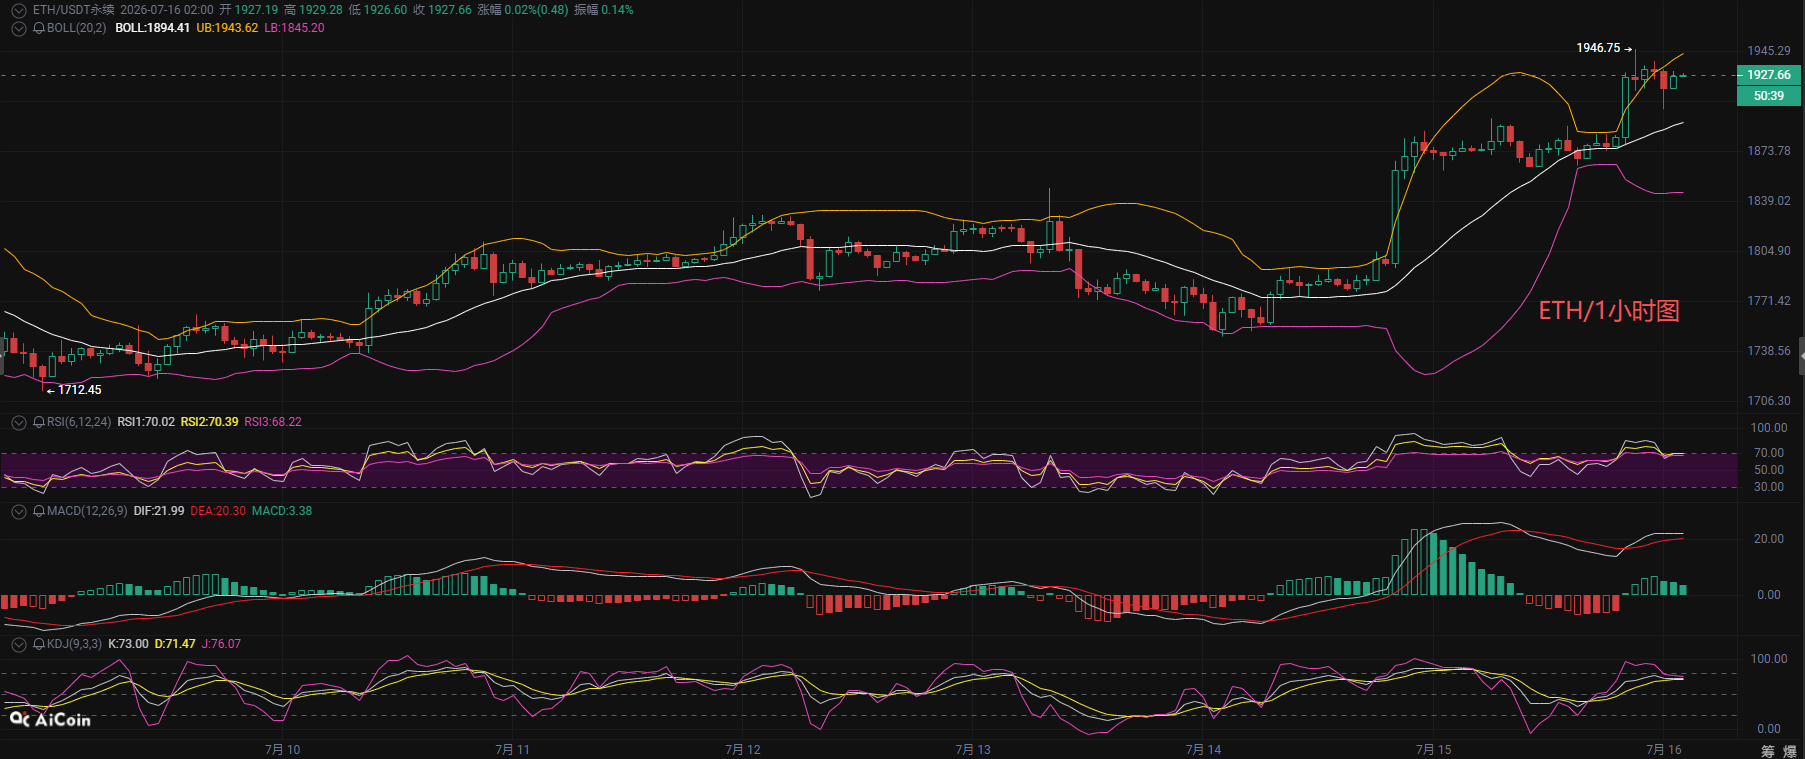
In the 1-hour chart, the short-term bullish momentum can be visually observed to be weakening. After reaching a high of 1946, prices remain fluctuating at high levels. The upper Bollinger band is forming resistance, the MACD red bars have significantly contracted, and the bullish buying force is also weakening. The short-term trend is undergoing consolidation, but the support is rising, and the short-term trend has not changed; overall, the short-term structure still looks healthy. To clarify the practical approach: for friends holding long positions at lower levels, the current price is close to the resistance level; take partial profits and reduce positions, and wait for a pullback to stabilize at the 1900-1880 support before re-entering long positions, with the stop loss set below the intraday low of 1860; for those looking to engage in short-term speculative trades, wait for prices to attempt a second push higher without breaking the 1946 high and see if the hourly line closes as a bearish candle before cautiously trying a short position, with the stop loss above 1950; for conservative friends, do not chase the price at high levels, patiently wait for a pullback to support before planning, to avoid losses caused by spikes after price rises. The above is merely a technical sharing of the market and does not constitute any investment advice. Follow Mr. Coin to get real-time market analysis.
7.16 Short-term Reference for Ethereum:
Short below 1955, defend at 2020, target below 1900,
Long below 1870, stop loss of 50 points, target above 1910,
Updates may be delayed; the strategy suggestions are for reference only. The market changes rapidly, and regardless of how confident you are in market judgment, be sure to manage your take-profit and stop-loss effectively to secure your earnings.
For more real-time trading strategies and online technical learning, follow the mentor's public account (Mr. Coin Talks Coin) for the addition method: the first ten each day can receive free recovery strategies.

免责声明:本文章仅代表作者个人观点,不代表本平台的立场和观点。本文章仅供信息分享,不构成对任何人的任何投资建议。用户与作者之间的任何争议,与本平台无关。如网页中刊载的文章或图片涉及侵权,请提供相关的权利证明和身份证明发送邮件到support@aicoin.com,本平台相关工作人员将会进行核查。