Academician of the Cryptocurrency Circle: On July 16, the Bitcoin (BTC) cycle pattern provides answers, is the trend about to become clear? Latest market analysis and operational advice breakdown
Currently, Bitcoin is at 65000, many people are frantically trying to bottom-fish below 64000, and some are caught after chasing high near 65000. The market now resembles a twisted contradiction, neither wanting to drop below significant support nor having the strength to break upwards. The most stable method is to wait for a retracement to ride along, while friends who have already secured positions below 60000 should stay steady and hold tight.
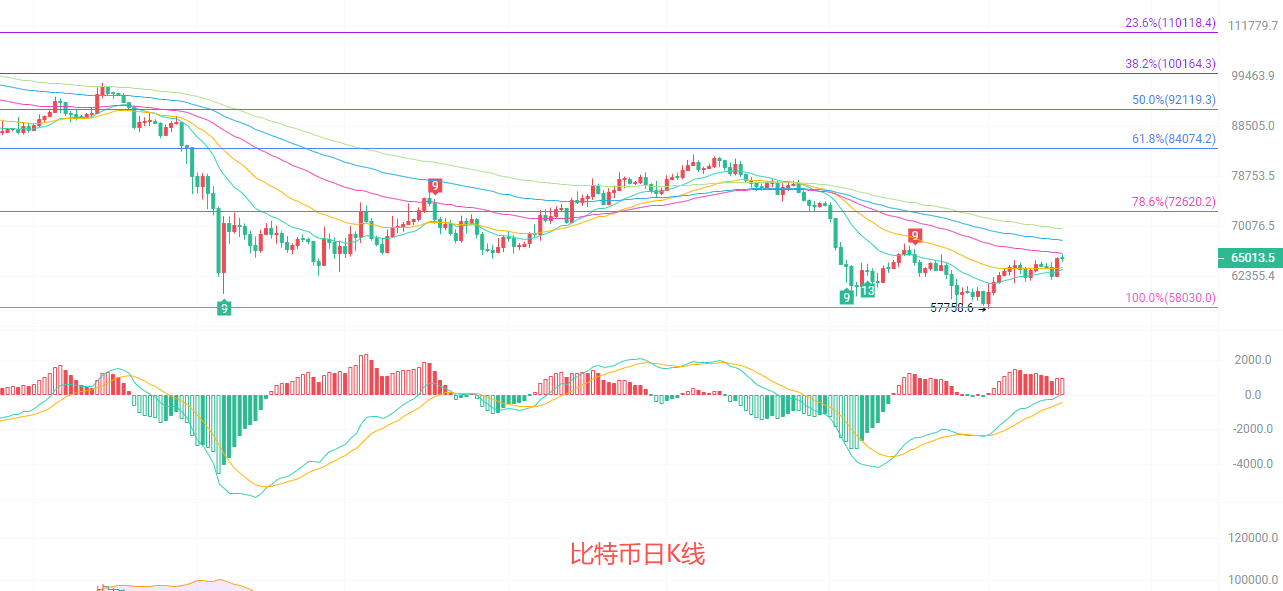
The daily candlestick chart is located between the Fibonacci 78.6% and 100% retracement zones from the previous decline, with short-term stability within the rebound channel after the low point of 57758. The EMA moving averages are arranged downwards but are showing a short-term turn, with the 15EMA and 30EMA forming support below, and the price has risen above these two moving averages but is still under pressure from the 60EMA and 90EMA. The MACD indicator's DIF is crossing above the DEA, with the red bars continuously increasing, indicating that the rebound momentum is still present; the midline of the Bollinger Bands at 62304 is moving upwards, with the price situated between the midline and the upper line at 66080, indicating a slight bullish bias for the short-term, but there has been no breakthrough of the upper line resistance, and the trend has not yet reversed.
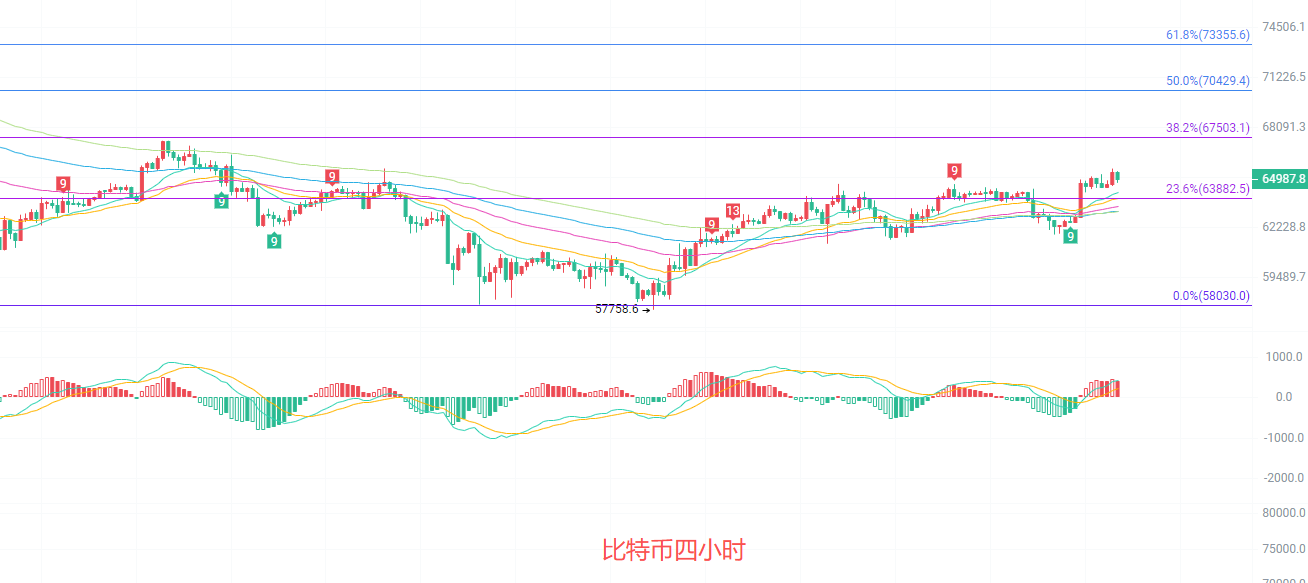
On the four-hour candlestick chart, the price has risen above the EMA15, 30, 60, and 90 moving averages, changing the arrangement from downward to upward and then diverging, forming a short-term ascending channel. The Fibonacci 23.6% level has been breached, creating strong support below, while the 38.2% level is providing pressure above. The MACD indicator has its DIF running above the DEA, with the red bars maintaining above the zero line; although the upward momentum has diminished, there is no significant divergence. The midline of the Bollinger Bands at 63721 is trending upwards, with the price approaching the upper line around 65826, indicating short-term demand for a retracement, while the lower line of the Bollinger Bands at 61616 serves as strong support, overall presenting a pattern of high-level consolidation with a slight bullish bias.
Short-term references:
If it does not break below 64000 to 64500, expect upward movement, stop-loss at 63500, target at 66000 to 66500.
If it does not break above 66000 to 66500, expect downward movement, stop-loss at 67000, target at 65000 to 64500.
Specific operations should mainly refer to real-time market data; for more information details, you can consult the author. The article may have posting delays, advice is for reference only, and risk is to be borne by the reader.

Kind reminder: The above content is solely created by the author of the public account. Advertisements at the end of the article and in the comments section are not related to the author; please exercise caution in discernment. Thank you for reading.
免责声明:本文章仅代表作者个人观点,不代表本平台的立场和观点。本文章仅供信息分享,不构成对任何人的任何投资建议。用户与作者之间的任何争议,与本平台无关。如网页中刊载的文章或图片涉及侵权,请提供相关的权利证明和身份证明发送邮件到support@aicoin.com,本平台相关工作人员将会进行核查。