Coin Circle Liying: 7.16 Bitcoin (BTC) and Ethereum (ETH) Latest Market Analysis
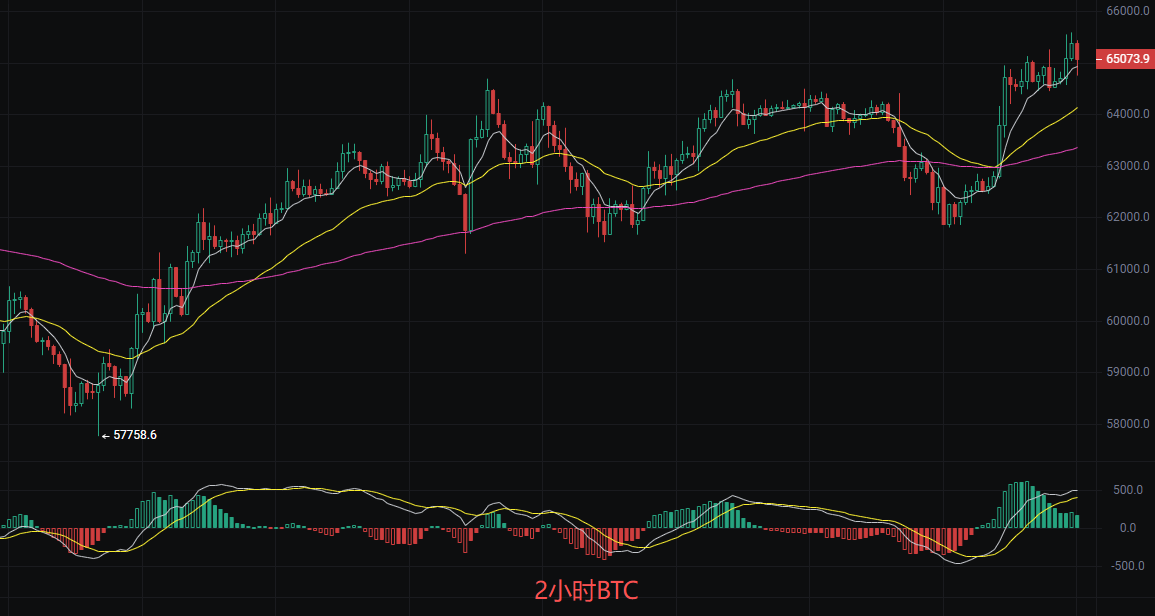
The current price of Bitcoin is 65000. From the chart, after dropping to 57758 previously, it has rebounded all the way. The current price is above multiple moving averages, indicating that bullish strength is dominant. However, it has risen quite a bit in the short term, which may lead to a pullback for consolidation. But the overall trend is still intact, suitable for steady friends to follow the trend. The EMA moving average system shows a bullish arrangement, MACD is above the zero axis with a golden cross, and the red bars continue to expand, indicating sufficient momentum; the middle track of the Bollinger Bands is inclined upwards, and the price is operating between the upper and middle tracks, with the channel opening expanding, which belongs to a typical strong consolidation pattern in an uptrend, with no top signal yet.
Short-term trading ideas reference:
Long entry at 64000-63500, stop loss at 63000, target at 65500 aiming for 66000.
Short entry at 66000-66500, stop loss at 67000, target at 65500 aiming for 64500.
Ethereum
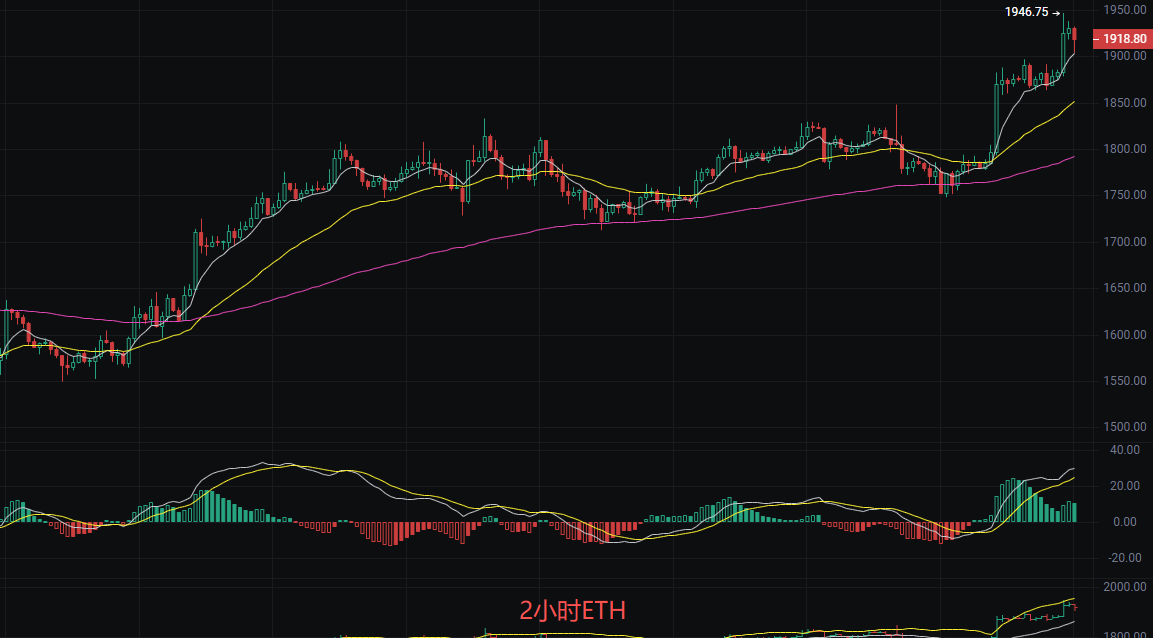
Family, Ethereum was at 1917 before the article was published. In the past few days, the price has been climbing along the short-term moving averages. Although there were minor pullbacks in between, they did not break through the key support, indicating strong buying power. This rhythm of advancing two and retreating one is particularly suitable for following the trend. As long as there is no significant volume break, it is highly likely to continue testing previous highs or even new highs. The EMA system shows a typical bullish arrangement, MACD is above the zero axis, with DIF and DEA running in a golden cross. The upper track is at 1954, and the middle track at 1861 forms dynamic support. The lower track at 1767 is relatively far away, indicating that volatility is expanding and the direction is upward. In summary, technical analysis supports a continued bullish outlook, but attention must be paid to the resistance at the upper track of the Bollinger Bands and the potential risk of MACD top divergence.
Short-term trading reference:
Long entry at 1880, defend at 1840, stop loss at 1800, target at 1950 aiming for 1990.
Short entry at 1980, defend at 2020, stop loss at 2050, target at 1950 aiming for 1900.
The above content is exclusively created by Liying, please indicate the source when reprinting! The publication of the article has a delay in review, and market conditions change rapidly, the above suggestions are for reference only and carry your own risk.

Warm reminder: The above content is only created by the author on Weibo. The ads at the end of the article and in the comments section are not related to the author. Please discern carefully, thank you for reading.
免责声明:本文章仅代表作者个人观点,不代表本平台的立场和观点。本文章仅供信息分享,不构成对任何人的任何投资建议。用户与作者之间的任何争议,与本平台无关。如网页中刊载的文章或图片涉及侵权,请提供相关的权利证明和身份证明发送邮件到support@aicoin.com,本平台相关工作人员将会进行核查。